J@TI Undip, Vol VIII, No 2, Mei 2013 73
ANALISIS PENGARUH KUALITAS JASA TERHADAP
KEPUASAN DAN INTENSI PERILAKU PELANGGAN
DALAM PELAYANAN AIR BERSIH
Hery Suliantoro, Kirana Rukmayuninda Ririh
Lecturer in Program Studi Teknik Industri-Fakultas Teknik, Universitas Diponegoro Program Studi Teknik Industri-Fakultas Teknik, Universitas Diponegoro
Abstract
Nowadays, most of PDAM (Public Drinking Water Services) suffers from bankruptcy, because PDAMs have to pay their loan from an International Funding. There is more than 300 PDAMs in Indonesia trap in financial problem that have to pay credits approximately Rp 5,3 Billion. The main aim of the loan was to rise service level of public service in PDAM, but in fact it turns to be a `boomerang` for PDAM itself in financial and operational fields. Therefore, PDAM could not maximize its public service in expanding pipes to cover public needs of drinking water and advancing water quality. In other side, the number of citizen who need water keeps arise year by year. Today, PDAM Kabupaten Semarang Cabang Ungaran onlycan cover public needs of clear water for about 68%. The less service level in public service cause consuming level in public decreases. The worst would be declining of company income in PDAM Kabupaten Semarang Cabang Ungaran. For improving service quality, structural equation modelling is one of methods and way to identify factors and varibles that need to be improved rapidly. This model was wellknown as a device to evaluate correlation every varible that has significancy to customer satisfaction in PDAM Kabupaten Semarang Cabang Ungaran. For further,recommendation of improvement could be found in this model evaluation. Output of the structural equation modelling shows Reliability, Responsiveness, Assurance, and Emphaty dimensions have a positif correlation and significant to overall satisfaction but tangible dimension has no significant correlatiion. Evaluation of overall satisfaction variable to behavvioural intention shows that overall satisfaction has a positive and significant correlation to word-of-mouth and behavioural intention. Besides, overall satisfaction also has negative and no significant correlation to feedback
Keywords : structural equation modelling, service quality dimension, overall satisfaction, behavioural intention
INTRODUCTION
Reports of production and water distribution showed that distributed-water amount was 4.442.611,73 m3 and reported-water amount was 2.414.820,88 m3. It means leakage level was still high, approximately 2.027.790,85 m3. Technical reports analyze that there was 45,64% lost during distributing the water. Comparation between production volume and reported-water volume just about 52,15%.
The lower of service quality level can cause drowning of consumption level. The worst thing is income of PDAM Kabupaten Semarang becomes less. It also means there is huge opportunity for customer to use another water (except PDAM).
So far, PDAM couldn`t shows better performance in service level. There`s still many complaints that should be handled. Due to unmaximize service, customer
satisfaction has to be evaluated. It aims to identify the most affecting factor in satisfaction. So, image and financial of PDAM is not drop down.
Structural equation modelling method is taken to advance quality level, and also to measure which variables that gives bigest effect to service quality. The models show relationship between customer satisfaction variables in PDAM Kabupaten Semarang Cabang Ungaran
High requirements of water needs in public and high operational cost make PDAM Kabupaten Semarang couldn`t maximize its water service quality. Besides, operational cost came from foreign loans that have to be paid off. Complaints about service from customers indicates that PDAM still have to improve service quality level. Customer retention could
J@TI Undip, Vol VIII, No 2, Mei 2013 74 identification and evaluate its effect to
customer satisfaction.
The objectives of this research are :
1. To evaluate customer satisfaction in PDAM Kabupaten Semarang
2. To analyze total satisfaction that has positif correlation to behavioural intention and sigfinicant relationship 3. To evaluate causality level among
SERVQUAL variables, satisfaction variables, and behavioural intention variables.
RESEARCH METHOD Service Quality
SERVQUAL was originally measured on 10 aspects of service quality: reliability, responsiveness, competence, access, courtesy, communication, credibility, security, understanding or knowing the customer and tangibles. It measures the gap between customer expectations and experience.
By the early nineties the authors had refined the model to the useful acronym RATER:
Reliability Assurance Tangibles Empathy, and Responsiveness
SERVQUAL has its detractors and is considered overly complex, subjective and statistically unreliable. The simplified RATER model however is a simple and useful model for qualitatively exploring and assessing customers' service experiences and has been used widely by service delivery organizations. It is an efficient model in helping an organization shape up their efforts in bridging the gap between perceived and expected services.
Nyeck, Morales, Ladhari, and Pons (2002) stated the SERVQUAL measuring tool
“remains the most complete attempt to conceptualize and measure service quality”
(p. 101). The main benefit to the SERVQUAL measuring tool is the ability of researchers to examine numerous service industries such as healthcare, banking, financial services, and education (Nyeck, Morales, Ladhari, & Pons, 2002). The fact that SERVQUAL has critics does not render the measuring tool moot. Rather, the
criticism received concerning SERVQUAL measuring tool may have more to do with how researchers use the tool. Nyeck, Morales, Ladhari, and Pons (2002) reviewed 40 articles that made use of the
SERVQUAL measuring tool and
discovered “that few researchers concern
themselves with the validation of the
measuring tool” (p. 106).
Customer Satisfaction
Customer satisfaction is an ambiguous and abstract concept and the actual manifestation of the state of satisfaction will vary from person to person and product/service to product/service. The state of satisfaction depends on a number of both psychological and physical variables which correlate with satisfaction behaviors such as return and recommend rate. The level of satisfaction can also vary depending on other options the customer may have and other products against which the customer can compare the organization's products.
J@TI Undip, Vol VIII, No 2, Mei 2013 75 performance and their perceived experience
of performance. This provides the measurer with a satisfaction "gap" which is objective and quantitative in nature. Work done by Cronin and Taylor propose the "confirmation/disconfirmation" theory of combining the "gap" described by Parasuraman, Zeithaml and Berry as two different measures (perception and expectation of performance) into a single measurement of performance according to expectation. According to Garbrand, customer satisfaction equals perception of performance divided by expectation of performance.
The usual measures of customer satisfaction involve a survey with a set of statements using a Likert Technique or scale. The customer is asked to evaluate each statement and in term of their perception and expectation of performance of the organizationbeing measured.
Behavioural Intention
Behavioural intention has been defined as the customers’ subjective probability of performing a certain behavioural act (Fishbein and Ajzen, 1975). In this regard, three behaviours in particular have been associated with profitability and the market share of a firm; these customer behaviours are:
(1) word-of-mouth;
(2) repurchase intention; and (3) feedback to the service provider.
-Feedback
Customer feedback – refers to the transmission of negative information (complaints) or positive information (compliments) to providers about the services used. Such information can be useful for providers in identifying areas in which adjustments of performance are required. Very few researchers have examined the relationship between feedback and satisfaction. In most studies, the samples of feedback-providing customers have been small. Nevertheless, So¨derlund (1998) did conclude that dissatisfied customers are significantly more likely to provide negative feedback than are satisfied customers to provide
positive feedback. It is presumed that customers who provide negative feedback are seeking to achieve some form of compensation for unmet quality of services; in contrast, the provision of positive feedback is often perceived by customers as not being rewarded. (Theingi dan Saha, 2009)
-Word-of-Mouth
J@TI Undip, Vol VIII, No 2, Mei 2013 76 level and the valence of word-of-mouth are
dependent on a range of other factors, including culture, incentives, emotion, and perception of the fairness of the encounter.
-Intention of Usage
There is a relationship between intensity of usage and customer satisfaction. High cuatomer satisfaction gives positif effect to intensity of usage, and so opposites. Satisfied customer has a willing to use or buy the same thing that have made them satisfied. Repurchase has a positif comparation with intensity of usage, which is the more repurchase the more intensity of usage raise up. One of the way to retent customer is improving customer satisfaction level and services continuously. Many factors that make customers move from one to another service providers, such as low price or better quality. (Anton ,1996).
HYPOTHESIS
H1. Perceived service quality (servqual)
positively influences passengers’
satisfaction.
H2. Passenger satisfaction (SERVQUAL) positively influences positive word-of-mouth.
H3. Passenger satisfaction (SERVQUAL) positively influences repurchase intention.
H4. Passenger satisfaction (SERVQUAL) negatively influences level of feedback.
Population and Sampling
Population of this reserach is customer in PDAM Cabang Ungaran Kabupaten Semarang. Using random sampling, samples of this research are :
n = are about 150-200. Base on that statement, researcher took 210 samples (70 low-end user, 70 middle-end user, 70 high-end user)
Variables Identification
1. Eksogen Construct Variable : SERQUAL (Tangible, Reliability, Responsiveness, Assurance, dan
Emphaty)
2. Moderating Endogen Construct Variable:
Total Satisfaction
3. Endogen Construct Variable :
Behavioural Intention (Feedback, Word-of-Mouth, dan Intensity of Usage)
Instrument and Measurement
1. Perceived quality Parasuraman et al (1988) measured with closed-answer questionaire and scaled with LIKERT. 1 stated very disagree and 5 stated very agree. There are 29 questions for 5 dimension of service quality
2. Total quality variable measured from 3 indikator. Total services, total tariff, total products. Each indicator has 2. 1 stated very disagree and 5 stated very agree.
3. Behavioural intention include 3 dimensions (feedback, WOM, and
Structure Equation Modelling using LISREL 8.80 is aimed to evaluate causality relationship between endogen and eksogen variables (SERVQUAL variable, total satisfaction variable, and behavioural intention variable) in detail or overall realtionship. Equation models below :
J@TI Undip, Vol VIII, No 2, Mei 2013 77 =
31
1+
3intention usage =
41
1+
4ANALYSIS AND REVIEW Respondent Characteristics
Collected data shows that 70% customer of PDAM Ungaran use clean water from PDAM only, and the rest customer use PDAM and deep-well. 42,9% customer of PDAM have 3-4 family members, and 38,1% have 5-6 family members. Small families consume less water than bigger families. More than 78% customer have already used PDAM for at least 6 years. It shows a lot of customers have a loyality to PDAM, and only 4,8% that being a new customer. Approximately 26,2% has monthly income that range IDR 1,5 million – 2 million and 40% has more than IDR 2 million. Monthly income that range IDR 1,5 million – more than IDR 2 million is enough to cover daily water needs. Most rate of flows in distribution area is normal (75,7%), only a few that is abnormal. PDAM has already fulfill water flowrate from customer requirements well. Consumtion of 38,1% customer is about 15m3 untill 20 m3, and 33,8% customers spend 20m3 – 45m3. 40% PDAM customers have to pay IDR 50.000 – 100.000 in their invoce. And only 32,9% customers have to pay IDR 100.000 in their invoice.
Total Structural Model
This picture below shows total structural model of SERVQUAL, total satisfaction, and behavioural intention :
Reliability
2
Empathy
5
Assurance
4
OS (Overall Satisfaction)
1
Tangible
1
Responsiveness
3
Intention of use
4
Word of Mouth
3
Feedback
2 11
12
13
14
15
21
31
41 1
2
3
4
Picture 1 Total Structural Model of Total Satisfaction,
SERVQUAL, and
behavioural intention
J@TI Undip, Vol VIII, No 2, Mei 2013 78 Picture 3 Total Structural Model
(T-value)
Indikator Fit Index
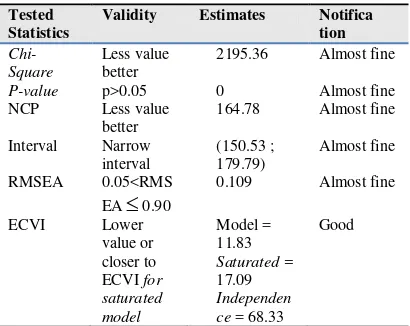
Here are fit indexes which will discussed in this research, such as degree of freedom (DF), Chi Square, Probability, Root Mean Square Error Of Approximation (RMSEA), Goodness Of Fit (GFI), Adjusted Goodness Of Fit (AGFI) dan Comparative Fit Index (CFI). Many requirements that has to be fulfilled, and so the constructed model could be used in this research (indentical to empirical data). Output of SEM in LISREL 8.80 are datas that contain fit indicators, as shown below :
Table 1 Fitted-Index Indices
Tested Statistics
Validity Estimates Notifica tion
Chi-Square
Less value better
2195.36 Almost fine
P-value p>0.05 0 Almost fine
NCP Less value better
164.78 Almost fine
Interval Narrow
Validity Estimates Notificatio n
Based on fit indicators table, constructed model can be implemented to measure satisfaction and its correlation to behavioural intention and service quality dimensions
Measurement model output
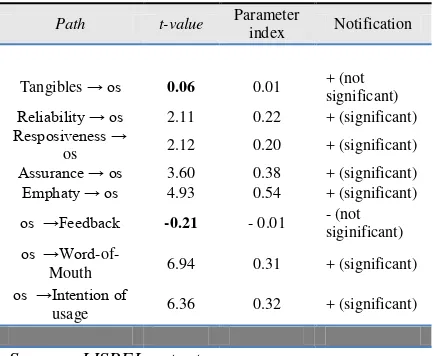
J@TI Undip, Vol VIII, No 2, Mei 2013 79 Tabel 2 Structural Model Evaluation
Path t-value Parameter
index Notification
Tangibles → os 0.06 0.01 + (not significant)
Reliability → os 2.11 0.22 + (significant)
Resposiveness →
os 2.12 0.20 + (significant)
Assurance → os 3.60 0.38 + (significant)
Emphaty → os 4.93 0.54 + (significant)
os →Feedback -0.21 - 0.01 - (not
siginificant) os →Word
-of-Mouth 6.94 0.31 + (significant)
os →Intention of
usage 6.36 0.32 + (significant)
Source : LISREL output
Hypothesis Evaluation - Hypothesis 1 : 1. Tangibles Variable
Data output LISREL 8.80 shows t-value = 0.06, that means t-value is in denial range (0.06 < 1.96). Base on that t-value, H0 cant be accepted. It states that
hypothesis 1.1 is not acceptable. Inconclusion tangible variable is not significant to total satisfaction and has positive correlation
2. Reliability Variable
Data output LISREL 8.80 shows t-value = 2.11, that means t-value is in acceptance range (2.11> 1.96). Base on that t-value, H0 can be accepted. It
states that hypothesis 1.2 is acceptable. Inconclusion reliability variable is significant to total satisfaction and has positive correlation
3. Responsiveness Variable
Data output LISREL 8.80 shows t-value = 2.12, that means t-value is in acceptance range (2.12> 1.96). Base on that t-value, H0 can be accepted. It
states that hypothesis 1.3 is acceptable. Inconclusion responsiveness variable is sinificant to total satisfaction and has positive correlation
4. Assurance Variable
Data output LISREL 8.80 shows t-value = 3.60, that means t-value is in acceptance range (3.60> 1.96). Base on that t-value, H0 can be accepted. It
states that hypothesis 1.4 is acceptable.
Inconclusion assurance variable is significant to total satisfaction and has positive correlation
5. Emphaty Variable
Data output LISREL 8.80 shows t-value = 4.93, that means t-value is in acceptance range (4.93> 1.96). Base on that t-value, H0 can be accepted. It
states that hypothesis 1.5 is acceptable. In conclusion emphaty variable is significant to total satisfaction and has positive correlation
- Hipotesis 2 :
Data output LISREL 8.80 shows t-value = -0.21, that means t-value is in denial range (-0.21< -1.96). Base on that t-value, H0 cant be accepted. It
states that hypothesis 2 is not acceptable. In conclusion total satisfaction is not significant to feedback and has negative correlation - Hipotesis 3 :
Data output LISREL 8.80 shows t-value = 6.94, that means t-t-value is in acceptance range (6.94> 1.96). Base on that t-value, H0 can be accepted. It
states that hypothesis 3 is acceptable. In conclusion total satisfaction is significant to word-of-mouth and has positive correlation
- Hipotesis 4 :
Data output LISREL 8.80 shows t-value = 6.36, that means t-t-value is in acceptance range (6.36> 1.96). Base on that t-value, H0 can be accepted. It
states that hypothesis 4 is acceptable. In conclusion total satisfaction is significant to behavioural intention and has positive correlation
Effect Decomposition
J@TI Undip, Vol VIII, No 2, Mei 2013 80 SERVQUAL dimensions have total
effect to behavioural intention indicators and total satisfaction indicators. In conclusion, tangible variable has no effect to total satisfaction indicators and behavioural intention. Realiability variable has equal effect value to wom1, int1, and services appoximately 0.07. In addition, realibility variable has effct value to wom2, int2, tariff, and water about 0.08. It shows reliability has bigger effect to tariff, water, wom2 (quality recommendation), and int2 (intensity of usage) than to others.
Indirect Effects of ETA on Y shows that total satisfaction variable has equal indirect effect to indicator wom2 and indicator int2 about 0.36. Besides, indirect effect of total satisfaction variable to wom1 0.31 and int1 0.32
Standardized Solution
Benefit of standardized method is to make interpretaion of bivariate correlation between latent variables easier. Correlation has value from 0 to 1. Closer to 1, the higher level of correlation .
Correlation Matrix of ETA and KSI evaluates that there is significant correlation of word-of-mouth to intensity of usage and total satisfaction, also correlation of total satisfaction and emphaty. Total satisfaction has more significant correlation to word-of-mouth than to intensity of usage. In SERVQUAL dimensions, assurance and emphaty has most significant correlation to total satisfaction. But emphaty has higher value of correlation than assurance.
Regression Matrix ETA on KSI (Standardized) shows emphaty has biggest effect to total satisfaction about 0.44. Each dimension has effect to total satisfaction; assurance (0.31), reliability (0.18), and responsiveness (0.16). In contrast, tangible variable has no effect at all. Emphaty and assurance have bigger effect than responsiveness and reliability to word-of-mouth and intensity of usage. Responsiveness has less effect than others to word-of-mouth and behavioural intention, because responsiveness is variable that underlines fast/slow respons to new customer requirements of water installation (to their homes). Customers did
not mind about it (no significance effect to level of satisfaction)
CONCLUSION
Customers really care about reliability, responsiveness, assurance, and emphaty of service. Because of that, those factors are important value in gaining total satisfaction from servcie quality sectors. But oppositely, tangible factor does not give significant effect to total satisfaction. Tangible factor contains water appearance quality, payment note, and cashier counter. In PDAM these 3 services has already had standard, so customers will receive the same services in all condition. Customers not really mind about that. Because so far, customers need good flowrate of water.
Evaluation of total satifaction variable and behavioural intention : Total satisfaction has significant correlation positively to word-of-mouth and itnensity of usage. Positive correlation means the more satisfied customer will make more recommendation to others and more intensity of usage. In other side, total satisfaction has a negative correlation to feedback and not significant. Negative correlation means the less satisfied cutomer will cause higher feedback (complaints). Desire to give feedback affects significancy of relationship, it means satified or unsatisfied customer will not give any complaints or advices to company (PDAM)
In providing services PDAM should pay more attention to customer especially showing emphaty to them, and PDAM has to give assurance of products and services to customer. It can make sure customers that they use the right service provider and best-quality water. Beside that, emphaty to customer and assurance of services rise up satisfaction level the most significant. If customers has satisfied, it will give bigger opportunity to PDAM to obtain higher income through intensity of water they use and new customers from recommendation
Limitations
J@TI Undip, Vol VIII, No 2, Mei 2013 81 that cover daily water needs of ungaran
citizens. And PDAM implemented Good Corporate Governance. Next researcher should review GCG and public services journals to define indicators that should be considered. Getting bigger sample will more represent and generalize the real condition in Ungaran citizens.
REFERENCES
1. Anton, J. 1996. Customer Relationship Management: Making Hard Decisions with Soft Numbers. Prentice-Hall, Upper Saddle River, NJ.
2. Babin, B.J., Lee, Y.-K., Kim, E.-J. and Griffin, M. 2005. Modeling customer satisfaction and word-of-mouth: restaurant patronage in Korea. Journal of Services Marketing, Vol. 19 No. 3, pp. 133-9.
3. Bearden, W.O. and Teel, J.E. 1983.
Selected determinants of consumer satisfaction and complaint reports.
Journal of Marketing Research, Vol. 20, pp. 21-8.
4. Bitner, M.J., Booms, B. and Tetreault, M. 1990. The service encounter: diagnosing favorable and unfavorable incidents. Journal of Marketing, Vol. 54 No. 1, pp. 71-84.
5. Brown, T.J., Barry, T.E., Dacin, P.A. and Gunst, R.F. 2005. Spreading the word: investigating antecedents of
consumers’ positive word-of-mouth
intentions and behaviors in a retailing context. Journal of the Academy of Marketing Science, Vol. 33 No. 2, pp. 123-38.
6. Cronin, J.J. Jr and Taylor, S. 1992.
Measuring service quality: a re-examination and extension. Journal of Marketing, Vol. 56 No. 3, pp. 55-68. 7. Cronin, J.J., Brady, M.K. and Hult,
G.T.M. 1997. Assessing the effects of quality, value, and customer satisfaction on consumer behavioral intentions in service environments, Journal of Retailing, Vol. 76 No. 2, pp. 193-218. 8. Dabholkar, P.A., Thorpe, D.I. and
Rentz, J.O. 1996. A measure of service quality for retail stores: scale development and validation. Journal of
the Academy of Marketing Science, Vol. 24 No. 1, pp. 3-16.
9. Direktori Perpamsi. 2005. Laporan Teknik PDAM Indonesia.
10.Fishbein, M. and Ajzen, I. 1975. Belief, Attitude, Intentions and Behavior: An Introduction to Theory and Research.
Addison-Wesley, Reading, MA.
11.Gefen, D., Karahanna, E. and Straub, D.W. 2003. Trust and TAM in online shopping: an integrated model. MIS Quarterly: Management Information Systems, Vol. 27 No. 1,pp. 51-90. 12.Ghozali, Imam. 2005. Structural
Equation Modelling : Teori, Konsep, dan Aplikasi dengan Program LISREL 8.54. Semarang : Badan Penerbit Universitas Diponegoro.
13.Jones, M. and Suh, J. 2000. Transaction-specific satisfaction and overall satisfaction: an empirical analysis.
Journal of Services Marketing, Vol. 14 No. 2, pp. 147-59.
14.Kotler, P. 1997. Manajemen Pemasaran.. Jakarta : PT. Prenhallindo. 15.Parasuraman, A., Zeithaml, V.A. and
Berry, L.L. 1988. SERVQUAL: a multiple-item scale for measuring consumer perceptions of service quality.
Journal of Retailing, Vol. 64 No. 1,pp. 12-40.
16.Richins, M.L. 1983. Negative word-of-mouth by dissatisfied customers: a pilot study. Journal of Marketing, Vol. 47, pp. 68-78.
17.Rust, R.T. and Zahorik, A.J. 1993.
Customer satisfaction, customer retention, and market share. Journal of Retailing, Vol. 69 No. 2, pp. 193-215. 18.Saha, G. C., Theingi. 2008. Service
quality, satisfaction, and behavioural intentions (A study of low-cost airline carriers in Thailand). Journal of Managing Service Quality Vol. 19 No. 3, pp. 350-372
19.Supranto J. 1997. Pengukuran Tingkat Kepuasan Pelanggan Untuk Menaikkan Pangsa Pasar. Jakarta: PT. Rineka Cipta 20.Swan, J.E. and Oliver, R.L. 1989.
J@TI Undip, Vol VIII, No 2, Mei 2013 82 21.Tjiptono, F dan Anastasia Diana. 2003.
Edisi Ke-lima. Total Quality Management (TQM). Yogyakarta: ANDI.
22.---. 2005. Kualitas Jasa Pengukuran, Keterbatasan dan Implikasi Manajerial. Usahawan No. 03/Thn. XXVIII/Maret.
23.--- dan Gregorius Chandra. 2005. Service, Quality & Satisfaction. Yogyakarta: ANDI
24.Umar, Husein. 2003. Metode Riset Perilaku Konsumen Jasa. Jakarta: Gholia Indonesia.
25.Wirtz, J. and Chew, P. 2002. The effects of incentives, deal proneness, satisfaction, and tie strength on word-of-mouth behavior. International Journal of Service Industry Management, Vol. 13 No. 2, pp. 141-62.
26.Zeithaml, V.A., Berry, L.L. and Parasuraman, A. 1996, The behavioral consequences of service quality. Journal of Marketing, Vol. 60 No. 2, pp. 31-46. 27.http://www.Yayasan_Lembaga_Konsum