Electronic copy available at: https://ssrn.com/abstract=2990096 doi: 10.17265/1548-6583/2017.03.003
Static and Dynamic Indicators in the Analysis of Internal
Sources of Companies’ Investments Financing
∗
Rajko M. Bukvić
Geographical Institute “Jovan Cvijić” of the Serbian Academy of Sciences and Arts, Belgrade, Serbia
Nizhny Novgorod State University of Engineering and Economics, Knyaginino, Russia
Radica Ž. Pavlović
University John Naisbitt, Belgrade, Serbia
Aleksandar M. Gajić
Higher Business School of Professional Studies “Prof. dr Radomir Bojković”, Kruševac, Serbia
The Republic of Serbia is characterized by an unsatisfactory macroeconomic environment. Under the conditions of
an evident shortage of liquid assets, the financial capital has moved from real to the financial sector, which led
companies to over-indebtedness and shutdown of their own capacities. Therefore, capital investments largely
depend on internal financing sources and the ability of companies to internally generate funds for investments. In
this regard, an emphasis is placed on the difference in the assessment of the company’s investment capacity based
on internal financing sources, which are measured using static and dynamic indicators in order to prove the
necessity of applying dynamic coefficients, which are unfortunately not present in our domestic practice. The paper
examines and proves the advantages of the use of the dynamic approach for such analyses using the example of
energy sector, which is one of the most important branches in Serbian economy.
Keywords: dynamic and static coefficients, dynamic analysis, investments, financing, sources, dispersion analysis
Introduction
The economy of Serbia collapsed in the transition process. The industry is devastated, the GDP equals to two thirds of its value at the end of the 1980s, the equipment and technologies are depreciated and generally old and non-adequate, some markets have been lost after the collapse of the former SFR Yugoslavia etc.1 The positioning of Serbian enterprises in both old and new, emerging markets is difficult and slow, while companies do business in unsatisfactory macroeconomic environment (with a high degree of illiquidity, high inflation rate, rising unemployment, decline in the level of capacity utilization, followed by the process of
∗
The first version of this paper (Pavlović, Bukvić, & Gajić, 2016) is presented at the SIM 2015/13th International Symposium in Management: Management During and After the Economic Crisis, October 9-10, 2015, Universitatea Politehnica din Timişoara,
Timişoara, Romania, and published in Procedia–Social and Behavioral Sciences, also posted at https://mpra.ub.uni-muenchen.de/72216/1/MPRA_paper_72216.pdf.
Rajko M. Bukvić, Principal Research Fellow, Head of Department, The Regional Geography Department, Geographical Institute “Jovan Cvijić” of the Serbian Academy of Sciences and Arts; Honorary Professor, Nizhny Novgorod State University of Engineering and Economics. Email: [email protected].
Radica Ž. Pavlović, Assistant Professor, Faculty of Management, Zaječar, University John Naisbitt.
Aleksandar M. Gajić, Assistant Professor, Higher Business School of Professional Studies “Prof. dr Radomir Bojković”.
1
See detailed analysis in Bukvić (2013).
Electronic copy available at: https://ssrn.com/abstract=2990096
globalization, market deregulation and liberalization with all their negative consequences for growth and development of the country). In such circumstances, the shortage of liquid assets of the financial capital has moved from the real to the financial sector, which has led companies to over-indebtedness and the shutdown of their own capacities, implying that the companies’ capital investment capability depends mostly on internal sources. This became a pressing issue very soon after the privatization of the companies, when the process of concentration of ownership began. This process led rapidly to a decreased number of listed (working) companies and lowering the possibility of accumulating external capitals (Begović, Bisić, Đulić, Živković, Jolović, & Mijatović, 2008). Consequently, companies have been forced to carefully evaluate their business and financial results, and find less obvious investment opportunities.
Although the literature emphasizes many advantages of internal financing (Rimer, A. D. Kasatov, & N. N. Kasatov, 2008), this form of financing implies that the assets, particularly financial assets, cannot be put into other alternative uses, which limits the company’s business possibilities. The structure of investment sources normally depends not only on the company’s financial performance but also on many other factors. The current position of Serbian companies is characterized by a shortage of liquid assets. There are also other issues at the macro level, including illiquidity and business losses. Therefore, the know-how and the use of modern analytical approaches are essential to business improvement. One of the areas where one of those approaches based on the cash flow concept could be applied is modern financial analysis. In the following chapter, brief historical remarks will be provided on the development of this approach.
The Historical Remarks
In economic theory, particularly in financial analysis, two approaches to measuring the financial results have so far been differentiated: the economic approach (static, traditional), which is based on the calculation approach to accounting profit, and the financial approach (dynamic, contemporary), which relies on cash flow in order to avoid the limitations of calculation based on the traditional accounting system. The use of traditional ratios began after the American Civil War in 1865, when US bank loan amounts increased. During this period, current and non-current items were separated. This period also saw the development of the traditional ratios as short-term credit analysis devices, including ratios of current assets to current liabilities. The real era of these ratios began in 19192, when DuPont Company introduced its famous ratio analysis, the “DuPont Identity” or “Ratio Triangle” (also known as “DuPont Analysis”, “DuPont Equation”, “DuPont Model”, or “DuPont Method”), and started using this formula in the 1920s. The DuPont Identity is a financial analysis tool that uses basic accounting relationships from balance sheet and income statement to illustrate the factors that drive the return on equity of the company.
The cash flow analysis is much more recent, and it began with the introduction of cash flow statement. Officially, it was introduced by the Financial Accounting Standards Board (FASB) in 1987, when the Board adopted the Statement of Financial Accounting Standard (SFAS) 95, which mandated the Statement of Cash Flows (SCF) as a required part of annual financial statements. The SCF was primarily designed to bridge the information gap between the traditional accrual accounting and understanding of the cash flow activities of a company, which is owed to the accrual accounting failing to provide relevant information to assess the amount, timing, and uncertainty of future cash flows (Zeller & Stanko, 1994). Of course, the concept had arisen much
2
earlier. The term “cash flow” started appearing in the literature with increasing frequency during the decade of the 1950s, but had also been present prior to that period, although very seldom. Other similar terms were sometimes used, such as net cash income, net cash generation, cash income, cash funds generated from operations, etc. Although the term is questionable, the concept has a valid factual background, and can be used effectively as one of the major factors in judging the company’s ability to meet debt retirement requirements, to maintain regular dividends, to finance replacement and expansion costs, etc. (Mason, 1961). The research problem that concerns the analysis of cash flows, as a new concept of management and evaluation of liquidity and financial performance, gains importance in the modern business environment when the possibilities for solvent and efficient operations in generally inflationary and insolvent economic environment are at a very unsatisfactory level. Analytical tools for the analysis of the cash flows were suggested by (foreign) authors in the late 1990s.
At the beginning of the 21st century, professional papers were beginning to come out on the importance of cash flow statement as a supplement to the existing reports and on possible directions of its analysis, which were not fully systematized, uniformed, or empirically validated for different purposes. The aim was to draw attention to the differences in possible ways of interpretation of a successful operation, which arise depending on the application of performance indicators as opposed to the application of the indicators based on cash flow. This viewpoint determined a large number of companies that operated with profit, but went bankrupt due to the inability to settle their obligations over a longer period of time. That is when the role and importance of a cash flow analysis (dynamic analysis) as well as the deficiencies of an analysis based on the information from the balance sheet and income statement (static analysis) started to become obvious.
The proponents of the ratio indicators based on cash flow (Gombola & Ketz, 1983; Giacomino & Mielke, 1993; Mills & Yamamura, 1998) suggest that the indicators based on cash flows are more reliable and objective than the traditional ratio relations. According to Zeller and Stanko (1994), these ratios can provide a more complete picture of a company’s ability to generate sufficient operating cash flow to service its debt and equity obligations and to fund asset acquisitions (in other words, its “ability to pay”). The data from the balance sheet are static since they measure a single point in time, while the income statement contains many arbitrary non-cash allocations. In contrast, a financial analysis based on the cash flow indicators does not have such a drawback (Kamal & Quader, 2010). The survey of most popular cash flow indicators can be seen, e.g., in Mills and Yamamura (1998) and Ibarra (2009).
The Used Methodology
The following research includes two variables, each of them corresponding to one approach. Namely, it is essential that the overall objective be deductively broken down into specific goals or tasks. In the following pages, we will compare these two variables by carrying out a variance analysis. We will use this methodology in setting up a hypothesis, while making certain that the general hypothesis is compliant with the overall aim of the research, and that the specific hypotheses, understood as the general hypothesis’ projections, are in line with the tasks of research.
In accordance with the object and purpose of the research, an empirical research is conducted using the statistical model of variance analysis (dispersion analysis), which enables us to consider variability between modern (dynamic) and traditional (static) indicators in the survey sample. The sample consisted of large companies that operate in electrical energy production, transmission, and distribution; that is to say all the companies working in the branch. The research analyzed all the companies operating in this vital sector for the whole country’s industry. The analyzed companies are state-owned enterprises and hold a monopoly position. In Serbia, energy production is based on harnessing thermal and water power, and is nowadays one of the country’s significant competitive advantages (Bogavac-Cvetković & Langović-Milićević, 2011). It belongs to the industrial sector, which is the carrier of technical progress, the driving force of economic growth and a creator of synergy effects in the overall economy (Reinert, 2006).
An analysis of the variance, which is based on an impartial assessment of the variability arising under the influence of controlled factors, reflects an asymmetry of the information gathered by using static on one hand and dynamic instruments on the other hand. It is proven that the indicators of dynamic analysis based on cash flow are more reliable predictors of the financial position of the company, compared to the static indicators. By using the dynamic indicators, we are able to create a better informative foundation for more adequate planning, analysis, and decision-making in order to improve financial performance. This has been demonstrated at the reliability level of 95%, i.e., at the level of significance α = 0.05 (or any other probability), based on the relations of:
(1) estimated values of the factorial and residual variances:
(1)
2
1 1
2
(
)
r n
ij i
i j
R
X
M
S
rn r
= =
−
=
−
∑ ∑
(2) where:
= Factorial variance; = Residual variance;
Xij = Value of observations j in the sample i;
Mi = The arithmetic mean of the sample i;
M = Common arithmetic mean;
r = Number of samples (here r = 2);
n = Sample size (here n1 = n2 = 10).
2
2 1
(
)
1
r
i i i
A
M
M
n
S
r
=
−
=
−
(2) and the test statistics for Fischer-Snedecor (F):
/ (3) The degrees of freedom are respectively ν1 = r - 1 = 1 and ν2 = n1 + n2 - 2 = 18.
We will examine the hypothesis using the standard two-factor dispersion analysis. The factors are identified as static or dynamic coefficients used in our analysis. In our paper, we will use one static and one dynamic coefficient. Our purpose is not to apply these coefficients for the analysis of investment capability. On the contrary, we will examine possible differences between two approaches, static and dynamic, for which the studies and literature are poor.
Comparative Analysis of the Investment Capability of a Company Based on Static and
Dynamic Indicators
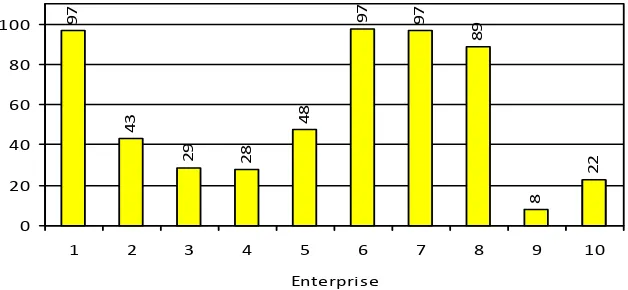
The term self-financing in the broadest sense should be understood as the process of collecting and placing temporarily or permanently released funds, which are acquired through depreciation and by using the part of income intended for accumulation or allocation for specific purposes. It is believed that self-financing is a very convenient way to finance investment projects because the own resources are available to the investor at any time and are also the cheapest way to finance investment projects. This is particularly evident in conditions where external funding sources become very expensive, and also when the demand for external sources makes a negative impact on the company’s image, etc. (Brealey, S. C. Myers, & A. J. Myers, 2007; Bukvić, 2009). The share of self-financing in total investment amount differs greatly, not only by company, and subsequently by country, but also in time. According to Rimer et al. (2008), more than two thirds of investments in big and middle-sized companies are financed internally. For instance, the Fed data, cited in Brealey et al. (2007), show that internal financing sources in American non-financial companies make up for about 90% of the total investment amount. As noted above, Serbian companies tend to shut down after being privatized, and that leads to fewer possibilities of external financing. In Serbia in 2013, the share of internal financing sources in the whole economy was 77.2%, while their share in electricity, gas, steam, and air conditioning supply made up for 88.9% of the total investment amount according to Statistical Yearbook of Republic of Serbia 2015 (Statistical Office of the Republic of Serbia, 2015). In our sample, which encompasses large companies, the share of internal sources in investment financing is also high in some cases (see Figure 1), and on average it exceeds 43%.
Figure 1. Share of internal sources in sample companies’ investments financing.
97
43
29 28
48
97 97
89
8
22
0 20 40 60 80 100
1 2 3 4 5 6 7 8 9 10
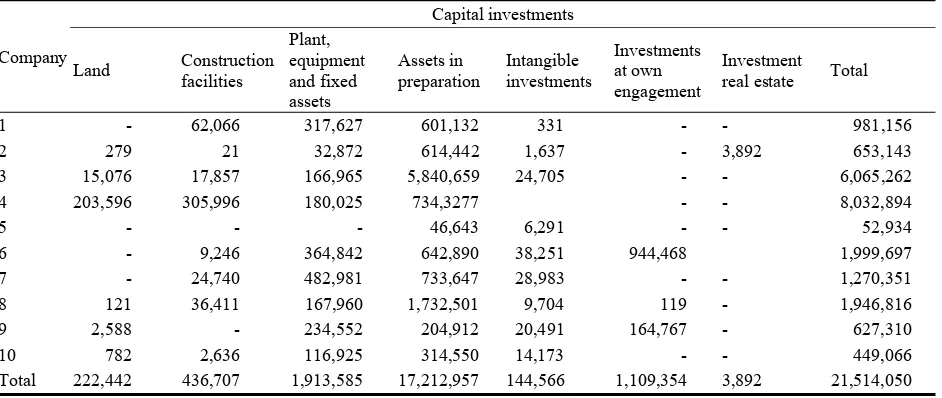
Table 1
Capital Investments (000 Dinars)
Company
Capital investments
Land Construction facilities
Plant, equipment and fixed assets
Assets in preparation
Intangible investments
Investments at own engagement
Investment real estate Total
1 - 62,066 317,627 601,132 331 - - 981,156
2 279 21 32,872 614,442 1,637 - 3,892 653,143
3 15,076 17,857 166,965 5,840,659 24,705 - - 6,065,262
4 203,596 305,996 180,025 734,3277 - - 8,032,894
5 - - - 46,643 6,291 - - 52,934
6 - 9,246 364,842 642,890 38,251 944,468 1,999,697
7 - 24,740 482,981 733,647 28,983 - - 1,270,351
8 121 36,411 167,960 1,732,501 9,704 119 - 1,946,816
9 2,588 - 234,552 204,912 20,491 164,767 - 627,310
10 782 2,636 116,925 314,550 14,173 - - 449,066
Total 222,442 436,707 1,913,585 17,212,957 144,566 1,109,354 3,892 21,514,050
Note. Source: The financial statements of companies and PC EPS.
Capital investments of the companies that make up our sample are presented in Table 1.3 The total investment in land, buildings, plant and equipment, intangible assets, and investment property amounted to 21,514,050 thousand dinars with real investments making up for 99.34%, while financial investments amounted to 0.66%. Since the mentioned companies operate in a branch that requires massive investments in tangible assets, it is necessary to examine and assess the level of the company’s investment capabilities and their implications for business performance. In order to make adequate conclusions, the mentioned assessment will be made in terms of static and dynamic indicators of the investment capacity of the enterprises.
Traditionally, we obtain the static ratio as the quotient of the last two columns in Table 1, i.e.:
(4) where:
TIS = Total internal sources;
TI = Total investments.
A financially strong company should be able to finance its own development. The coefficient of capital investment (4) measures the internal capital available for internal investment and for payment of the existing debts (ratio of the two last columns in Table 2). When this coefficient exceeds 1, we can say that the company has sufficient funds available to make an investment from its capital.
In contrast, the dynamic ratio is developed on the basis of a different concept. Namely, it is believed that the greater the cash flow, the greater is the investment. Theoretically, a company might invest more when its cash flow is high for three reasons: (1) Internal funds may be less costly than external funds; (2) Managers are able to overspend on internally available funds; and (3) Cash flow may simply correlate with investment
3
The companies are: (1) Đerdap; (2) Drimsko-Limske HE; (3) TENT; (4) TE and mines Kostolac; (5) Panonske TE; (6) Elektrovojvodina; (7) Elektrodistribucija BG; (8) Elektrosrbija; (9) Jugoistok; and (10) Centar.
TIS
CRCI
TI
opportunities. Some studies really show that the current investment is positively correlated not only with the current and the expected cash flows, but also with the past cash flows and investments (DeMarzo & Fishman, 2007). However, we must emphasize that this relationship is more complex, and is an object of debate (J. Lewellen & K. Lewellen, 2016).
Table 2
Internal Sources of Investment Financing and Total Investments in the Sample
Company Net result Amortization Long-term provisions Total internal sources Investments
1 -332,413 3,673,454 368,619 3,709,660 981,156
2 -656,003 1,935,767 106,718 1,386,482 653,143
3 -8,695,287 14,936,872 828,345 7,069,930 6,065,252
4 -2,746,911 4,336,07 678,332 2,267,491 8,032,894
5 148,453 210,584 88,119 447,156 52,934
6 -689,640 3,457,747 451,297 3,219,404 1,999,697
7 -1,272,786 3,381,611 252,402 2,361,227 1,270,351
8 -2,449,969 3,909,913 643,781 2,103,725 1,946,816
9 -2,324,223 2,103,477 454,877 234,131 627,310
10 -1,082,245 1,276,504 150,907 345,166 449,066
Total -19,480,348 35,319,536 4,023,397 23,144,372 22,078,629
Note. Source: The authors’ calculation based on the financial statements of the companies and PC EPS.
Based on these considerations, we can define the capital expenditure ratio as a quotient of the company’s operations cash flow and its capital expenditures. This ratio also measures the capital available for internal reinvestment and for the payment of the existing debt. When the capital expenditure ratio exceeds 1, the company has enough funds to invest its available capital, and can also rely on some spare funds to meet debt requirements. A higher value of this ratio indicates that a company has surplus sources, which can be used to service and repay the debt (Mills & Yamamura, 1998). Prudent investors use historical prices in forming their demands as well as to illustrate the sensitivity of the value of the technical analysis to changes in the values of exogenous parameters (Brown & Jennings, 1989).
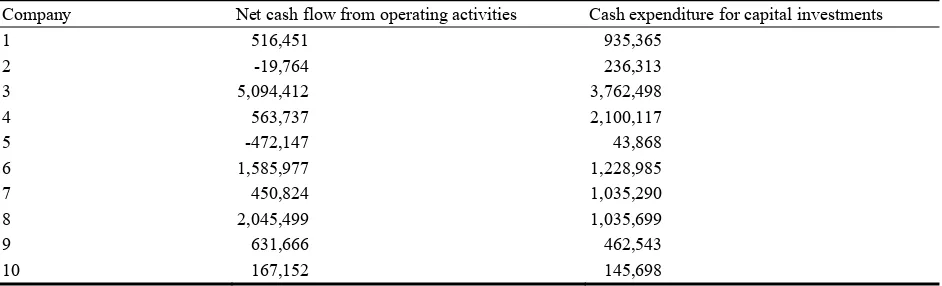
Table 3
Cash Flows from Operating Activities and Expenditures for Capital Investments in the Sample
Company Net cash flow from operating activities Cash expenditure for capital investments
1 516,451 935,365
2 -19,764 236,313
3 5,094,412 3,762,498
4 563,737 2,100,117
5 -472,147 43,868
6 1,585,977 1,228,985
7 450,824 1,035,290
8 2,045,499 1,035,699
9 631,666 462,543
10 167,152 145,698
Note. Source: Financial statements of the companies.
(5) where:
RCE = Capital expenditure ratio;
NCFO = Net cash flow from operating activities;
CECI = Cash expenditure for capital investments.
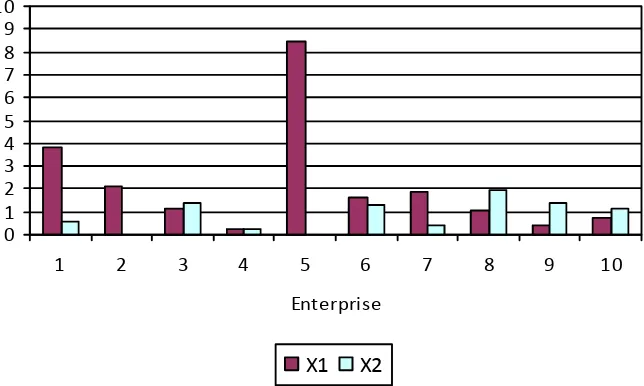
We show the calculated values for coefficients (4) and (5) in Table 4 and Figure 2. As we can see, they differ greatly, not only among different companies, but also from each other within the same company.
We then calculate simple coefficients of investment capabilities, from Table 2 (last two columns) and Table 3 (see Table 4 and Figure 2). We obtain the coverage ratio of capital investment from company’s own resources (CRCI) by dividing the internal sources of financing with capital investment value. Both CRCI and RCE coefficients are shown in Table 4. As seen in Table 3, in case of a number of companies, the net cash flows from operating activities are insufficient to cover expenditures arising from capital investments. Therefore, the dynamic coefficients in half of the cases are lower than 1. Evidently, this is a bad result for this branch as a whole and a bad result in general.
The data presented in the tables highlight a significant difference in terms of the companies’ investment capability based on internal sources of capital investment financing. The static indicators point to a high level of internal financing sources while the dynamic indicators suggest that the internal capability to cover capital expenditures is not satisfactory. In that regard, it is necessary to examine whether this difference varies significantly statistically depending on the application of different coefficients to calculate the capability for internal investment financing. In other words, we examine the following two hypotheses:
H0: M1 = M2, the capability of internal investment financing measured on the basis of both criteria is equal. H1: M1 ≠ M2, the capability of internal investment financing measured on the basis of both criteria is different.
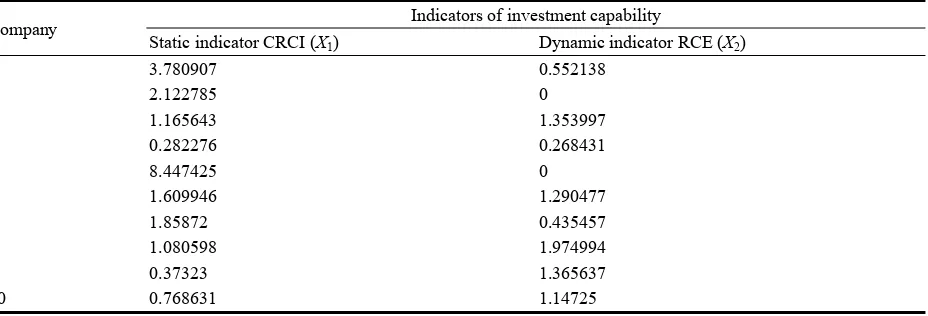
For these purposes, we will use the dispersion analysis (analysis of variance).4 Table 4
Coefficients of Investment Capability of Companies Based on Internal Sources of Funding
Company Indicators of investment capability
Static indicator CRCI (X1) Dynamic indicator RCE (X2)
1 3.780907 0.552138
2 2.122785 0
3 1.165643 1.353997
4 0.282276 0.268431
5 8.447425 0
6 1.609946 1.290477
7 1.85872 0.435457
8 1.080598 1.974994
9 0.37323 1.365637
10 0.768631 1.14725
4
For the procedure, see some standard book of statistical analysis, for example, Kalinina and Pankin (2002), or more extensive, Anderson, D. J. Sweeney, and T. A. Sweeney (2011).
NCFO
RCE
CECI
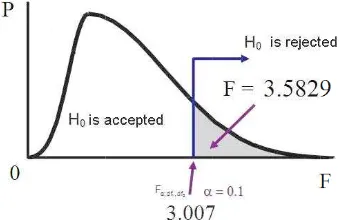
As the critical value F1,18; 0.1 = 3.007 is lower than the statistic values of the test F = 3.5829, respectively
F > Fν1,ν2;α, it follows that we do not accept the null hypothesis, which states that the capability of investment
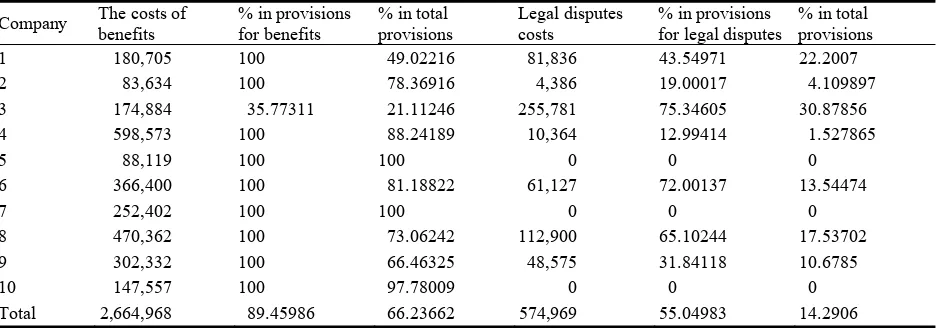
financing using internal sources measured on the basis of both criteria is equal with 10% error risk. This indicates that the information obtained by using dynamic indicators is more reliable when assessing the investment capacity of enterprises. The reason for this is the fact that static indicators take into account the calculating categories of the net results, depreciation, and long-term provisions. These categories are subject to the influence of accounting policies. Provided that they illustrate a real internal ability to finance investments, there is also the problem of their effective use, i.e., the question remains of whether internally generated funds are directed towards investment activities or the available funds are allocated to other purposes. An example of irrational spending of long-term provisions is shown in Table 5.
Figure 2. The indicators of internal investment capabilities in sample enterprises.
Of course, the 10% error risk is high, and we need to consider lower values, as well. If we take the 5% error risk, the critical value will be F = 4.41, and now we can accept the hypothesis. This result means that we need more samples to examine this relationship.
We approach the calculation of the elements necessary for the analysis by using the one-way test with the area of rejection on the right side of the theoretical Snedecor F arrangement. The calculated values of the variance are:
S2A = 11.4394;
S2R = 3.1928.
By putting the first variance (S2A) and the second variance (S2R) into ratio, according to (3), we obtain the value of the test statistics: F = 3.5829. We use the critical value approach. We adopt the significance level
α = 0.10. The value of test statistics F is greater than the critical value (3.007), therefore, we should not accept the null hypothesis (see Figure 3).
0 1 2 3 4 5 6 7 8 9 10
1 2 3 4 5 6 7 8 9 10 Enterprise
limits (Guidry, Leone, & Rock, 1999). In terms of accounting, employees’ education, salary, bonuses, and other forms of financial compensation represent a company’s costs, which are shown in the income statement and are reflected in a reduction in liquid assets on the basis of payments, which is recorded in the Statement of Cash Flows (M. Pavlović & R. Pavlović, 2011). Therefore, the restructuring of a company organization needs to focus on reducing the number of management levels, and consequently the number of general manager positions. This implies that large enterprises must change their personnel policies, remuneration policies, and advancement policies (Drucker, 1995), as so far, the companies’ capabilities have not increased, but instead, the state has been expected to find solutions (Stamenković, 2007).
Table 6
Provision Costs
Company The costs of benefits
% in provisions for benefits
% in total provisions
Legal disputes costs
% in provisions for legal disputes
% in total provisions
1 180,705 100 49.02216 81,836 43.54971 22.2007
2 83,634 100 78.36916 4,386 19.00017 4.109897
3 174,884 35.77311 21.11246 255,781 75.34605 30.87856
4 598,573 100 88.24189 10,364 12.99414 1.527865
5 88,119 100 100 0 0 0
6 366,400 100 81.18822 61,127 72.00137 13.54474
7 252,402 100 100 0 0 0
8 470,362 100 73.06242 112,900 65.10244 17.53702
9 302,332 100 66.46325 48,575 31.84118 10.6785
10 147,557 100 97.78009 0 0 0
Total 2,664,968 89.45986 66.23662 574,969 55.04983 14.2906
Note. Source: The authors’ calculation based on the financial statements of the companies.
Conclusion
Although in Serbian companies it is mandatory to make annual cash flow reports, in reality this is done as a mere fulfillment of law requirements. A cash flow report analysis is often lacking, and the wide range of possibilities for analysis it could provide remain unused, as well as a potential application of the indicators based on them. According to a brief survey conducted by one of the authors while compiling data for his dissertation (Pavlović, 2012), there is only a handful of educated experts working in financial field who are familiar with these indicators (even they are familiar mostly with the liquidity indicators only). Additionally, a rather significant number of the surveyed experts do not even consider that the application of these indicators would benefit them in any way.
The above description refers to the general situation, more precisely related to the use of the modern financial analysis, particularly the cash flow analysis. One of its important aspects is the analysis of companies’ investment capacities, which is the subject of our paper.
The urgent need for a thorough examination of the quality and importance of companies’ internal sources of financing is an outcome of the investigation of the current business conditions in the Republic of Serbia. These conditions are characterized by environmental turbulence, dynamics of change, discontinuity of economic and business activities, unfavorable macroeconomic environment and illiquidity of the economy with far-reaching consequences for the business and market valuation of business entities, as well as a particularly high risk and uncertainty paired with unfavorable external financing conditions. The investment capability of companies when measured by using static (coverage ratio of companies’ own sources capital investment CRCI) and dynamic indicators (ratio of capital expenditure based on cash flows RCE) differs. With a great deal of certainty, we can say that this is not a result of sample variability. This difference is systematic, and demonstrates the possibilities of the two approaches in the analysis.
The analysis of two groups of indicators, based on the dispersion analysis, showed that we should not accept the null hypothesis, which states that the capability of investment financing using internal sources measured on the basis of both criteria is equal (with a 10% error risk). On the example of the analyzed industry, we can conclude that the approach based on the cash flow coefficients is better, and that in future analyses this approach is to be preferred. Our study, by any means, does not offer a definitive answer to the question “Can the use of one set or group of ratios exclude the use of another?”, as Kamal and Quader (2011) study did. They gave a positive answer, however we consider this study as one of the contributions to solving the problem.
References
Anderson, D. R., Sweeney, D. J., & Sweeney, T. A. (2011). Statistics for business and economics (11th ed.). South-Western Cengage Learning, Mason.
Begović, B., Bisić, M., Đulić, K., Živković, B., Jolović, A., & Mijatović, B. (2008). Korporativno upravljanje: pet godina kasnije. Beograd: Centar za liberalno-demokratske studije.
Bogavac-Cvetković, N., & Langović-Milićević, A. (2011). Perspektive transformacije elektroenergetskog sektora Srbije.
Megatrend Review, 8(2), 463-478.
Brealey, R. A., Myers, S. C., & Myers, A. J. (2007). Osnove korporativnih finansija. Zagreb: MATE. Brown, D., & Jennings, R. H. (1989). On technical analysis. Review of Financial Studies, 2(4), 527-551. Bukvić, R. (2009). Principi i planiranje investicija. Beograd: Alfa Tim Print.
Bukvić, R. (2013). Transition in Serbia: Foundations, results and perspectives. Paper presented at the 4thInternational Conference on European Studies (ICES), Social, Economic and Political Transition of the Balkans (pp. 556-572), November 8-9, 2013, Epoka University, Tirana.
Bukvić, R., & Pavlović, R. (2014). Dinamicheskiy podhod k analizu platezhesposobnosti predpriyatiya. Problemy teorii i praktiki upravleniya, 3, 86-93. (in Russian)
Dašić, P. (2012). Application of polynomial regression models for approximation of time series. Journal of Economic and Management Based on New Technologies, 1(2), 81-160.
DeMarzo, P. M., & Fishman, M. J. (2007). Agency and optimal investment dynamics. Review of Financial Studies, 20(1), 151-188.
Drucker, P. (1995). Menadžment za budućnost. Beograd: Privredni Pregled.
Giacomino, D. E., & Mielke, D. E. (1993). Cash flows: Another approach to ratio analysis. Journal of Accountancy, 175(3), 55-58.
Guidry, F., Leone, A. J., & Rock, S. (1999). Earnings-based bonus plans and earnings management by business-unit managers.
Journal of Accounting and Economics, 26(1-3), 113-142.
Ibarra, V. C. (2009). Cash flow ratios: Tools for financial analysis. Journal of International Business Research, 8(SI1), 91-107. Kalinina, V. N., & Pankin, V. F. (2002).Matematičeskaya statistika. Moskva: Drofa. (in Russian)
Kamal, M. M., & Quader, M. S. (2010). Cash flow ratio versus traditional ratio for financial measure of management: A comparative analysis of three British retail companies. The Cost and Management, 38(6), 39-41.
Kamal, M. M., & Quader, M. S. (2011). Cash flow ratio versus traditional ratio for financial measure of management: A comparative analysis of three British retail companies. The Cost and Management, 39(1), 29-34.
Lewellen, J., & Lewellen, K. (2016). Investment and cash flow: New evidence. Journal of Financial and Quantitative Analysis, 51(4), 1135-1164.
Mason, P. (1961). “Cash flow” analysis and the funds statement. American Institute of Certified Public Accountants, New York. Mills, J. R., & Yamamura, J. H. (1998). The power of cash flow ratios. Journal of Accountancy, 186(4), 53-61.
Pavlović, M., & Pavlović, R. (2011). Financial investment in managers’ education – Expenditure or investment. Paper presented at the Second International Scientific ConferenceUniversity Education in Transition – Transition in University Education – Modern and Universal (pp. 87-91), Belgrade.
Pavlović, R. Ž. (2012). Dinamički aspekt finansijske analize na bazi tokova gotovine sa posebnim osvrtom na značaj njene primene u Republici Srbiji (doktorska disertacija, Univerzitet Privredna akademija Novi Sad). Beograd: Fakultet za menadžment malih i srednjih preduzeća.
Pavlović, R. Ž., Bukvić, R. M., & Gajić, A. M. (2016). Internal sources of financing companies on the basis of static and dynamic indicators: Comparative analysis. Procedia – Social and Behavioral Sciences, 221, 270-277. (Electronic version available at: https://mpra.ub.uni-muenchen.de/72216/1/MPRA_paper_72216.pdf)
Phillips, M. (2015). The DuPont invention that forever changed how things work in the corporate world. Quartz (publication). Retrieved from https://qz.com/569738/the-dupont-invention-that-forever-changed-how-things-work-in-the-corporate-world/ Reinert, E. S. (2006). Globalna ekonomija. Kako su bogati postali bogati i zašto siromašni postaju siromašniji. Beograd: Čigoja
štampa.
Rimer, M. I., Kasatov, A. D., & Kasatov, N. N. (2008). Ekonomicheskaya otsenka investitsiy (2nd ed.). Sankt-Peterburg: Piter. (in Russian)
Stamenković, S. (2007). Strategije kontrakcije i zaokreta put u poslovni uspeh preduze‒ ća i privrede u tranziciji. Međunarodni naučni skup: Poboljšanje efektivnosti i efikasnosti preduzeća i privrede (pp. 217-225), Zbornik radova. Beograd: Megatrend univerzitet.
Statistical Office of the Republic of Serbia. (2015). Statistical yearbook of Republic of Serbia. Belgrade. Stoner, D., Friman, E., & Gilbert, D. (1997). Menadžment. Beograd: Želnid.
The financial statements of companies and PC EPS for the period January – December 2008 (Finansijski izveštaji privrednih društava i JP EPS za period januar – decembar 2008. god.). (2009). Sektor za računovodstvo, JP EPS, Beograd.