Volume 6, Number 5, May 2010 (Serial Number 60)
Journal of
Modern Accounting and Auditing
David Publishing Company located at 1840 Industrial Drive, Suite 160, Libertyville, Illinois 60048, USA.
Aims and Scope:
Journal of Modern Accounting and Auditing, a monthly professional academic journal, covers all sorts of researches on accounting research, financial theory, capital market, audit theory and practice from experts and scholars all over the world.
Contributing Editors:
YU Zeng-biao, male, Ph. D. of accounting, Xiamen University – UIUC, professor and Ph.D. supervisor of Tsinghua University, China.
DU Xing-qiang, male, Ph. D. of economics, professor and Ph. D. supervisor of Accounting Department, Xiamen University, China.
WANG Di-hua, male, professor of Dongbei University of Finance and Economics, China.
Jour na l of M ode r n
Ac c ount ing a nd Audit ing
Volume 6, Number 5, May 2010 (Serial Number 60)
Contents
Accounting Research and Practice
The IAS/IFRS application on the intangible assets of non-listed companies 1
Mascia Ferrari, Stefano Montanari
The impact of European firms’ economic conditions and financial performance on accounting
quality 22
Cláudia P. Lopes, António M. Cerqueira, Elísio Brandão
The market reaction on the human resources information disclosure in Chinese listed
companies 37
ZHOU Xian-hua, HAN Wei, WANG Yu-zhou
Discussion on Corporatre Governance
Tunneling, overlapping owner and investor protection: Evidence from merger and acquisition
in Asia 46
Sumiyana, Mas’ud Machfoedz, Ratna Candra Sari
An analysis on corporate governance 61
The IAS/IFRS application on the intangible assets of non-listed companies
Mascia Ferrari1, Stefano Montanari2
(1. Department of Communication and Economics, University of Modena and Reggio Emilia,Reggio Emilia 42121, Italy;
2. Department of Business Economics, University of Modena and Reggio Emilia, Modena 41100, Italy)
Abstract: With the introduction of IFRS (International Financial Reporting Standards) most of the intangibles are expensed on the income statement and hence they “disappear” from the balance sheet, while investments in tangible assets are capitalized. Based on a sample of 128 firms, made up of 99 SMEs (Small and Medium Enterprises) and 29 large firms, and through a simulation of IAS (International Accounting Standards) transition, the authors’ study finds that IAS 38 reduces the amount of intangible assets recognized on the balance sheet of SMEs, while large firms do not appear to experience such large reductions in their intangible assets. The differential effect of IAS 38 on SMEs and large firms can be explained by the different growth strategies of these firm types. SMEs largely depend on internal paths of growth and intangibles assets that typically arise from internal growth strategies are eliminated from the balance sheet under IAS 38. Larger firms are less exposed to such reductions in their intangibles assets, because they mostly follow external paths of growth and the treatment of those intangible assets that typically arise from external growth strategies requires the impairment test.
Key words: intangibles; international accounting principles (IAS/IFRS); SMEs; non-listed companies; M&A; ceramic tile industry
1. Introduction
Many companies are driven by the creation and use of intangible assets. They often “interact with tangible and financial assets to create corporate value and economic growth” (Lev, 2001).
However, most of them are expensed on the income statement and hence they “disappear” from the balance sheet, while investments in tangible assets are capitalized. “This asymmetric treatment of capitalizing (considering as assets) physical and financial investments while expensing intangibles leads to biased and deficient reporting of firms’ performance and value” (Lev, 2001).
The introduction of IAS/IFRS has a different impact on accounting and measurement of the intangible assets in the balance sheet: Some categories are expensed on the income statement, others are capitalized and some of them evaluated according to the impairment test.
According to the IAS 38, intangible assets are classified into specific and generic. The first ones are divided into finite and indefinite useful life. Only the specific assets can be valuated analytically, while the value of the generic ones is obtained as a difference between the prices paid for the acquired entity and the sum of the fair values of its specific assets (tangible and intangible). The intangibles with indefinite useful life (e.g., goodwill) are valuated through the impairment test, which updates the accounting value of the assets to the fair value, if this one
Mascia Ferrari, assistant professor, Department of Communication and Economics, University of Modena and Reggio Emilia; research fields: intangibles, IAS/IFRS, earnings management.
is lower than the carrying value. The impairment test does make the valuation process more subjective than the historical cost criteria with the consequent possibility of manipulating values.
When considering the implications of this different treatment of intangible categories in terms of growth strategies, most of the internally originated intangibles cannot be capitalized, while externally generated intangible assets are recognized in the balance sheet. This implies that alternative strategies of growth are reflected on the financial reporting and disclosure differently for the stakeholders of those companies that follow internal paths of growth.
Previous international literature related to the authors’ study has focused on both the value relevance of intangible assets and the accounting quality of IAS/IFRS. Italian literature has mainly investigated the effects coming from the transition to international accounting principles in an ex-post perspective. What is missing, instead, are studies that measure the effects in an ex-ante perspective, especially considering SMEs and a broader view considering strategic implications.
Based on a sample of 128 firms, made up of 99 SMEs and 29 large firms, and through a simulation of IAS transition, the authors’ study finds that IAS 38 reduces the amount of intangible assets recognized on the balance sheet of SMEs, while large firms do not appear to experience such large reductions in their intangible assets. The differential effect of IAS 38 on SMEs and large firms can be explained by the different growth strategies of these firm types. SMEs largely depend on internal paths of growth and intangibles assets that typically arise from internal growth strategies are eliminated from the balance sheet under IAS 38. Larger firms are less exposed to such reductions in their intangibles assets, because they mostly follow external paths of growth and the treatment of those intangible assets that typically arise from external growth strategies requires the impairment test instead of the amortization.
In fact, the cluster analysis highlights that the reducing effects coming from expensing the internally produced intangibles are not offset by the increasing effects due to the replacement of the amortization process with the impairment test.
The structure of the paper is as follows: Section 1 is introduction; Section 2 discusses the existing literature on intangibles and international accounting standards; Section 3 develops hypotheses and describes the research design; Section 4 discusses the data; Section 5 highlights the main differences between Italian GAAP and IFRS on intangibles; Section 6 presents a snapshot of the intangibles according to the Italian standards; Section 7 is about the assumptions and methodology. Section 8 presents the results of the IAS 38 application. Section 9 concludes.
2. Literature review
Prior literature related to this research is on both intangible and international accounting standards1.
Previous studies show that market participants consider the R&D investments of US firms to be value relevant, although this is only a hypothesis as in the US their capitalization is not allowed (Lev & Sougiannis, 1996; Chan, et al., 2001; Lev, et al., 2002; Chambers, et al., 2003; Monahan, 2005; Wrigley, 2008). Wyatt’s review (2008) looks at a wide range of value-relevance literature, highlighting two regulator issues: There are deficiencies in reporting of separate line items of expenditures on intangible in the income statement; and the possibility, with regulatory guidance, of reporting intangibles in order to facilitate more value-relevant information.
Oswald & Zarowin (2007) examined “the consequences of accounting choice in terms of its affects on stock price informativeness”, considering a sample of UK firms which includes both R&D capitalizers and expensers
1
and basing the disclosure metric on the R&D accounting method. They find that capitalization is associated with greater stock price informativeness, giving the first empirical evidence consistent with the proposition that capitalization of R&D provides more information (about future earnings) to the market, as capitalization’s proponents have suggested.
Basu & Waymire (2008) point out the role of intangibles for economic activity and their links to the tangibles. Skinner (2008) provides a defence of the current treatment of intangibles in the financial reporting. While Lev’s rejoinder (2008) to Skinner reasserts the importance of the capitalization of certain investments in intangibles and a standardised disclosure.
After the Commission Regulation (EC) No. 1602/2002, which represented the first step towards accounting harmonization, literature about international accounting principles started to flourish and many studies were focused on the accounting quality of IFRS. Busacca & Maccarrone (2007), considering intangibles with indefinite useful life, investigate how IAS/IFRS are capable of improving the quality of accounting information measured through four key parameters: correctness, transparency, prudence, and timeliness. The results point out that accounting representation in compliance with US GAAP are superior in correctness and transparency, while no relevant changes are observed with reference to prudence and timeliness. Such evidence represents an increase in the trade-off among the four parameters, and thus a superior quality of accounting information. According to the authors, similarities between IFRSs and US GAAP concerning accounting for intangibles make it possible to extend such results to IFRSs as well. Barth, Landsman & Lang (2008) point out that firms applying IAS generally see an improvement in accounting quality. However, they are not sure that their findings are attributable to the change in the financial reporting system rather than to changes in firms’ incentives and economic environment. In fact, Soderstrom & Sun (2007), in their review on IFRS adoption and accounting quality confirm that “although the purpose of EC directives is to unify the conceptual framework of financial reporting in the EU, research results regarding the success in achieving this goal are mixed”.
In the European context, Hung & Subramanyam (2007), using a sample of German firms, find that total assets and book value of equity, as well as variability of book value and income, are significantly higher under IAS than under German GAAP. Fearnley & Hines (2007), through a qualitative analysis of data from a series of interviews with financially literate individuals before IFRS and from responses to ASB’s consultations on the future of financial reporting for non-listed entities, underline that IFRS is overly complex and is complicating the search for an appropriate form of financial reporting for entities not covered by the EU Regulation. The needs of small and medium enterprises appear to have been ignored in the debates dominated by the requirements of global players.
In the debate related to accounting quality the authors can also consider the literature about fair value referred to the specific context of non listed companies. In the theoretical perspective where pros and cons have been highlighted and a deep analysis of the fair value consequences was conducted (Penman, 2006; Hits, 2007; Ronen, 2008; Whittington, 2008) the same needs of the SMEs seem to be ignored, considering that fair value can be hardly managed by these firms with a consequent low reliability. Sunders (2007b), through an econometric analysis of fair values, confirms that “which valuation rule has minimum mean squared error (relative to the unobserved value of bundles of resources) is a matter of econometrics, not of theory or principle”.
these studies on the effects of the international accounting application have an ex-post perspective, mainly considering samples of listed companies and all the assets of the financial reporting after the IFRS adoption.
This paper contributes to the literature in two aspects. Firstly, it examines how the effect of IAS 38 on existing intangibles is different for firms pursuing internal or external growth strategies in an ex-ante perspective, e.g., through a simulation. For the Italian SMEs the financial reporting represents the document for any kind of valuation made by banks and lenders. This is the reason why the simulation can be useful to understand the implications of different investment alternatives (internal or external) from the accounting point of view. Secondly, the evidence of the authors’ study could be a starting point for the regulator in a revision process of international accounting standards aiming at reducing the GAAP existing in the accounting treatment of the same investment.
3. Hypotheses and research design
The paper aims to examine the effects on the intangible assets coming from the adoption of the international accounting standards (IAS 38).
This means to consider both the reduction of intangibles caused by expensing them on the income statement (reducing effect) and the increase of their economic value due to the impairment test application (instead of the amortization process)2 to the intangibles with indefinite useful life (increasing effect). The impact on the financial reporting is measured in terms of their net results; therefore the authors address the following research question:
Which of these two effects prevails? Is the reducing effect counterbalanced or not by the increasing effect? The hypotheses are:
H1: The reduction of intangibles is expected in SMEs, considering that they invest mainly following internal path of growth.
H2: The increasing effect is expected to prevail in large firms, since it is due to the application of impairment, typical of large firms which show in their financial reporting goodwill and trademarks in spite of internal investments, as a consequence of their external path of growth (M&A).
These two hypotheses are tested by a cluster analysis aiming to identify if there are homogeneous groups of firms from the dimension point of view (total revenues, number of employees and net assets) which present the same impact coming from the application of IAS 38.
4. Data
The database is composed of 128 cases coming from the Italian ceramic tile district (one of the most important in the world). The authors take into consideration the financial reporting for the year 2005, of 99 SMEs according to the European definition3, and 29 large firms.
The financial reporting was downloaded from the AIDA database, which is a database of about 300,000 firms; 80,000 of them are manufacturing firms with revenues of at least 750,000 euros. The 128 cases do not include those in short form according to the law on IAS application since it does not cover that category of firms. The
2
In this assumption the authors are considering the year in which the authors move from Italian GAAP towards IAS/IFRS. The increasing effect is due to the replacement of amortization with the impairment test. Consequently, the value of the asset considered is not reduced during its indefinite useful life, if there are not future depreciations.
3
listed companies with a consolidated balance sheet, already made in compliance with IAS, as well as those with a lack of information in their notes were excluded from these cases.
The choice of a ceramic tile district is due to both its cultural and territorial homogeneity that cause frequently a similar managerial behaviour allowing an easier comparison of their financial reporting. In addition, in recent years the district has been affected by a process of concentration with a lot of M&A, and this external path of growth can highlight some significant effects of the IAS application, with respect to the internal one.
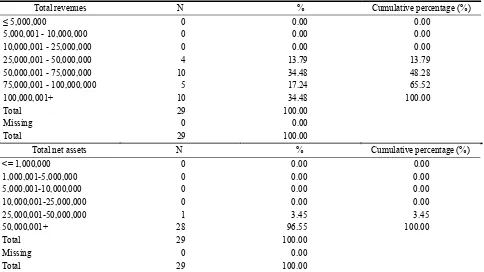
In Table 1, it can be seen that the firms of the sample present on average total revenues for almost 38 million euros and total net assets for almost 49 million euros. However, these mean values are influenced by few cases with high figures, proving that the median values better reflect the distribution of the cases. In fact, looking at the two groups in Tables 2 and 3, it can be seen that the bulk of SMEs presents revenues and investments under 25 million euros; while the large firms have value concentrated in the highest categories, in particular, more than 60% of them present revenues over 75 million euros.
If the homogeneity of the sample in terms of activity code and similar managerial behaviour could be a point of strength, on the other hand, it could be a limit if the authors are looking for an international comparison. The reason is due to the fact that this inward homogeneity makes external comparison more difficult especially with US companies, where available data is only for the listed ones.
Table 1 Characteristics of sample
Total revenues A1 Total net assets Total net income Employee
Valid 128 128 128 124
Missing 0 0 0 4
Mean 38,167,623 49,329,626 152,659 197
Median 19,371,179 24,272,235 44,257 103
Table 2 SME distribution of revenue and net asset categories
Total revenues N % Cumulative percentage
≤5,000,000 12 12.12 12.12
5,000,001 - 10,000,000 26 26.26 38.38
10,000,001 - 25,000,000 34 34.34 72.73
25,000,001 - 50,000,000 20 20.20 92.93
50,000,001 - 75,000,000 6 6.06 98.99
75,000,001 - 100,000,000 1 1.01 100.00
100,000,001+ 0 0.00 100.00
Total 99 100.00
Missing 0 0.00
Total 99 100.00
Total net assets N % Cumulative percentage
≤ 1,000,000 1 1.01 1.01
1,000,001 - 5,000,000 11 11.11 12.12
5,000,001 - 10,000,000 17 17.17 29.29
10,000,001 - 25,000,000 36 36.36 65.66
25,000,001 - 50,000,000 22 22.22 87.88
50,000,001+ 12 12.12 100.00
Total 99 100.00
Missing 0 0.00
Table 3 Large firm distribution of revenue and net asset categories
Total revenues N % Cumulative percentage (%)
≤ 5,000,000 0 0.00 0.00
5,000,001 - 10,000,000 0 0.00 0.00
10,000,001 - 25,000,000 0 0.00 0.00
25,000,001 - 50,000,000 4 13.79 13.79
50,000,001 - 75,000,000 10 34.48 48.28
75,000,001 - 100,000,000 5 17.24 65.52
100,000,001+ 10 34.48 100.00
Total 29 100.00
Missing 0 0.00
Total 29 100.00
Total net assets N % Cumulative percentage (%)
<= 1,000,000 0 0.00 0.00
1,000,001-5,000,000 0 0.00 0.00 5,000,001-10,000,000 0 0.00 0.00
10,000,001-25,000,000 0 0.00 0.00
25,000,001-50,000,000 1 3.45 3.45
50,000,001+ 28 96.55 100.00
Total 29 100.00
Missing 0 0.00
Total 29 100.00
5. The comparison between Italian GAAP and IFRS on intangibles
In order to better understand the impact of the IFRS application, the authors analyse the main differences between Italian GAAP and IFRS with respect to intangible assets.
If the authors consider the acquired intangibles:
According to Italian standards (OIC 24) “specific intangibles” such as concessions, licences, trademarks and patent must be amortized over useful life; goodwill has a useful life of five years, with the possibility to extend it to twenty years;
According to IFRS (IAS 38) capitalization is allowed if the definition of an intangible asset (e.g., identifiability, control over a resource and existence of future economic benefits), is met and the cost of the asset can be measured reliably. Intangibles must be amortized over useful life, while those with an indefinite useful life must not be amortized, but reviewed annually for impairment test.
Acquired goodwill is the asset representing the future economic benefits arising from other assets acquired in a business combination that are not individually identified and separately recognised. Goodwill has an indefinite useful life, thus it is subject to impairment test.
With reference to internally generated intangibles:
According to Italian standards only development and applied research costs can be recognized as asset and amortized. Basic research cannot be considered capital expenditure.
Start-up costs can be recognized as asset if there are future economic benefits and are identifiable and measurable. Training cost can be recognized as capital expenditure only as a start-up cost.
Other intangible assets could be recognized, such as: expenses on third-party goods, financial interest for long-term loan, expenditure on relocating or reorganising part or all of an entity. All these expenditures can be considered as assets if there are future economic benefits. The amortization period is different in dependence on the type of intangible assets.
According to the IAS 38 no intangible asset arising from research (or from the research phase of an internal project) shall be recognized.
An intangible asset arising from development (or from the development phase of an internal project) shall be recognised if, and only if, an entity can demonstrate all of the following:
(1) The technical feasibility of completing the intangible asset so that it will be available for use or sale. (2) Its intention to complete the intangible asset and use or sell it.
(3) Its ability to use or sell the intangible asset.
(4) How the intangible asset will generate probable future economic benefits. Among other things, the entity can demonstrate the existence of a market for the output of the intangible asset or the intangible asset itself or, if it is to be used internally, the usefulness of the intangible asset.
(5) The availability of adequate technical, financial and other resources to complete the development and to use or sell the intangible asset.
(6) Its ability to measure reliably the expenditure attributable to the intangible asset during its development. Expenditure on start-up activities (i.e., start-up costs) (unless this expenditure is included in the cost of an item of property, plant and equipment in accordance with IAS 16), or expenditures for starting new operations or launching new products or processes (i.e., pre-operating costs), expenditure on training activities, on advertising and promotional activities and on relocating or reorganising part or all of an entity are not recognised as a capital expenditure when incurred.
6. A snapshot of intangibles in the ceramic tile district according to Italian Standards
Before analysing the results of the authors’ simulation by applying IAS 38, the authors can take a look at the intangibles in the financial reporting of the year 2005, of SMEs and large firms according to Italian Standards.
The distribution of the intangible assets reflects the low propensity of both SMEs and large firms in investing in intangibles: 89.9% of the SMEs and 89.66% of the large companies have investments of less than 5% of the total net assets4 (See Table 4).
However, their investments are different. With reference to SMEs, where there are two missing values, the investments are mainly concentrated in developing internal resources; in fact, almost 1/3 are in R&D and advertising expenses and 10.59% in start-up and expansion expenses5 (See Table 5).
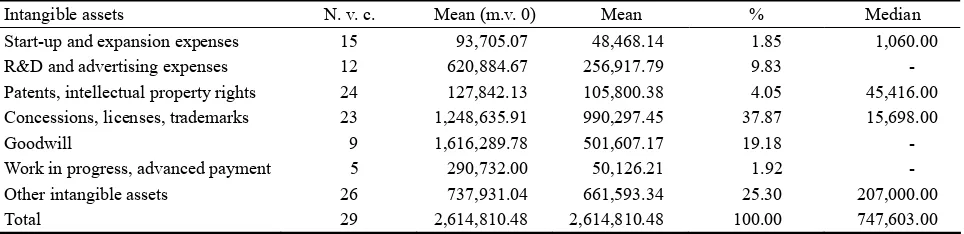
On the other hand, the large firms present in their balance sheet concessions, licences and trademarks (almost 38%), goodwill (over 19%) (See Table 6). Goodwill and Trademarks are the sign of their external growth strategies with M&A, since they can be “written” in the financial reporting, only if externally acquired.
In synthesis, the authors can see that almost 40% of the intangibles in SMEs are represented by capitalized expenses according to Italian standards (start-up and expansion expenses, R&D and advertising expenses), while
4
Net assets = Total assets net of amortization. 5
only 26% by licenses, trademarks and goodwill. For the large companies the authors have the opposite: Over 57% are made up of intangibles arising from M&A.
Table 4 SMEs and large firm distribution of intangibles/net asset categories
SMES Large firms
Intangibles/Net assets N % Cumulative
percentage (%) Intangibles/Net assets N %
Cumulative percentage (%)
≤ 2.50% 76 76.77 76.77 ≤ 2.50% 20 68.97 68.97
2.51% - 5.00% 13 13.13 89.90 2.51% - 5.00% 6 20.69 89.66 5.01% - 10.00% 5 5.05 94.95 5.01% - 10.00% 1 3.45 93.10 10.01% - 15.00% 2 2.02 96.97 10.01% - 15.00% 1 3.45 96.55
15.01%+ 1 1.01 97.98 15.01%+ 1 3.45 100.00
Total 97 97.98 Total 29 100.00 0.00
Missing 2 2.02 100.00 Missing 0 0.00 0.00
Total 99 100.00 Total 29 100.00 0.00
Table 5 The categories of intangible investment for SMEs
Intangible assets N. v. c. Mean (m.v. 0) Mean % Median
Start-up and expansion expenses 34 92,971.12 31,929.47 10.59 - R&D and advertising expenses 31 280,523.81 87,840.79 29.12 - Patents, intellectual property rights 47 32,177.70 15,276.28 5.06 - Concessions, licenses, trademarks 42 136,381.24 57,858.71 19.18 -
Goodwill 9 227,861.78 20,714.71 6.87 -
Work in progress, advanced payment 5 79,366.40 4,008.40 1.33 - Other intangible assets 72 115,482.04 83,986.94 27.85 9,075.00
Total 97 307,859.64 301,615.30 100.00 73,570.00
Table 6 The categories of intangible investment for large firms
Intangible assets N. v. c. Mean (m.v. 0) Mean % Median
Start-up and expansion expenses 15 93,705.07 48,468.14 1.85 1,060.00 R&D and advertising expenses 12 620,884.67 256,917.79 9.83 - Patents, intellectual property rights 24 127,842.13 105,800.38 4.05 45,416.00 Concessions, licenses, trademarks 23 1,248,635.91 990,297.45 37.87 15,698.00
Goodwill 9 1,616,289.78 501,607.17 19.18 -
Work in progress, advanced payment 5 290,732.00 50,126.21 1.92 -
Other intangible assets 26 737,931.04 661,593.34 25.30 207,000.00
Total 29 2,614,810.48 2,614,810.48 100.00 747,603.00
The percentage of “other intangibles”, instead, is similar for the two groups.
Considering the nature of the intangible assets, it is necessary to point out that the presence of a “missing value” (i.e., values equal to zero when a category of intangibles is missing) can make the difference in the calculation of the mean. When the missing values are taken into account, the total number of cases considered is 128. On the contrary, without the missing values, the mean is calculated considering only the valid cases. Both values, however, give useful information: in the first case, the authors have the weight of the specific class of intangibles on the whole group of firms considered; in the second one, the information is useful in appreciating the role of the intangible categories and their effects on the financial reporting.
intangibles must be respected, internal investments can be part of the assets, allowing this strategy of growth to be represented in financial reporting.
7. Assumptions and methodology
The authors’ simulation is based on the financial reporting for the year 2005. Since this is the first year of the international standard application, the authors consider the adjustments for the opening IFRS balance sheet at January 1, 2005 and those at the December 31, 2005, due to the differences between IAS/IFRS and Italian Standards.6
In order to rewrite the intangibles of the firms considered in compliance with IAS 38, additional information in the notes of their financial reporting was necessary: the distinction between advertising expenses and R&D expenses; the distinction between trademarks and concessions or licences; the nature of other intangible assets. In addition, some simplified assumptions were adopted: (1) The research and development expenses were entirely considered as development expenses with finite useful life; (2) Trademarks were considered as assets with indefinite useful life; the same for goodwill; (3) The value of assets with indefinite useful life coming from the impairment test coincides with the net book value at the beginning of the period.
The motivations of these assumptions are:
R&D expenses considered as only development expenses is consistent with a mature industry such as the ceramic tile industry, in which investments in innovation mainly concern processes or existing products; literature (Guatri & Bini 2003a; Hitchner, 2003) confirms that trademarks and goodwill considered as an indefinite life intangible is an acceptable simplification. Also IAS 38 considers goodwill as an indefinite life asset; finally, for the indefinite useful life intangibles the approximation of their value to the book value at the beginning of the financial period finds justification in: IFRS 1 (Appendix B, par. B2 (g), (h))7, IAS 38 par. 1088 and OIC 24 par.
6
In general, IFRS 1 requires a first-time adopter to comply with each IFRS that has come into effect at the reporting date for its first IFRS financial statements. In particular, it requires a first-time adopter to do the following in its opening IFRS balance sheet: (1) Recognise all assets and liabilities whose recognition is required by IFRSs.
(2) Not recognise items as assets or liabilities if IFRSs do not permit such recognition. (3) Classify all recognised assets and liabilities in accordance with IFRSs.
(4) Apply IFRSs in measuring all recognised assets and liabilities. 7
(g) The carrying amount of goodwill in the opening IFRS statement of financial position shall be its carrying amount under previous GAAP at the date of transition to IFRSs, after the following two adjustments:
(1) If required by paragraph B2(c) (i) above, the first-time adopter shall increase the carrying amount of goodwill when it reclassifies an item that it recognised as an intangible asset under previous GAAP. Similarly, if paragraph B2 (f) requires the first-time adopter to recognise an intangible asset that was subsumed in recognised goodwill under previous GAAP, the first-time adopter shall decrease the carrying amount of goodwill accordingly (and, if applicable, adjust deferred tax and non-controlling interests).
(2) [deleted]
(3) Regardless of whether there is any indication that the goodwill may be impaired, the first-time adopter shall apply IAS 36 in testing the goodwill for impairment at the date of transition to IFRSs and in recognising any resulting impairment loss in retained earnings (or, if so required by IAS 36, in revaluation surplus). The impairment test shall be based on conditions at the date of transition to IFRSs.
(h) No other adjustments shall be made to the carrying amount of goodwill at the date of transition to IFRSs. For example, the first-time adopter shall not restate the carrying amount of goodwill:
(1) To exclude in-process research and development acquired in that business combination (unless the related intangible asset would qualify for recognition under IAS 38 in the statement of financial position of the acquiree);
(2) To adjust previous amortisation of goodwill;
(3) To reverse adjustments to goodwill that IFRS 3 would not permit, but were made under previous GAAP because of adjustments to assets and liabilities between the date of the business combination and the date of transition to IFRSs.
8
“In accordance with IAS 36, an entity is required to test an intangible asset with an indefinite useful life for impairment by comparing its recoverable amount with its carrying amount
(1) Annually, and
D.II9.
Since national standards take into account the value in use in order to determine a potential loss of intangible value, the book value at the beginning of the period can be considered a correct application of the cost model (IAS 38 par. 74).
In particular, the IAS 38 application to the intangible assets of the companies implied the following variations: start-up and expansion expenses: the IAS 38 does not consider them as intangible assets, since they do not have the requisites of identifiability, control and future economic benefits; this is the reason why they are eliminated in the balance sheet and included in the equity in the opening IFRS balance sheet at January 1, 2005 and amortizations and capitalization of the year expensed on the income statement; research & development expenses: they are considered as assets without distinction, i.e., as expenses of development with finite useful life. No change has been made to their amortization plan; advertising expenses: they received the same treatment of the start-up and expansion expenses; industrial patent rights and rights of use of original works: they maintain the same value of the balance sheet consistently with the national accounting principles, since there is no difference between the national and international standards10; concessions, licences: they represent intangible assets with finite useful life for the IAS 38, thus they are subject to amortization like in compliance with Italian OIC 24, and for this reason they have maintained the value of the Italian balance sheet; trademarks and similar rights: they are considered without distinction as intangible assets with indefinite useful life. They are evaluated at the book value at the beginning of the year, without amortization; goodwill: considered an intangible asset with indefinite useful life, it receives the same treatment as trademarks; it is evaluated at its net book value at the beginning of the year, without amortization; fixed assets in progress and advanced payments: They have maintained the value shown in the Italian balance sheet (they represent an insignificant amount); other intangible assets: they are considered according to their nature and identified through notes: (1) as expenses (e.g., expenses of capitalized work); (2) sometimes as accessory expenses for other assets or liabilities (e.g., special maintenance on third-party goods11, expenses for taking out a mortgage12); (3) as intangible assets (e.g., software). In the first case they received the same treatment as the start-up and expansion expenses, in the second case they have been reclassified increasing or reducing other assets in the balance sheet, while in the third case, they maintained the already existing amortization plan.
8. The results of the IAS 38 application
IAS 38 is not neutral with respect to the strategies of growth in terms of intangible assets. The internal path of growth implies expensing most of the intangible investments on the income statement that are consequently excluded from the assets. The firms that follow external path of growth through M&A show trademark and goodwill, whose value is subject to the impairment test, in their financial reporting.
Therefore, it is possible to appreciate a combined reducing and increasing effect of the intangibles due respectively to the capitalized costs expensed on the income statement and to intangible assets with indefinite
9
Also in Italian Standard with regard to the rules for amortisation, there are references to the book value of intangibles that cannot exceed the recoverable value defined as the higher of its fair value minus selling costs and its value in use. Value in use is the present value of the future cash flows expected to be derived from an asset, including those from its selling at the end of its useful life. 10
Cfr. IAS 38 par. 92 and OIC 24. 11
Third-party goods were considered as identifiable goods and reallocated under other categories of intangibles. 12
useful life under the impairment test.
This different treatment is particularly significant for SMEs because it causes the loss of the capitalized expenses according to Italian standards, which represent the bulk of their investments in intangibles, with consequent negative results on the equity.
A close examination of the intangibles affected by a reduction highlights that the IAS 38 implies the elimination of start-up, advertising and research expenses as well as some other costs under the category “Other intangibles”. Table 7 and Table 8 show how the percentages change for these categories of assets, for both SMEs and large firms.
Table 7 The comparison between IAS/IFRS simulation and Italian Standards (OIC) for SMEs
Intangibles IFRS mean (m.v. 0)
Ita St. mean
(m.v. 0) IFRS mean Ita St. mean
IFRS mean (%)
Ita St. mean (%)
IFRS median
Ita St. median Start-up and expansion costs - 92,971.12 - 31,929.47 0.00 10.59 - - R&D and advertising
expenses 349,179.15 280,523.81 70,541.24 87,840.79 37.37 29.12 - - Patents, intellectual property
rights 32,177.70 32,177.70 15,276.28 15,276.28 8.09 5.06 - - Concessions, licenses 21,872.08 21,872.08 5,744.18 5,744.18 3.04 1.90 - - Trademarks 313,785.83 271,544.09 60,221.52 52,114.52 31.90 17.28 - - Goodwill 281,620.67 227,861.78 25,601.88 20,714.71 13.56 6.87 - - Work in progress, advanced
payment 79,366.40 79,366.40 4,008.40 4,008.40 2.12 1.33 - - Other intangible assets 243,511.00 115,482.04 7,379.12 83,986.94 3.91 27.85 - 9,075.00 Total 252,561.08 307,859.64 188,772.64 301,615.30 100.00 100.00 18,352.00 73,570.00
Table 8 The comparison between IAS/IFRS simulation and Italian Standards (OIC) for large firms
Intangibles IFRS mean (m.v. 0)
Ita St. mean
(m.v. 0) IFRS mean Ita St. mean
IFRS mean ( %)
Ita St. mean (%) IFRS median Ita St. median Start-up and
expansion costs - 93,705.07 - 48,468.14 0.00 1.85 - 1,060.00 R&D and advertising
expenses 607,360.43 620,884.67 146,604.24 256,917.79 6.42 9.83 - - Patents, intellectual
property rights 127,842.13 127,842.13 105,800.38 105,800.38 4.64 4.05 45,416.00 45,416.00 Concessions,
licenses 63,095.82 63,095.82 23,932.90 23,932.90 1.05 0.92 - - Trademarks 2,700,103.07 2,001,755.14 1,303,498.03 966,364.55 57.12 36.96 - - Goodwill 1,970,535.22 1,616,289.78 611,545.41 501,607.17 26.80 19.18 - - Work in progress,
advanced payment 290,732.00 290,732.00 50,126.21 50,126.21 2.20 1.92 - - Other intangible
assets 589,314.00 737,931.04 40,642.34 661,593.34 1.78 25.30 - 207,000.00 Total 2,363,654.86 2,614,810.48 2,282,149.52 2,614,810.48 100.00 100.00 248,648.00 747,603.00
Table 9 shows, in fact, that the reducing effect for SMEs is about 33%, while 21.4% of other intangibles is reallocated.
If the authors consider the large firms (Table 10), the authors can see that the net reduction is 7.15%, while 22.67% is reallocated.
Table 9 Intangibles excluded from the reallocation according to IFRS in SMEs
Intangibles not IFRS Mean %
Start-up and expansion expenses 70,541.24 23.39
Advertising expenses 17,299.55 5.74
Other expensed intangibles 12,057.78 4.00
Expensed intangibles 99,898.57 33.12
Other intangibles redistributed 64,550.03 21.40
Redistributed intangibles 64,550.03 21.40
Total reduction 164,448.60 54.52
Total intangibles Ita. St. (OIC) 301,615.30 100.00
Table 10 Intangibles excluded from the reallocation according to IFRS in large firms
Intangibles not IFRS Mean %
Start-up and expansion expenses 48,468.14 1.85
Advertising expenses 110,313.55 4.22
Other expensed intangibles 28,204.34 1.08
Expensed intangibles 186,986.03 7.15
Other Intangibles Redistributed 592,746.66 22.67
Redistributed Intangibles 592,746.66 22.67
Total reduction 779,732.69 29.82
Total intangibles Ita. St. (OIC) 2,614,810.48 100.00
These results confirm that IAS 38 has a more relevant impact, in terms of information loss due to the net reduction, for SMEs than for large companies, penalizing in this way the internal strategy of growth (i.e., investments in intangibles arising from internal process, rather than M&A).
Considering the lack of amortization of the intangibles with indefinite useful life, the increase of the trademark mean value (with m.v.0) is 2.69% of total intangible value according to Italian Standards (Table 11) for SMEs and 12.89% for large firms (Table 12).
The examination of the increasing effect produced by IAS 38 points out that the reducing effect for SMEs is not offset by the increasing effect coming from the application of the impairment test to the intangibles with indefinite useful life (See Table 9 and Table 11).
For large companies, the IAS 38 does not produce the same reducing effect, since this is more than counterbalanced by the application of the impairment test to those assets with indefinite useful life (See Table 10 and Table 12).
Tables 7 and 8 show that the combined increasing and reducing effects of the IAS 38 application generate a concentration in the intangibles with an indefinite useful life (goodwill and trademarks) more than 45% for SMEs and almost 84% for large companies.
The authors’ cluster analysis aims to highlight whether there are groups of firms for which IAS 38 produces homogeneous effects. For this purpose the authors identify two sets of strategy indicators:
(2) Trademarks and goodwill as indicators of external growth.
Table 11 Increasing effect for SMEs
Intangibles Mean %
Δ Trademarks 8,107.00 2.69
Δ Goodwill 4,887.17 1.62
Assets under "impairment" 12,994.17 4.31
Total increase 12,994.17 4.31
Total intangibles Ita. Stand. (OIC) 301,615.30 100.00
Table 12 Increasing effect for large firms
Intangibles Mean %
Δ Trademarks 337,133.48 12.89
Δ Goodwill 109,938.24 4.20
Assets under “impairment” 447,071.73 17.10
Total increase 447,071.73 17.10
Total intangibles Ita. Stand. (OIC) 2,614,810.48 100.00
Thus, in the authors’ model they build two variables: (1) the first one is negative and measures the information loss in terms of reducing effect; (2) the second is positive and is relative to the valuation of trademarks and goodwill.
In order to reduce the variability, the authors replace their values with their natural logarithm. In addition, for the first negative variable the authors consider the absolute value, while for value = 0 the authors have used logn (1+abs(variable)).
Considering these two variables, the authors create clusters according to the algorithm of K-means clustering that requires the definition of the number of clusters, k. The number of four clusters is the result of a dispersion diagram that shows a concentration in four zones in the first quadrant (with both positive values) of the orthogonal plan.
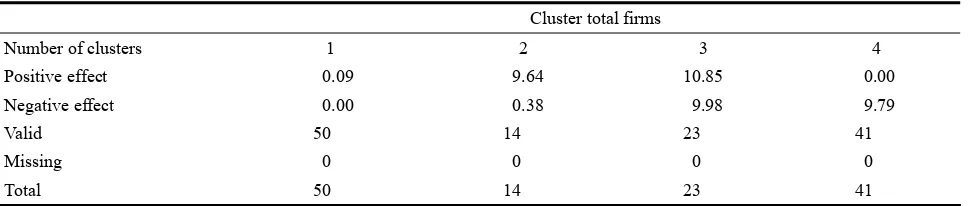
The cluster analysis on the whole number of firms considered is shown in Table 13.
Table 13 Total cluster analysis
Cluster total firms
Number of clusters 1 2 3 4
Positive effect 0.09 9.64 10.85 0.00
Negative effect 0.00 0.38 9.98 9.79
Valid 50 14 23 41
Missing 0 0 0 0
Total 50 14 23 41
Considering the characteristics of the firms in each cluster in terms of total revenues, number of employees, total assets, and the authors can see in Table 14 that the combination of reducing and increasing effects makes it possible to identify four types of firms.
Table 14 Characteristics of each cluster for the total number of firms
Number of clusters Eff. + Eff. - Total revenues N. of employees Net assets
1 Mean 0.09 0.00 27,044,329 127 30,607,530
N 50.00 50.00 50 49 50
Median 0.00 0.00 15,440,731 72 17,505,061
2 Mean 9.64 0.38 55,261,982 226 61,209,199
N 14.00 14.00 14 14 14
Median 10.39 0.00 35,363,160 166 37,035,254
3 Mean 10.85 9.98 68,108,280 375 92,501,349
N 23.00 23.00 23 22 23
Median 10.75 9.86 46,770,495 249 65,912,128
4 Mean 0.00 9.79 29,099,539 175 43,886,727
N 41.00 41.00 41 39 41
Median 0 9.7258 13155764 81 19151710
Total Mean 3.04 4.97 38,167,623 197 49,329,626
N 128.00 128.00 128 124 128
Median 0.00 5.49 19,371,179 103 24,272,235
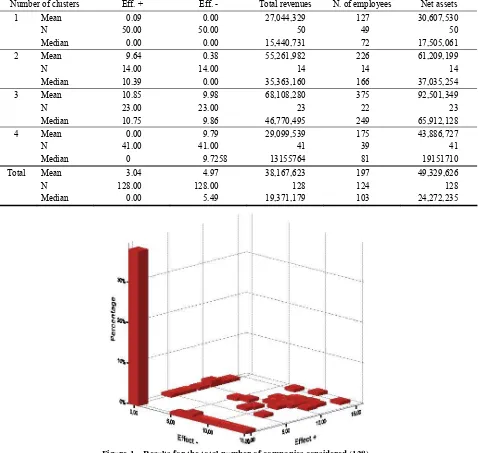
Figure 1 Results for the total number of companies considered (128).
Cluster No. 4 is made of 41 firms and is related to those that follow internal strategies of growth. They do not have value in terms of increasing effect (i.e., they do not have trademarks and goodwill; thus in this cluster the only impact of IAS 38 is the reducing effect). The dimensions of these kinds of companies are greater than those of cluster No. 1.
On the contrary, cluster No. 2, which is composed of 14 firms, highlights significant increasing effects due to impairment, while the reducing effect is almost 0. The company dimensions are greater than those of the other two clusters and this confirms the tendency of large firms towards processes of external growth through M&A.
There are 91 cases (equal to 71%, clusters 1 and 4) in which the introduction of the IAS 38 does not produce increasing effect, and in 41 cases (cluster 4) the reducing effect prevails.
The cluster analysis replicated on the two groups of firms confirms the results of the total number of companies, even if they are amplified.
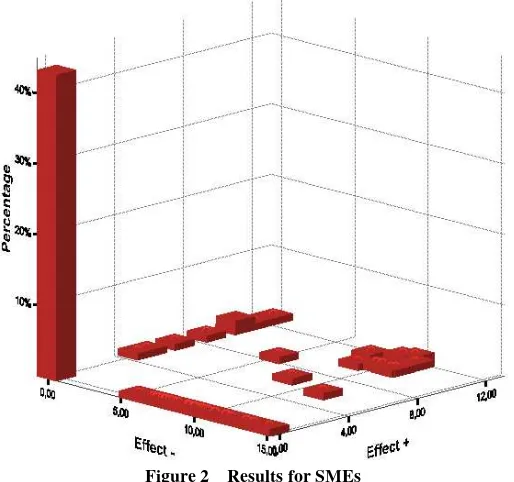
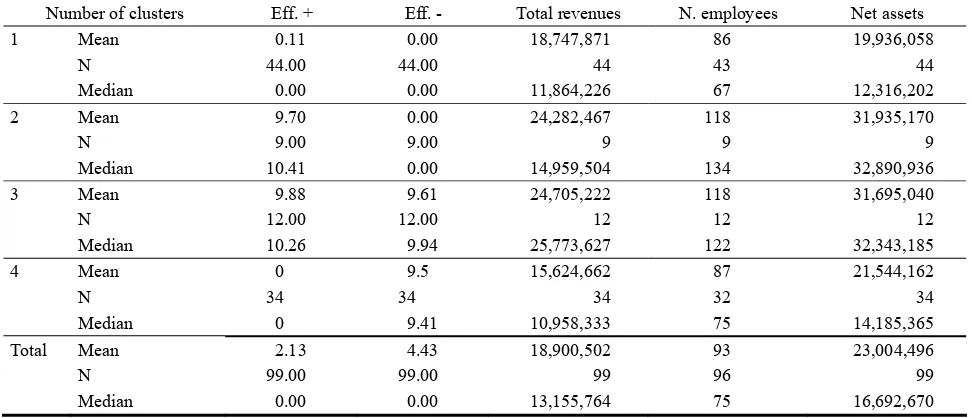
With a specific reference to SMEs (Tables 15 and 16), there is, in fact, a greater number of cases for which the increasing effect is almost 0: from 71% (if the authors consider the total number of cases) to 79% (cluster 1 and 4) out of the 99 cases. In addition, the authors have 44 cases out of the total of 99 (i.e., almost 45% for which IAS 38 does not produce effects) (Figure 2). However, the increasing effect in SMEs (Table 16) is on average lower than that one of the total number of companies (Table 14).
Also for large companies the authors have four clusters with different combinations in terms of increasing and reducing effect. However, the clusters have different characteristics with respect to those of SMEs (Tables 17 and 18): the number of cases for which IAS 38 does not have impact is only 6 (cluster 1) and the number of firms without increasing effect is 13 out of a total of 29 (cluster 1 and 4).
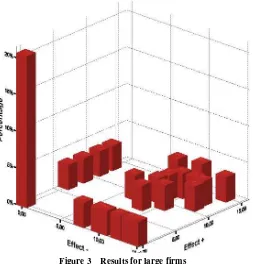
Cluster 3 shows a combination of increasing and decreasing effect due to the presence of both internal investments and external growth through M&A. The positive effect prevails (Figure 3).
Figure 2 Results for SMEs
Table 15 Cluster analysis for SMEs
Cluster SMEs
Number of clusters 1 2 3 4
Positive effect 0.11 9.70 9.88 0.00
Negative effect 0.00 0.00 9.61 9.50
Valid 44 9 12 34
Missing 0 0 0 0
Table 16 Characteristics of each cluster for SMEs
Number of clusters Eff. + Eff. - Total revenues N. employees Net assets
1 Mean 0.11 0.00 18,747,871 86 19,936,058
N 44.00 44.00 44 43 44
Median 0.00 0.00 11,864,226 67 12,316,202
2 Mean 9.70 0.00 24,282,467 118 31,935,170
N 9.00 9.00 9 9 9
Median 10.41 0.00 14,959,504 134 32,890,936
3 Mean 9.88 9.61 24,705,222 118 31,695,040
N 12.00 12.00 12 12 12
Median 10.26 9.94 25,773,627 122 32,343,185
4 Mean 0 9.5 15,624,662 87 21,544,162
N 34 34 34 32 34
Median 0 9.41 10,958,333 75 14,185,365
Total Mean 2.13 4.43 18,900,502 93 23,004,496
N 99.00 99.00 99 96 99
Median 0.00 0.00 13,155,764 75 16,692,670
Table 17 Cluster analysis for large firms
Cluster large firms
Number of clusters 1 2 3 4
Positive effect 0.00 9.83 11.62 0.00
Negative effect 0.00 0.00 9.97 11.19
Valid 6 4 12 7
Missing 0 0 0 0
Total 6 4 12 7
Table 18 Characteristics of each cluster for large firms
Number of clusters Eff. + Eff. - Total revenues N. employees Net assets
1 Mean 0 0 87,885,016 421 108,864,991
N 6 6 6 6 6
Median 0 0 66,832,782 359 80,717,213
2 Mean 9.83301 0 130,424,955 491 136,985,173
N 4 4 4 4 4
Median 9.92476 0 121,420,564 498 135,978,431
3 Mean 11.6231 9.97321 108,621,125 635 147,396,844
N 12 12 12 11 12
Median 11.772 9.60923 86,964,597 440 109,617,387
4 Mean 0 11.1862 94,548,942 576 152,407,755
N 7 7 7 7 7
Median 0 10.4762 55039544 461 70088761
Total Mean 6.16585 6.82697 103,941,587 554 139,198,174
N 29 29 29 28 29
Median 7.31122 8.80747 81,756,040 431 101,870,620
Figure 3 Results for large firms
9. Conclusions
The adoption of IAS 38 requires firms to write-off several types of intangibles assets that are capitalized under the Italian GAAP as results of internal investments. On the other hand, the intangible assets with indefinite useful life, typically coming from M&A processes, such as goodwill and trademark, are subject to impairment test, and not to amortization. The authors’ analysis points out that the IAS 38 application can better represent this second type of investments, with respect to those coming from internal growth strategy.
Consequently, the economic and financial contribution of intangibles is different according to the path of growth followed by the firms, allowing an unjustified discretion in terms of representing the same assets in financial reporting. In fact, the authors’ simulation, further confirmed by the cluster analysis, highlights that the application of international standards to any kind of companies (according to the present IAS 38) does not allow a homogeneous treatment of similar assets acquired in different contexts (internally or externally). Internally generated intangible assets (typically present in SMEs) cannot be represented in the balance sheet, while the authors can find the acquired intangibles coming from M&A operations, typical of large firms.
This means that the convergence towards a unique body of principles can create an unjustifiable different treatment without capturing the diversified nature of many firms.
The necessity of reducing this gap existing in the valuation criteria of intangibles with an internal or external origin has also drawn the attention of IFRIC that has inserted the topic in its agenda for the Annual Improvements Process. The project takes into account when costs incurred for advertising and promotional activities (including catalogues) may be carried forward in the balance sheet.13 This is only referred to a particular asset, but it is a
13
sign of the attention of the regulator.
There is also an IASB project that aims to analyze the current requirements in IAS 38 with significant limitations in recognizing intangible assets and their subsequent remeasurement. In fact, IAS 38 does not allow the recognition of assets arising from research as well as those internally generated. In addition, only minimal requirements for the disclosure on intangibles that could compensate the limitations in recognizing and measuring them are specified.
“The measurement/remeasurement and recognition and/or disclosure of intangible assets in accordance with the principles in the Framework would arguably improve the relevance and reliability of information in general purpose financial reports. Furthermore, the removal of the current difference in the treatment of intangible assets acquired in a business combination and internally generated intangible assets (and between internally generated tangible and intangible assets) would lead to consistent accounting for circumstances that are economically very similar.” (IASB)
In accordance with this IASB project, Australian Accounting Standards Board (2008) has published a discussion paper that represents a proposal in recognizing internally generated intangible assets. In particular, it takes into consideration a cost-based model and a valuation-based model. The former considers only planned internally generated intangibles. The latter uses a technique based on a hypothetical business combination and accordingly, all internally generated intangible assets that would be recognised if acquired in a business combination under IFRS 3 should be recognised.
The board highlights that if an internally generated intangible asset does not meet the relevant recognition criteria, in the interest of providing useful information to users, entities should be required to disclose a description of the asset and the reason why it fails to meet the relevant recognition criteria.
This confirms that an improvement in financial reporting could be a wide and standardised disclosure template (Lev, 2008) capable of offsetting the “loss of information” due to the adoption of IAS 38, that requires firms to write-off many types of intangible assets. In the notes, in fact, information on investment cost and its fair value could allow the safeguarding of the prudence principle from an accounting point of view and the true and fair view of the intangible contribution to the future profitability and cash flow generating capacity.
The evidence of the authors’ study is a contribution to the empirical literature based on the broad consensus that the treatment of intangibles in current accounting systems is not appropriate (Cañibano, 2000) and presents an inter-country disharmony (Stolowy & Jeny-Cazavan, 2001).
Even if accounting research has not an immediate impact on accounting practice, the authors’ analysis is a further confirmation that a revision process on behalf of the standard setter is necessary (Lev, 1997). Intangibles, in fact, are one of the determinants of the financial performance of firms and, therefore, they should be reported in the financial statement.
In the meanwhile, a wider disclosure about intangibles could be the first step towards a recognition-based approach.
References:
Alfredson, K., Leo, K., Picker, R., Pacter, P., Radford, J. & Wise, V.. (2007). Applying international financial reporting standards enhanced edition. Wiley.
Alijarde, I. B. & López, V. C.. (2002, May). Towards the harmonisation of local accounting systems in the international context. Financial Accountability and Management, 18(2).
Andrei P.. (Ed.) (2006). L’adozione degli IAS/IFRS in Italia: Impatti contabili e profili gestionali. Torino: Giappichelli. Arruñada, B.. (2008). Mandatory accounting disclosure by small private companies. Retrieved from: http://d.repec.org/n?u=
RePEc:upf:upfgen:1090&r=acc.
Ball, R.. (2006). IFRS: Pros and cons for investors. Accounting & Business Research, International Accounting Policy Forum. 5-27 Barth, M. E., Landsman, W. R. & Lang, M. H.. (2008, June). International accounting standards and accounting quality. Journal of
Accounting research, 46(3).
Bartov, E., Goldberg, S. & Kim, M.. (2005). Comparative value relevance among german, U.S. and international accounting standards: A german stock market perspective. Journal of Accounting, Auditing and Finance, (20).
Basu, S. & Waymire, G.. (2008). Has the importance of intangibles really grown? And if so, why? Accounting and Business Research, 38(3).
Bounfour, A.. (2003). The management of intangibles. London and New York: Routledge.
Bradshaw, M. T. & Miller, G. S.. (2005). Will harmonizing accounting standards really harmonize accounting? Evidence from non-U.S. firms adopting US GAAP. Working paper, Harvard University.
Busacca, G. A. & Maccarrone, P.. (2007, December). IFRSs and accounting for intangible assets: The telecom Italia case. Journal of Intellectual Capital, 8(2).
Cairns, D.. (2008). Understanding international financial reporting standards: A guide for students and practitioners. Wiley. Campedelli Bertacche, B.. (2006). Principi contabili internazionali e imprese minori. Una prospettiva europea. Rivista italiana di
ragioneria e di economia aziendale,106(3-4)
Cañibano L.. (2000). Accounting for intangibles: A literature review. Journal of Accounting Literature, 19.
CFA Institute. (2007). A comprehensive business reporting model financial reporting for investors. Retrieved from: www.cfainstitute.org.
Chambers, D., Jennings, R. & Thompson, R. B.. (2003). Managerial discretion and accounting for research and development. Journal of Auditing, Accounting and Finance, 18(1).
Chan, L. K. C., Lakonishok, J. & Sougiannis, T.. (2001). The stock market valuation of research and development expenditures. Journal of Finance, 56(6).
Choi, F. D. S. & Meek, G. K.. (2008). International accounting. Englewood Cliffs, NJ: Prentice-Hall.
Copeland, T., Koller, T. & Murrin, J.. (2000). Valuation: Measuring and managing the value of companies. Wiley.
Daske, H.. (2006). Economic benefits of adopting IFRS or US-GAAP – Have the expected costs of equity capital really decreased? Journal of Business Finance & Accounting, 33(3-4).
Della Bella, C.. (2006). Impairment. 5. Le valutazioni per il bilancio: la stima del full goodwill. Università Bocconi Editore.
Di Pietra, R.. (2005). Il progetto IASB per la redazione dei bilanci delle pmi. Quaderni senesi di Economia Aziendale e di Ragioneria, Università degli Studi di Siena.
Diamond, D. W. & Verrecchia, R. E.. (1991). Disclosure, liquidity, and the cost of capital. Journal of Finance, 46(4).
Dye, R. A. & Sunder, S.. (2001). Why not allow the FASB and IASB standards to compete in the US? Accounting Horizons,15(3). Dye, R. A. & Verrecchia, R. E.. (1995). Discretion vs. uniformity: choices among GAAP. Accounting Review, 70(3).
Epstein, B. J., Nach, R. & Bragg, S. M.. (2007). Wiley GAAP 2007: Interpretation and application of generally accepted accounting principles. Wiley.
Epstein, B. J. & Jermakowicz, E. K.. (2008). IFRS 2008: Interpretation and application of international financial reporting standards. Wiley.
Ernst & Young. (2004). Effects of adopting IAS: 2002-2005. Retrieved from: http://www.ey.com/GLOBAL/content.nsf/ International/Assurance_-_IAS_ _Effects_of_Adopting_IAS_2002_-_2005.
Fearnley, S. & Hines, T.. (2007, December). How IFRS has destabilised financial reporting for UK non-listed entities. Journal of Financial Regulation and Compliance, 15(4).
Fondazione OIC. (2005). OIC 24. Retrieved from: http://www.fondazioneoic.it/. Godfrey, J. M.. (2006). Accounting theory. Wiley & Sons Australia Ltd.
Godfrey, J. M. & Chalmers, K.. (2007). Globalisation of accounting standards. Edward Elgar Publishing. Greene, W. H.. (2007). Econometric analysis (6th ed.). Prentice Hall.
Guatri, L. & Bini, M.. (2003a). Impairment. 1 - Il valore potenziale controllabile. Università Bocconi Editore. Guatri, L. & Bini, M.. (2003b). Impairment 2. Gli intangibili specifici. Università Bocconi Editore.
Guatri, L. & Bini, M.. (2003c). Impairment 3. La valutazione degli intangibili nei gruppi. Università Bocconi Editore.
Harris, M. S. & Muller, III K. A.. (1999). The market valuation of IAS versus US-GAAP accounting measures using Form 20-F reconciliations. Journal of Accounting & Economics, 26(1-3).
Hitchner, J. R.. (2003). Financial valuation. Wiley.
Hitz, J. M.. (2007). The decision usefulness of fair value accounting–A theoretical perspective. European Accounting Review, 16(2). Hodgson, G. & Tarca, H.. (2006). Accounting theory. Wiley.
Hoogendoorn, M.. (2006). International accounting regulation and IFRS implementation in Europe and beyond-experiences with first-time adoption in Europe. Accounting in Europe, 3(1).
Hubbard, D. W.. (2007). How to measure anything: Finding the value of “intangibles” in business. Wiley.
Hung, M. & Subramanyam, K. R.. (2007). Financial statement effects of adopting international accounting standards: The case of Germany. Review of Accounting Studies, 12(4).
IASB. (2005). Management commentary. Retrieved from: www.iasb.org.
IASB. (2006). Road map for convergence between IFRS and US GAAP. Retrieved from: www.iasb.org. IASB. (2006). IAS 38. Retrieved from: www.iasb.org.
IASB. (2008). IFRS 3. Retrieved from: www.iasb.org.
Ittner, C. D.. (2008). Does measuring intangibles for management purposes improve performance? A review of the evidence. Accounting and Business Research, 38(3).
Hand, J. & Lev, B.. (Ed.) (2003). Intangible assets: Values, measures and risks. Oxford University Press.
Karamanou, I. & Nishiotis, G.. (2005). The valuation effects of firm voluntary adoption of international accounting standards. Working paper, University of Cyprus.
Kothari, S. P., Laguerre, T. & Leone, A.. (2002). Capitalization versus expensing: Evidence on the uncertainty of future earnings from capital expenditures versus R&D outlays. Review of Accounting Studies, 7(4).
Langendijk, H., Swagerman, D. & Verhoog, W.. (2003). Is fair value fair. Wiley.
Leuz, C.. (2003). IAS versus U.S. GAAP: Information asymmetry-based evidence from Germany’s new market. Journal of Accounting Research, 41(3).
Lev, B.. (1969). Accounting and information theory (Illinois: American Accounting Association). Reviewed in The Accounting Review, (1971, January).
Lev, B.. (1974). Financial statement analysis: A new approach. Englewood Cliffs: Prentice-Hall, Inc.. Lev, B.. (1997, April). The old rules no longer apply. Forbes, ASAP supplement, 34-36.
Lev, B.. (2001). Intangibles management, measurement, and reporting. The Brookings Institution Press. Lev, B.. (2003). What then must we do? In: Hand, J. and Lev, B.. (2003). Intangible assets. Oxford.
Lev, B.. (2008). A rejoinder to Douglas Skinner’s “Accounting for intangibles–a critical review of policy recommendations”. Accounting and Business Research, 38(3).
Lev, B. & Penman, S. H.. (1990, Spring). Voluntary forecast disclosure, nondisclosure, and stock prices. Journal of Accounting Research, 28(1).
Lev, B. & Sougiannis, T.. (1996). The capitalization, amortization, and value-relevance of R&D. Journal of Accounting and Economics, 21(1).
Lev, B., Nissim, D. & Thomas, J.. (2002). On the informational usefulness of R&D capitalization and amortization. Working Paper, Columbia University.
Lev, B. & Zambon, S.. (2003). Intangibles and intellectual capital: An introduction to a special issue. European Accounting Review, 12(4).
Lev, B. & Zarowin, P.. (1999). The boundaries of financial reporting & how to extend them. Journal of Accounting Research, 37(2). Martin, C. & Hartley, J.. (2006). SME intangible assets. ACCA Research Report N. 93.
Mcgowan, D. S.. (2007). Contemporary issues in accounting. Wiley.
Monahan, S.. (2005). Conservatism, growth and the role of accounting numbers in the fundamental analysis process. Review of Accounting Studies, 10(2-3).
OIC.. (2005). Guida operativa per la transizione ai principi contabili internazionali (IAS/IFRS), guida 1, ottobre. Retrieved from: www.fondazioneoic.it.
Oswald, D. R. & Zarowin, P.. (2007). Capitalization of R&D and the informativeness of stock prices. European Accounting Review, 16(4).
PricewaterhouseCoopers. (2004). Principi contabili internazionali IAS IFRS, IPSOA. Francis Lefebvre.
Quagli, A., Avallone, F. & Ramassa, P.. (2007). Stock option plans in Italy: Does earnings management matter? Retrieved from: http://papers.ssrn.com/sol3/papers.cfm?abstract_id=955469.
Ronen, J.. (2001). On R&D capitalization and value relevance: A commentary. Journal of Accounting and Public Policy,20(2). Ronen, J.. (2008). To fair value or not to fair value: A broader perspective. Abacus, 44(2).
Skinner, D. J.. (2008). Accounting for intangibles-a critical review of policy recommendations. Accounting and Business Research, 38(3).
Smith, G. V.. (2004). Valuation of intellectual property and intangible assets. Wiley.
Soderstrom, N. S. & Sun, K. J.. (2007). IFRS adoption and accounting quality: A review. European Accounting Review, 16(4). Stark, A. W.. (2008). Intangibles and research - an overview with a specific focus on the UK. Accounting and Business Research,
38(3).
Stolowy H. & Jeny-Cazavan A.. (2001). International accounting disharmony: The case of intangibles. Accounting, Auditing & Accountability Journal, 14(4).
Sullivan, P. H.. (2000). Value-driven intellectual capital- how to convert intangible corporate assets into market value. Wiley. Sunder, S.. (2002). Regulatory competition among accounting standards within and across international boundaries. Journal of
Accounting and Public Policy, 21(3).
Sunder, S.. (2007a, April). Uniform financial reporting standards. CPA Journal.
Sunder, S.. (2007b). Econometrics of current or “fair”values. Retrieved from http://ssrn.com/abstract=983752. Sunder, S.. (2009). IFRS and the accounting consensus. Accounting Horizons, 23(1).
Teodori, C. (Ed.). (2006). L’adozione degli IAS/IFRS in Italia: le attività immateriali e l’Impairment test. Giappichelli.
The Office of the Australian Accounting Standards Board. (2008). Initial accounting for internally generated intangibile assets. Discussion paper.
Weetman, P., Gordon, P. & Clare, R.. (2008). International corporate reporting a comparative approach (4th ed.). Prentice Hall. Whittington, G.. (2008). Fair value and the IASB/FASB conceptual framework project: An alternative view. Abacus, 44(2).
Wyatt, A.. (2008). What financial and non-financial information on intangibles is value-relevant? A review of the evidence. Accounting and Business Research, 38(3).
Zambon, S.. (2002). The communication of intangibles and intellectual capital: An empirical model of analysis. Presentation of the AIAF official report, AIAF, 106:
Zambon, S. (Ed.). (2003). Study on the measurement of intangible assets and associated reporting practices. Report prepared for the Commission of the European Communities Enterprise Directorate General.
The impact of European firms’ economic conditions and financial
performance on accounting quality
*Cláudia P. Lopes1, António M. Cerqueira2, Elísio Brandão3
(1. Accounting School, Institute Polytechnic of Porto,S. Mamede de Infesta 4465-004, Portugal; 2, 3. Faculty
of Economics, University of Porto, Porto 4200-464, Portugal)
Abstract: In this study the authors analyse the possible effect of firms’ economic conditions and financial performance on accounting quality. Bradshaw, et al. (2004), Gelos & WEI (2005) stated that financial reporting quality is fundamental for investors and it affects international capital movements. Following Schipper & Vicent (2003), the authors estimated accounting quality by abnormal accruals and earnings persistence. The authors’ contribution consists of investigating a huge number of firms from 17 European countries using unbalanced panel data. The authors found evidence that economic conditions affect accounting quality: big firms and those with high current earnings exhibit better financial information. These results are robust because they do not depend on the accounting quality proxy, even when the authors estimated regression with economical and financial factors alone or together. Financial performance does not seem to affect accounting quality. However, this relation is not linear because in high leveraged firms, the capital structure becomes determinant.
Key words: accounting quality; abnormal accruals; firms’ economic performance; capital structure
1. Introduction
In this study the authors analyse whether European firms’ economic conditions and financial performance affect their accounting quality.
Several economic agents use financial reports in their decision-making processes. Investors decide whether to purchase a firm’s capital by analysing its financial reports because the capital market is not efficient in a strong way (Fields, et al., 2001). Financial reports are crucial even in international capital movements (Bradshaw, et al., 2004; Gelos & Wey, 2005).
Creditors decide to lend or not and they establish contractual conditions, namely interest rates, considering accounting numbers, as shown by Gopalakrishan (1994), Beatty & Weber (2003). In addition, Francis, et al. (2005) stated that poor accounting quality leads to higher costs of debt and equity.
Foster (1986) proposed that financial reporting decisions affect and are affected by other firms’ decisions.
*
Acknowledgement: The authors would like to thank Francisco Vitorino Martins from Faculdade de Economia da Universidade do
Porto for his suggestions. The authors appreciate comments from Chihchien Chiu discussant at the Fifty-Eighth Annual Meeting of the Midwest Finance Association. The authors also gratefully acknowledge the financial support from the Instituto Superior de Contabilidade e Administração do Porto and from Fundação para a Ciência e Tecnologia.
Claudia Lopes, assistant professor, Accounting School, Institute Polytechnic of Porto; research fields: financial accounting, corporate finance.
Antonio Cerqueira, associate professor, Faculty of Economics, University of Porto; research fields: corporate finance, financial markets and information.
Accountants face a trade-off between relevance and reliability of the accounting measurement. Richardson, et al. (2005) were concerned about the reliability.
Therefore, intensive research has been done to investigate what factors affect earnings quality. Fields, et al. (2001) stated that financial information would be more accurate if investors understood managers’ motivations and their influence on a firm’s performance. These authors emphasized the importance of regulating managers’ behaviour, but noted the impossibility of eliminating the existence of accounting choices.
Although many studies have been developed, the impact of firms’ size and performance on accounting quality is not consensual. Gopalakrishnan (1994) find that to avoid political costs firms above a certain size made income-decreasing choices. However, Demerjian, et al. (2006) & Bradshaw, et al. (2004) concluded that huge American firms and those with good a performance are pressured to improve their accounting quality. By contrast, Astami & Tower (2006) found evidence that size was not significant in accounting choice for Asian countries.
In regards to the financial performance, the results of previous studies indicated a negative relation between leverage and the quality of financial reports. Beatty & Weber (2003) stated that managers are more likely to make income-increasing accounting choices when debt-contracting calculations are affected. Gopalakrishnan’s (1994) results indicate that accounting policies are defined in order to avoid debt covenant constraints.
This work adds to prior research the relevance of firm’s economic conditions and financial performance to explain the accounting quality for a large sample of European countries (17) and industries (40) using unbalanced panel data. This is an important contribution, especially given the conflicting evidence regarding the economic influence on accounting quality in non-European countries. In addition, the authors investigate whether those factors are significant, or not, regardless of the way accounting quality is estimated.
Several methodologies have been developed to investigate earnings quality:
(1) Accounting choice followed by Bradshaw, et al. (2004), Astami & Tower (2006) using conformity ratio