October 2010
Consumers’ confidence towards economic condition in October
2010 regained as CCI scaled up by 4.4 points to 112.0. Enhancing
consumer confidence was boosted by higher consumers’
expectation index particularly on economic condition and job
availability over the next 6 months.
On the other hand, consumers considered that inflation pressure
in the next 3 months will decelerate. Price pressures were
predicted to move higher in the next 6 months especially on
foodstuff, clothing, beverages, cigarette and tobacco.
Consumer Confidence Index
Consumer confidence over economic condition continued to
stay at the highly favorable level in October 2010
as
the Consumer
Confidence Index (CCI) escalated 4.4 points to the level of 112.0. The
ascending CCI was attributed by consumer’s wide perception on current
economic condition and the expectation for the next 6 months as the index
grew by 3.6 and 5.3 points respectively.
Graph 1. Consumer Confidence Index
60.0
70.0
80.0
90.0
100.0
110.0
120.0
130.0
140.0
1 2 3 4 5 6 7 8 9 10 11 12 1 2 3 4 5 6 7 8 9 10 11 12 1 2 3 4 5 6 7 8 9 10
2008 2009 2010
(Index)
Current Economic Condition Index
Consumer Expectation Index
Consumer Confidence Index
Optimistic
Pessimistic
Fuels Hike
Global Economic
Crisis
CONSUMER SURVEY
Consumer Confidence Index
moved higher
Methodology
Consumer Survey-Bank Indonesia (CS-BI) is a monthly survey that has been conducted since October 1999. Since January
2007, the survey is done to more or less 4,600 households as respondents
(stratified
random sampling)
in 18 cities: Jakarta, Bandung,
This month’s survey showed that consumers’ optimism over both
current and next 6 months job availability was rose significantly. Moreover,
strengthening expectations on income and saving in the next 6 months has
lifted consumers’ optimism over economic condition in 6 months ahead.
In annual basis, consumer showed a wider confidence over
economic condition.
The CCI in this reporting month mounted by 2.0 points
against the same period in previous year. The upward index was due to
vigorous consumers’ optimism on spending durable goods and wider job
availability.
Current Economic Condition Index
Respondents were more optimistic over current economic
condition.
Higher respondents’ optimism was revealed on Current Economic
Condition Index (CECI) which climbs 3.6 points to the level of 100.7 over
previous month.
Graph 2. Current Economic Condition Index (CECI
0.0 20.0 40.0 60.0 80.0 100.0 120.0 140.0
1 2 3 4 5 6 7 8 9 10 11 12 1 2 3 4 5 6 7 8 9 10 11 12 1 2 3 4 5 6 7 8 9 10
2008 2009 2010
Index
Current Economic Conditions Index Current Incomes Buying Durable Goods Conditions Job Availability
This period survey also confirmed that all current economic indicators
posted escalation. Improved on saving and reduced prices pressure after Eid ul
Fitr celebration stimulate consumers intention to consume durable goods.
Consumers also acknowledged that job availability was spread out as many
disclosure civil officer job vacancies in certain government institution.
Consumer’s perception on
Compared to the same period in the previous year, consumers stated
that economic condition expanded, as showed by higher consumers’ appetite
to buy durable goods as well as considerable job availability.
Consumer Expectation Index
Consumers had more confident toward the prospect for
economic condition over the next 6 months.
Stronger consumers’
optimism was emphasized on Consumer Expectation Index (CEI) which
advanced 5.3 points to 123.4 over previous month.
Enhancing CEI was encouraged by strengthening consumer’s optimism
on job availability in the next 6 months following the better expectation on 6
months ahead economic prospect. The higher optimism on the prospect of
economic condition was triggered by consumers who have post-graduated
and get more than Rp 5 million income per month.
Graph. 3 Consumer Expectation Index (CEI)
0.0 20.0 40.0 60.0 80.0 100.0 120.0 140.0 160.0
1 2 3 4 5 6 7 8 9 10 11 12 1 2 3 4 5 6 7 8 9 10 11 12 1 2 3 4 5 6 7 8 9 10
2008 2009 2010
Index
Consumer Expectation Index Incomes Expectation Economic Expectation Job Availability Expectation
Meanwhile, in annual, CEI laid at 123.4, slightly increase from 123.2 in
previous. Increasing optimism encountered on job availability and income
expectation index by 3.5 and 2.7 points respectively. On the other side,
economic condition expectation decelerated by 5.7 points.
Income Expectations
Consumers also more optimistic over their income in the next 6
months.
The optimism was seen on income expectation index which
increased 3.6 points to 140.0. The survey also noted that respondents with
Respondent’s more optimistic
over condition in the next 6
months
expenditure above Rp 5 million per month showed the stronger optimism
towards income in the next 6 months.
Price Expectations
Respondents believed that inflationary pressures will soften in the
3 months ahead.
The survey revealed that price expectation index in the next
3 months edged down by 4.6 points. Respondents believed that diminishing
pressure on prices in the next 3 months will occurred on all good/service groups,
primarily on clothing & transport, and communication & financial services each
by 5.6 and 5.4 points.
Meanwhile, pressure on prices in the next 6 months
predicted to
increase
with the highest increase primarily on food and clothing, beverages,
cigarette and tobacco groups.
Graph 4. Price Expectation Index for the next 3 and 6 months
‐
1.00
0.00
1.00
2.00
3.00
4.00
5.00
6.00
130.0
140.0
150.0
160.0
170.0
180.0
190.0
200.0
1 2 3 4 5 6 7 8 9 101112 1 2 3 4 5 6 7 8 9 101112 1 2 3 4 5 6 7 8 9 101112 1 2 3 4
2008
2009
2010
2011
Price
Expectation
Index
3
months
ahead
Price
Expectation
Index
6
months
ahead
Cummulative
Inflations
in
3
months
Index
Notes
: Index = 100 indicates that consumer expect prices will still be stable, index > 100 indicates
consumer expect prices will increase, and index < 100 indicates consumer expect prices will decrease
Expectations of Savings and Interest Rates
In line with the rising on saving interest rate in the next 6
months, consumers show a higher optimistic on saving amount in the
next 6 months.
The survey revealed that saving interest rate expectation in
the next 6 months will go up by 5.7 point to the level of 125.0. However, in
line with higher consumers’ income, respondents optimistic that their saving
will arise as shown by the mounting index by 6.0 points over previous month.
Pressure on prices in the
next 3 months slowing
down, while prices
predicted to move higher
in the next 6 months
Graph. 5
Expectation Indexes on Interest Rates and Total Savings in the next 6 months
0
5
10
15
20
25
90
100
110
120
130
140
1 2 3 4 5 6 7 8 9 101112 1 2 3 4 5 6 7 8 9 101112 1 2 3 4 5 6 7 8 9 101112 1 2 3 4
2008
2009
2010
2011
Savings
Growth
in
6
months
Interest
Rates
Expectation
Index
in
6
months
ahead
Savings
Expectation
Index
in
6
months
ahead
Index
(%)
Notes
: Index = 100 indicates that consumer expect saving deposit and interest rate will still be
stable, index > 100 indicates consumer expect saving deposit and interest rate will increase, and
index < 100 indicates consumer expect saving deposit and interest rate will decrease
Expectations on Economic Conditions
Respondents had greater confidence toward the economic
condition over the next 6 months.
The optimism was revealed on rising
index measuring sentiment on future economic condition in October 2010 that
edged up by 5.5 points to the level of 121.6. Higher optimism was mainly
shown by respondent who has post-graduated educational background.
Optimism on future
Table 1. Consumer Confidence, Price Expectations, Consumption Plans, and Economic Indicators (Index)
Sep Oct Nov Dec Jan Feb Mar Apr May Jun Jul Aug Sep Oct
A Consumer Confidence Index (CCI) 110.8 110.0 111.0 108.7 110.5 105.3 107.4 110.7 109.9 111.4 105.7 104.0 107.6 112.0 Present Situation (CECI) 96.6 96.8 97.7 96.7 98.4 94.7 96.4 99.6 100.0 101.5 96.1 93.3 97.1 100.7
Expectations (CEI) 125.1 123.2 124.3 120.7 122.6 115.9 118.5 121.7 119.8 121.3 115.3 114.8 118.1 123.4
Appraisal of Present Situation
Current Incomes 124.0 124.9 124.1 123.1 125.5 118.6 121.7 126.1 124.4 126.2 120.6 117.7 121.6 122.7
Buying durable goods Conditions 81.3 82.2 84.9 81.1 85.2 87.3 85.3 87.5 89.6 91.4 86.9 80.5 85.8 91.0
Employment Conditions 84.5 83.2 84.1 85.8 84.5 78.0 82.1 85.3 85.9 86.8 80.9 81.7 83.8 88.3
(before Oct 2004: Unemployment Condition)
Expectations for 6 Months Hence of
Incomes 138.5 137.3 139.3 136.8 141.1 132.5 135.3 136.7 134.7 137.4 132.6 133.6 136.4 140.0
Economic Conditions 130.4 127.3 128.8 122.1 122.7 114.4 117.7 122.2 119.5 122.3 112.6 110.0 116.1 121.6
Employment Conditions 106.4 105.1 104.8 103.1 103.9 100.8 102.4 106.3 105.2 104.2 100.7 100.7 101.7 108.6
(before Oct 2004: Unemployment Expectation)
B Price Expectations for 3 Months Hence of
Prices 165.2 158.8 159.9 161.0 160.6 160.2 155.1 158.6 164.3 166.8 180.5 175.4 167.6 163.0
Foodstuff 167.0 160.8 160.6 163.0 163.5 163.4 156.0 159.6 164.2 167.8 181.1 177.2 168.7 164.9
Food, beverages, cigarettes and tobacco 161.0 154.9 155.8 157.2 156.4 155.0 149.9 153.5 156.5 160.2 170.5 170.2 161.7 157.7
Housing, electricity, gas and fuel 155.2 156.0 156.6 156.3 152.0 151.5 148.1 155.3 158.1 161.2 175.0 167.8 160.7 156.2
Clothing 150.2 138.6 139.3 138.0 135.5 136.4 131.2 133.7 142.1 148.9 155.9 156.3 145.9 140.3
Health 140.6 135.4 136.6 137.9 135.9 136.1 133.9 133.6 138.8 141.0 146.6 146.0 140.2 138.5
Transportations, communications and financial services 146.9 142.6 142.2 141.4 137.5 137.9 134.3 136.4 142.0 149.7 157.4 155.6 150.5 145.1
Education, recreation, and sports 141.3 137.3 139.0 140.0 138.0 137.2 138.2 141.4 145.9 149.4 154.9 151.0 143.0 139.5
C Price Expectations for 6 Months Hence of
Prices 156.9 156.2 157.9 158.8 161.2 164.3 161.1 159.3 162.5 163.2 170.1 161.5 156.9 159.1
Foodstuff 158.2 158.4 158.4 160.5 162.1 166.0 161.7 160.5 163.0 164.1 170.9 162.5 157.7 160.6
Food, beverages, cigarettes and tobacco 153.4 154.3 154.4 154.9 156.9 158.9 156.7 154.5 158.0 158.0 163.5 157.9 153.1 154.9
Housing, electricity, gas and fuel 150.8 154.3 155.7 155.4 153.2 153.1 148.6 154.1 157.3 157.3 165.8 156.0 153.1 154.8
Clothing 141.7 137.4 140.5 139.9 140.1 144.4 143.1 140.3 145.2 147.2 148.3 145.2 139.4 139.9
Health 140.2 136.7 138.1 138.9 140.0 140.8 136.7 137.2 139.1 141.2 146.4 139.2 138.9 139.3
Transportations, communications and financial services 143.4 143.9 142.6 143.9 142.8 145.5 143.6 144.9 147.3 148.3 152.9 147.9 143.7 145.4
Education, recreation, and sports 141.0 138.6 143.1 144.7 146.2 147.7 145.3 144.2 146.1 146.1 150.8 144.2 141.9 142.0
D Economic Indicator within 6 Months
Avaibility of Goods & Services 138.6 136.4 132.7 133.5 138.3 134.2 135.5 137.6 138.7 141.6 140.0 136.4 135.2 138.1
Interest Rate 115.2 113.3 115.4 116.3 117.9 114.9 117.0 116.2 117.1 117.7 117.9 119.8 119.3 125.0
Current savings 104.4 104.7 106.6 105.9 106.4 105.2 106.9 105.0 105.8 106.5 103.7 103.0 106.1 108.6
Savings for 6 months hence 125.0 125.9 128.2 126.7 129.8 125.6 126.2 127.0 125.0 127.2 124.3 123.0 126.0 132.0
2010
Descriptions 2009
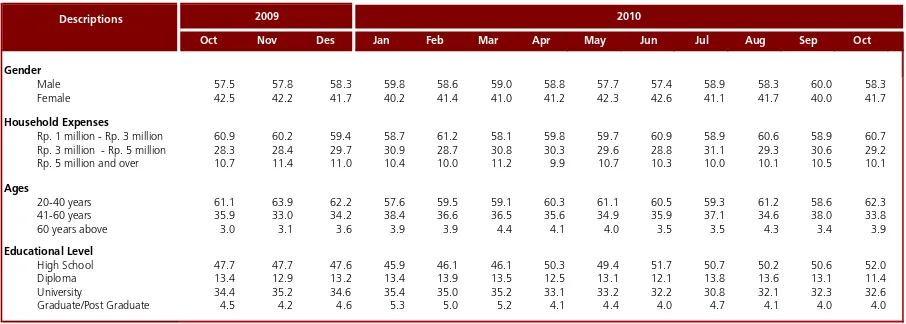
Table 2. Respondent Figures (percentages)
Oct Nov Des Jan Feb Mar Apr May Jun Jul Aug Sep Oct
Gender
Male 57.5 57.8 58.3 59.8 58.6 59.0 58.8 57.7 57.4 58.9 58.3 60.0 58.3 Female 42.5 42.2 41.7 40.2 41.4 41.0 41.2 42.3 42.6 41.1 41.7 40.0 41.7
Household Expenses
Rp. 1 million - Rp. 3 million 60.9 60.2 59.4 58.7 61.2 58.1 59.8 59.7 60.9 58.9 60.6 58.9 60.7 Rp. 3 million - Rp. 5 million 28.3 28.4 29.7 30.9 28.7 30.8 30.3 29.6 28.8 31.1 29.3 30.6 29.2 Rp. 5 million and over 10.7 11.4 11.0 10.4 10.0 11.2 9.9 10.7 10.3 10.0 10.1 10.5 10.1 Ages
20-40 years 61.1 63.9 62.2 57.6 59.5 59.1 60.3 61.1 60.5 59.3 61.2 58.6 62.3 41-60 years 35.9 33.0 34.2 38.4 36.6 36.5 35.6 34.9 35.9 37.1 34.6 38.0 33.8 60 years above 3.0 3.1 3.6 3.9 3.9 4.4 4.1 4.0 3.5 3.5 4.3 3.4 3.9 Educational Level
High School 47.7 47.7 47.6 45.9 46.1 46.1 50.3 49.4 51.7 50.7 50.2 50.6 52.0 Diploma 13.4 12.9 13.2 13.4 13.9 13.5 12.5 13.1 12.1 13.8 13.6 13.1 11.4 University 34.4 35.2 34.6 35.4 35.0 35.2 33.1 33.2 32.2 30.8 32.1 32.3 32.6 Graduate/Post Graduate 4.5 4.2 4.6 5.3 5.0 5.2 4.1 4.4 4.0 4.7 4.1 4.0 4.0
2009 2010
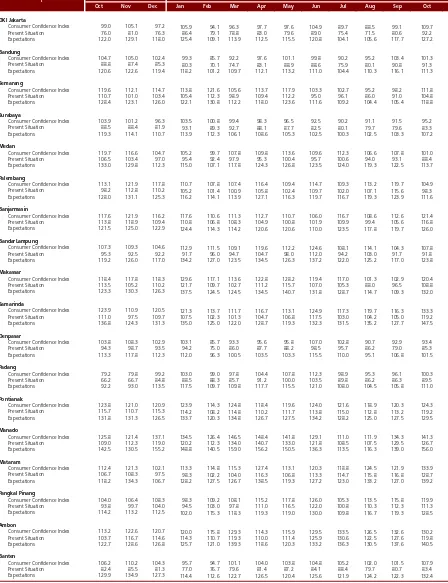
Table 3. Consumer Confidence by Region (Index)
Oct Nov Dec Jan Feb Mar Apr May Jun Jul Aug Sep Oct
DKI Jakarta
Consumer Confidence Index 99.0 105.1 97.2 105.9 94.1 96.3 97.7 97.6 104.9 89.7 88.5 99.1 109.7
Present Situation 76.0 81.0 76.3 86.4 79.1 78.8 83.0 79.6 89.0 75.4 71.5 80.6 92.2
Expectations 122.0 129.1 118.0 125.4 109.1 113.9 112.5 115.5 120.8 104.1 105.6 117.7 127.2
Bandung
Consumer Confidence Index 104.7 105.0 102.4 99.3 85.7 92.2 97.6 101.1 99.8 90.2 95.2 103.4 101.3
Present Situation 88.8 87.4 85.3 80.3 70.1 74.7 83.1 88.9 88.6 75.9 80.1 90.8 91.3
Expectations 120.6 122.6 119.4 118.2 101.2 109.7 112.1 113.2 111.0 104.4 110.3 116.1 111.3 Semarang
Consumer Confidence Index 119.6 112.1 114.7 113.8 121.6 105.6 113.7 117.9 103.3 102.7 95.2 98.2 111.8 Present Situation 110.7 101.0 103.4 105.4 112.3 98.9 109.4 112.2 95.0 96.1 86.0 91.0 104.8 Expectations 128.4 123.1 126.0 122.1 130.8 112.2 118.0 123.6 111.6 109.2 104.4 105.4 118.8
Surabaya
Consumer Confidence Index 103.9 101.2 96.3 103.5 100.8 99.4 98.3 96.5 92.5 90.2 91.1 91.5 95.2
Present Situation 88.5 88.4 81.9 93.1 89.3 92.7 88.1 87.7 82.5 80.1 79.7 79.6 83.3
Expectations 119.3 114.1 110.7 113.9 112.3 106.1 108.6 105.3 102.5 100.3 102.5 103.3 107.2
Medan
Consumer Confidence Index 119.7 116.6 104.7 105.2 99.7 107.8 109.8 113.6 109.6 112.3 106.6 107.8 101.0 Present Situation 106.5 103.4 97.0 95.4 92.4 97.9 95.3 100.4 95.7 100.6 94.0 93.1 88.4 Expectations 133.0 129.8 112.3 115.0 107.1 117.8 124.3 126.8 123.5 124.0 119.3 122.5 113.7 Palembang
Consumer Confidence Index 113.1 121.9 117.8 110.7 107.8 107.4 116.4 109.4 114.7 109.3 113.2 119.7 104.9 Present Situation 98.2 112.8 110.2 105.2 101.4 100.9 105.8 102.4 109.7 102.0 107.1 115.6 98.3 Expectations 128.0 131.1 125.3 116.2 114.1 113.9 127.1 116.3 119.7 116.7 119.3 123.9 111.6
Banjarmasin
Consumer Confidence Index 117.6 121.9 116.2 117.6 110.6 111.3 112.7 110.7 106.0 116.7 108.6 112.6 121.4 Present Situation 113.8 118.9 109.4 110.8 106.8 108.3 104.9 100.8 101.9 109.9 99.4 105.6 116.8 Expectations 121.5 125.0 122.9 124.4 114.3 114.2 120.6 120.6 110.0 123.5 117.8 119.7 126.0
BandarLampung
Consumer Confidence Index 107.3 109.3 104.6 112.9 111.5 109.1 119.6 112.2 124.6 108.1 114.1 104.3 107.8 Present Situation 95.3 92.5 92.2 91.7 96.0 94.7 104.7 98.0 112.0 94.2 103.0 91.7 91.8 Expectations 119.2 126.0 117.0 134.2 127.0 123.5 134.5 126.3 137.2 122.0 125.2 117.0 123.8 Makassar
Consumer Confidence Index 118.4 117.8 118.3 129.6 117.1 113.6 122.8 128.2 119.4 117.0 101.3 102.9 120.4 Present Situation 113.5 105.2 110.2 121.7 109.7 102.7 111.2 115.7 107.0 105.3 88.0 96.5 108.8 Expectations 123.3 130.3 126.3 137.5 124.5 124.5 134.5 140.7 131.8 128.7 114.7 109.3 132.0
Samarinda
Consumer Confidence Index 123.9 110.9 120.5 121.3 113.7 111.7 116.7 113.1 124.9 117.3 119.7 116.3 133.3 Present Situation 111.0 97.5 109.7 107.5 102.3 101.3 104.7 106.8 117.5 103.0 104.2 105.0 119.2 Expectations 136.8 124.3 131.3 135.0 125.0 122.0 128.7 119.3 132.3 131.5 135.2 127.7 147.5
Denpasar
Consumer Confidence Index 103.8 108.3 102.9 103.1 85.7 93.3 95.6 95.8 107.0 102.8 90.7 92.9 93.4
Present Situation 94.3 98.7 93.5 94.2 75.0 86.0 87.7 88.2 98.5 95.7 86.2 79.0 85.3
Expectations 113.3 117.8 112.3 112.0 96.3 100.5 103.5 103.3 115.5 110.0 95.1 106.8 101.5 Padang
Consumer Confidence Index 79.2 79.8 99.2 103.0 99.0 97.8 104.4 107.8 112.3 98.9 95.3 96.1 100.3 Present Situation 66.2 66.7 84.8 88.5 88.3 85.7 91.2 100.0 103.5 89.8 86.2 86.3 89.5 Expectations 92.2 93.0 113.5 117.5 109.7 109.8 117.7 115.5 121.0 108.0 104.5 105.8 111.0
Pontianak
Consumer Confidence Index 123.8 121.0 120.9 123.9 114.3 124.8 118.4 119.6 124.0 121.6 118.9 120.3 124.3 Present Situation 115.7 110.7 115.3 114.2 108.2 114.8 110.2 111.7 113.8 115.0 112.8 113.2 119.2 Expectations 131.8 131.3 126.5 133.7 120.3 134.8 126.7 127.5 134.2 128.2 125.0 127.5 129.5
Manado
Consumer Confidence Index 125.8 121.4 137.1 134.5 126.4 146.5 148.4 141.8 129.1 111.0 111.9 134.3 141.3 Present Situation 109.0 112.3 119.0 120.2 112.3 134.0 140.7 133.0 121.8 108.5 107.5 129.5 126.7 Expectations 142.5 130.5 155.2 148.8 140.5 159.0 156.2 150.5 136.3 113.5 116.3 139.0 156.0 Mataram
Consumer Confidence Index 112.4 121.3 102.1 113.3 114.8 115.3 127.4 113.1 120.3 118.8 124.5 121.9 133.9 Present Situation 106.7 108.3 97.5 98.3 102.2 104.0 116.3 106.8 113.3 114.7 115.8 116.8 128.7 Expectations 118.2 134.3 106.7 128.2 127.5 126.7 138.5 119.3 127.2 123.0 133.2 127.0 139.2
Pangkal Pinang
Consumer Confidence Index 104.0 106.4 108.3 98.3 109.2 108.1 115.2 117.8 126.0 105.3 113.5 115.8 119.9 Present Situation 93.8 99.7 104.0 94.5 103.0 97.8 111.0 116.5 122.0 100.8 110.3 112.3 111.3 Expectations 114.2 113.2 112.5 102.0 115.3 118.3 119.3 119.0 130.0 109.8 116.7 119.3 128.5
Ambon
Consumer Confidence Index 113.2 122.6 120.7 120.0 115.8 129.3 114.3 115.9 129.5 133.5 126.5 132.6 130.2 Present Situation 103.7 116.7 114.6 114.3 110.7 119.3 110.0 111.4 125.9 130.6 122.5 127.6 119.8 Expectations 122.7 128.6 126.8 125.7 121.0 139.3 118.6 120.3 133.2 136.3 130.5 137.6 140.5
Banten
Consumer Confidence Index 106.2 110.2 104.3 95.7 94.7 101.1 104.0 103.8 104.8 105.2 102.0 101.5 107.9
Present Situation 82.4 85.5 81.3 77.0 76.7 79.6 81.4 87.2 84.1 88.4 79.7 80.7 83.4
Expectations 129.9 134.9 127.3 114.4 112.6 122.7 126.5 120.4 125.6 121.9 124.2 122.3 132.4 2010