KINETIC ALGORITHMS FOR HARBOUR MANAGEMENT
Christopher M. Golda, Rafal I. Goralskib,
a
Professor Emeritus, University of Glamorgan, UK; Visiting Professor, Faculty of Geoinformation and Real Estate, Universiti Teknologi Malaysia, 81310 Skudai, Johor, Malaysia; Visiting Professor, Faculty of Geosciences and Environmental Engineering,
SW Jiaotong University, 111 North 1stSection, 2ndRing Road, Chengdu, Sichuan, China 610031. b
GeoVS Limited, CBTC, Senghennydd Road, Cardiff, CF24 4AY, UK Email: [email protected]; [email protected]
Commission II, Working Group II/5
KEY WORDS:Marine; Navigation; Algorithms; Data Structures; Decision Support; Graphics; Real-time; Three-dimensional
ABSTRACT:
Modern harbour management for a busy port needs to resolve a variety of simultaneous problems. Harbour traffic may be busy and the waterways congested, both by the major shipping and by the attendant harbour tugs. The harbour channel may be narrow and tortuous, and rapidly changing tides may require frequent course adjustments. Navigation aids must be clearly specified and immediately identifiable, in order to permit safe passage for the vessels. This requires a GIS with attributes not easily available with traditional products.
The GeoVS system is a kinetic GIS with full three-dimensional visualisation, so that ships, bathymetry and landscape may be viewed in a form that is immediately understandable to both harbour pilots and the harbour authority. The system is kinetic because the data structures used to preserve the topological relationships between ships, seafloor and coastline are able to be maintained on a real-time basis, taking account of ship movement recorded on the compulsory AIS (Automatic Information System) beacons. Maintenance of this real-time topology allows for easy detection of potential collisions, as well as real-time bathymetric estimations, necessary to prevent ship grounding in highly tidal environments. The system, based on previous research into kinetic Voronoi diagrams, as well as development of a completely new graphical engine, is now in commercial production, where its advantages over simpler two-dimensional models without automatic collision and grounding detection are becoming evident. Other applications are readily envisaged, and will be addressed in the near future.
1. INTRODUCTION: THE PROBLEMS OF HARBOUR MANAGEMENT
Marine safety is becoming more and more important with the constant growth of sea shipping together with the growth of other vessel categories. A gradually growing number of cargo ships that carry hazardous loads make possible collisions and groundings of sea vessels a serious threat to the environment, as well as to the life and health of the people and animals inhabiting coastal zones. The disaster, and damage caused in the event of a major sea collision can be very difficult and costly to deal with. Apart from the environment this has a huge impact on the world economy where the cost of shipping, clearly related to the level of safety, is a big factor.
Knowing about the importance of the problem the world sea authorities have introduced many standards and new technologies like ECDIS (Electronic Chart Display and Information System) and AIS (Automatic Information System) (IMO, 2004). However we still see a lot of points in the marine safety management process where improvements can be introduced. These include bathymetry data collection and processing, nautical chart production, providing navigation aid software on board ships, and vessel traffic planning, analysis and monitoring, as well as improving the level of training accessible for mariners and pleasure boat owners. Ford (2002) demonstrated the idea of 3D navigational charts and concluded that 3D visualization of chart data had the potential to be an information decision support tool for reducing vessel navigational risks. Wright (1999) gives a history of these efforts, and Wright and Goodchild (1997) and Li and Saxena (1993) describe various advances: none of these take advantage of recent developments in fast 3D computer graphics. Our
intention was to adapt IHO (International Hydrographic Office) S-57 Standard Electronic Navigation Charts (IHB, 2000, 2001) for 3D visualization. S-57 charts are vector-based 2D charts that conform to the requirements for the chart databases for ECDIS, with standardized content, structure and format, issued on the authority of government authorized hydrographic offices and that also conform to IHO (International Hydrographic Organization) specifications.
To address these needs we have developed a new type of special GIS software, based on kinetic 2- or 3-dimensional data structures, a sophisticated 3D visualization engine, and intelligent navigation rule libraries. In collaboration with the Ecole navale, Brest, an interface was developed between the shipboard AIS, which integrates GPS (Global Positioning System) positioning together with the reception of information from other ships concerning their position, course and other properties (Stroh and Schuldt, 2006). This involves careful multi-threading to manage the real-time inputs and processing. The results are easily used within the system, as ship locations are readily updated in the graphics model, and for the kinetic collision-detection tools employed. The software created allows for real-time tracking and recording of the AIS data, as well as for its later playback for test and simulation purposes. Several safety features related to the AIS specifically were implemented and tested.
2. SYSTEM OBJECTIVES
An important aspect of maritime safety involves visualisation of the situation close to any particular ship, so that appropriate action may be taken. While many features may be seen directly from the bridge in good conditions, bad lighting and weather may obscure them, and much of the necessary information concerns maritime control, and is only available on charts or in pilot books.
It seems clear that an integration of all these components within a single simple view would improve maritime safety – although it is not obvious how best this should be done. While a heads-up display – a “Mobile Augmented Virtual Reality” – might be ideal, it is not yet practical for most shipping. However, a sufficiently-good integrated computer display, if it could mimic the real view from the bridge, could be developed at moderate cost and should be sufficiently straightforward to match with the real world while adding those extra features necessary for navigation.
Several components were required for such a system. Firstly, an appropriate 3D graphics view of the surrounding land- and seascape is needed. The main tools for this are now readily available: modern 3D graphics cards, languages and algorithms, developed for the games or engineering industries, and a small laptop PC may now be sufficiently powerful. Existing games engines, however, do not usually provide the level of topological connectivity needed for navigation and collision detection, nor the desired link to a cartographic database. We therefore needed to write our own, using a basic scene-graph structure.
Secondly, we needed to populate this engine with the terrain, landscape, buildings and ships appropriate to the geographic location. Thirdly, bathymetry was modelled directly from samples of survey soundings, giving a triangulated terrain model of the sea floor. This is not normally visible on-board ship, and it is not directly shown on the computer view – partly because it has no legal validity for navigation, and partly because it often conflicts with the generalized chart information. It was of particular value because the terrain model could be updated in real time, taking account of the latest data. Its primary use was for the real-time interpolation of the depth of water below each of the ships in the display – especially the “active” ship with the current view from the bridge.
However, as a fourth component we needed to be able to insert specific navigational objects into our model – examples are buoys and lighthouses. These (like ship models) were developed separately with modelling software and placed at the appropriate locations on the land- or seascape. The OpenGL graphics language permitted the modelling of cameras (views) and lights in the same way as visible objects. This, in conjunction with the scene graph model of transformation hierarchies, permitted the insertion of lights within lighthouses, cameras on the bridge, and even the simulation of lighthouse beams. An additional aspect was the integration of a simple database for instances of these objects, so that a simple mouse click could request the properties of the selected object. This was appropriate for ship, lighthouse and chart information, among others.
Fifthly, chart information was obtained from ECDIS data, and new techniques were needed in order to view this 2D information in a 3D display. Rights-of-way, anchorages, restricted zones etc. were drawn on the sea surface, and this
appeared to be comprehensible and effective. More problematical was the display of chart contours – while these could be drawn on the surface they obviously referred to the sea-floor terrain model, but as this model was derived directly from soundings the chart contours would rarely match the model precisely, and were taken as indicative of navigation warnings. We therefore left them drawn on the sea surface. Stages One to Five above were implemented in prototype form as mentioned in Gold et al. (2004) and the issues of marine 3D cartography were described in Gold and Goralski (2007).
Sixthly, it was quite feasible to provide updates to the model, via radio, similar to the “Notice to Mariners.” The most obvious cases involved the warning of wrecks, obstacles, etc. The shipboard AIS data is collected and used to give the location and characteristics of vessels within range of the system.
3. KINETIC DATA STRUCTURE REQUIREMENTS AND BENEFITS
In Stage Two we had to develop a landscape model close to the coast, in order to permit reasonable coastline silhouettes, based on the information on the marine chart. In Stage Three we added the bathymetry based on samples of the survey soundings. Shoreline points were calculated from the intersection of the triangulated terrain model with the sea surface, which may be changed at any time to simulate tides.
However, our primary objective was maritime safety – which mainly meant anticipating potential collisions between moving ships and other objects: other moving ships, stationary surface objects, and subsurface objects – primarily the sea floor. This is normally achieved by visual inspection, but clearly computational tools could be developed to show when objects are too close, by examining their topological relationships. A typical approach would use the simple point Voronoi diagram, the dual of the common Delaunay triangulation, widely used for TIN terrain models: if a triangle edge was too short then the two objects represented by the end points would be dangerously close.
An additional, and significant, benefit of the model is that the ship location on the sea surface is also used in conjunction with the TIN model of the sea floor based on the bathymetric observations. Sibson interpolation – probably the best general interpolation technique available (Dakowicz and Gold, 2002) – consists of inserting the query point into the Voronoi/Delaunay structure, then removing it, and calculating the areas that had been stolen from the neighbouring data points: these are used as weights in a weighted average calculation. These are exactly the dynamic operations described previously. Thus ship clearance is readily estimated and warnings issued if necessary. Tidal models are included in the system, where available, to assist where this is critical for ship navigation.
Figure 1. The incorporated kinetic VD for maintenance of spatial relationships and collision detection
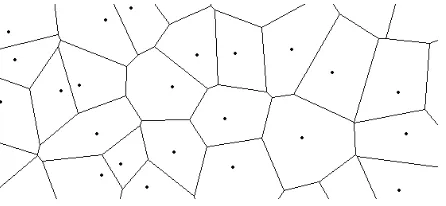
The Voronoi diagram (VD), as shown in Figure 2, and its dual, the Delaunay triangulation (DT) are fundamental geometrical constructs that are now fairly well known (Aurenhammer, 1991). For a given set of generators, the Voronoi diagram partitions the space in such a way that each generator is assigned to the points closest to it with respect to a given distance function. For reasonable classes of generators (such as points, line segments and circular arcs) and reasonable distance metrics (such as the Euclidean one) the Voronoi diagram allows a compact representation of the topology. The VD can be represented by a topological data structure such as the “Quad-Edge” (Guibas and Stolfi, 1985). It supports a multitude of proximity and nearest neighbour queries (details can be found in Okabe et al., 1992). The Voronoi diagram for points and line segments with its dual, the Delaunay graph, provides the basic spatial adjacency properties between map objects. The DT is usually used as the basis for triangulating a set of data points, as it is guaranteed to be locally stable.
Figure 2. A Simple Voronoi Diagram
The VD can be constructed in many ways (Aurenhammer, 1991), (Okabe et al., 1992), but the incremental algorithm has been found to be both stable and simple (Guibas and Stolfi, 1985). In simple terms, each new point is inserted into the existing DT by finding the enclosing triangle, using the counter clockwise (CCW) test of Guibas and Stolfi, splitting it into
three triangles using the new point, and then testing each edge recursively to see if it conforms to the Delaunay criterion: that neither of the adjacent triangles’ circumcircles (CC) have an interior point. If they do, the common diagonal is switched and the new edges are added to the stack of edges to be tested. Point deletion (Mostafavi et al., 2003), (Devillers, 1999), can be performed by approximately following the inverse process: switch DT edges if the result gives an exterior triangle whose CC is empty except for the point being deleted. When only three triangles remain the central point is deleted.
“Kinetic” data structures maintain their topological structure while the entities move; “dynamic” ones merely permit local insertion and deletion of these entities.
When a moving point (MP) moves as part of a DT/VD it may either travel a short distance without requiring a topology update, or else triangle edges must be switched to maintain the Delaunay criterion. These topological events (Roos, 1990, Guibas et al., 1991) occur when the moving point MP moves into or out of a CC. “Real” CCs are those formed from triangles immediately exterior to the “star” or set of triangles connected to MP. “Imaginary” CCs are formed by triangles that would be created if MP was moved out of its CC, and are formed by triples of adjacent points around MP’s star. When MP moves into a constellation of points in a DT it first enters the CC of a triangle, causing a triangle edge switch and adding the furthest point of the triangle to the star of MP. The original real CC is now preserved as an imaginary one. As MP continues to move, at some later time it moves out of this imaginary CC, the original triangle is recreated and the CC becomes real again.
As the moving point MP moves in any direction, it may enter or leave many CCs, and the triangle edges must be updated accordingly. Topological operators are used to extract the real CCs surrounding MP’s star, and the imaginary CCs formed by consecutive triples around MP’s star.
Real CCs are dropped if they are re-formed from the imaginary ones. (Initially, before a point is first moved, all surrounding real CCs are found and tested against the proposed trajectory.) To maintain the DT during MP’s movement it is therefore necessary only to find the intersection of its trajectory with the first CC (either real or imaginary), move MP to the intersection point, switch the affected edge, and then repeat the process (Figure 3). This looping process: find the next intersection with a CC; move MP; switch the DT edge – is continued until MP’s destination is reached. The approach is described further in Gold et al. (1999).
Figure 3 b) “Imaginary” circumcircles to MP
4. THE NEW GRAPHICAL ENGINE
The idea behind the system was based on the observation that application of a 3D view in navigational software would be a significant improvement, letting navigators assess the situation precisely in a more natural way. Graphical engines used in today’s games were great example of possibilities and it seemed clear that today’s navigational systems should take advantage of these new technologies.
However the graphical engines available on the market were optimized only for display and were not capable of maintaining spatial relationships and providing the required GIS features. Hence we had to develop our own engine, using the latest object-oriented design techniques and patterns.
The development of the graphics system was based on the Graphic Object Tree that manages the spatial relationships between graphic objects. These objects may be drawable (such as houses, boats and triangulated surfaces) or non-drawable (cameras and lights). The basis of the tree is that objects can be arranged in a hierarchy, with geometric transformations expressing the position and orientation of an object with respect to its parent – for example the position of a light in a lighthouse, or a camera on a boat (Figure 4). This was described in Gold et al. (2004).
Figure 4. The onboard view of the model
The Graphical Engine integrates multiple viewpoints and cameras, and has the capability of performing a simulation of different light and weather conditions, such as night or fog (Figure 5). An important part is the manipulation interface designed to allow simple performance of typical navigational tasks as well as comprehensive assessment of the displayed
scene. It should be noted that a variety of specifically cartographic features – here sea-lane markers and other symbols from standard nautical charts – are included in the model: the objective is not true realism, but an easily comprehensible view – a 3D chart (Gold and Goralski, 2007).
Figure 5. Night and fog simulation
5. CONCLUSIONS: THE FINAL SYSTEM
These earlier research considerations were developed as a commercial product, “C-Vu”, by GeoVS, of Cardiff, UK. At the time of writing it has had extensive trials at Milford Haven, UK, from which the following images were taken, and has created much interest among VTS operators elsewhere, because it takes the data provided by a port’s radar and AIS servers, combines it with approved ECDIS charts, and reconfigures them into a 3D format. Fig. 6 shows the scene in the Port Authority control centre.
C-Vu transforms a traditional display into a 3D panorama. Instead of featureless radar and AIS targets, vessels are depicted graphically so that tankers appear like tankers and tugs look like tugs and their relative size, drafts, locations and orientation are drawn accurately and in real time (Figs. 7 and 8). The trial is now assessing whether this clarity of presentation genuinely enhances situation awareness and ease of interpretation, as expected. Other UK ports have expressed significant interest. To the VTS operator already comfortable with interpreting AIS messages and predicting the behaviour of dots on a radar screen, a C-Vu display may look like a computer game but that is where the similarity ends. The image belies its real-time cartographic accuracy which is achieved by taking the high quality chart data that the VTS operator is already using and converting into a three dimensional image of the port and its traffic. VTS operators can then re-locate their point of view to anywhere within the port and gain an outlook normally denied them. This might be the view from the bridge of a visiting ship (Fig. 9) or from an angle that shows tugs manoeuvring more clearly. More traditional vertical views are available (Fig 10) and multi-screen views may be configured immediately as desired to observe specific situations and respond appropriately (Fig. 11).
The system will, in addition, be creating a permanent record of what is happening so any incident can be examined in detail afterwards – as clearly as if every vessel was carrying a Voyage Data Recorder. Further benefits and applications come readily to mind, and will be implemented and evaluated in the near future.
Figure 6. The system in operation at Milford Haven
Figure 7. Manoeuvring an LNG tanker
Figure 8. Turning an LNG tanker
Figure 9. A bridge view, as selected by the control operator
Figure 10. A vertical view.
Figure 11. A three-screen control display, showing different live views
REFERENCES
Aurenhammer, F., 1991. Voronoi Diagrams - A Survey of a Fundamental Geometric Data Structure. ACM Computing Surveys,23(3), pp. 345-405.
Dakowicz, M. and Gold, C.M., 2002. Extracting Meaningful Slopes from Terrain Contours.In: Sloot, P.M.A., Tan, C.J.K., Dongarra, J.J. and Hoekstra, A.G. (Eds.), Computational Science - ICCS 2002, Lecture Notes in Computer Science 2331.
Springer-Verlag Berlin Heidelberg, Amsterdam, The Netherlands, pp. 144-153.
Devillers, O., 1999. On deletion in Delaunay triangulations.In: Proceedings, 15th Annual ACM Symposium on Computational Geometry, pp. 181-188.
Ford, S.F., 2002. The first three-dimensional nautical chart.In: Wright, D.J. (Ed), Undersea with GIS, ESRI Press, Redlands, California, pp. 117-38.
Gold, C.M., 1999. An Algorithmic Approach to Marine GIS.
Geographical Information Systems, Taylor & Francis, London, pp. 37-52.
Gold C.M., Chau M., Dzieszko M., Goralski R., 2004. 3D geographic visualization: the Marine GIS. In: Fisher P (ed) Developments in Spatial Data Handling, Springer, Berlin, pp 17-28
Gold, C.M. and Condal, A. R., 1995. A Spatial Data Structure Integrating GIS and Simulation in a Marine Environment.
Journal of Marine Geodesy, 18, pp. 213-228.
Gold, C.M. and Goralski, R.I., 2007. 3D Graphics Applied to Maritime Safety. In: 3rd International Workshop on Information Fusion and Geographical Information Systems (IF&GIS-07), St. Petersburg, Russia.
Gold, C.M., Remmele, P.R. and Roos, T., 1999. Fully dynamic and kinematic Voronoi diagrams in GIS. Algorithmica (Special Issue on Cartography and GIS).
Goralski, R.I. and Gold, C.M., 2007. Maintaining the Spatial Relationships of Marine Vessels Using the Kinetic Voronoi Diagram. In: Proceedings, 4th International Symposium on Voronoi Diagrams, Pontypridd, Wales, UK, pp. 84-90.
Guibas, L., Mitchell, J.S.B. and Roos, T., 1991. Voronoi diagrams of moving points in the plane.In: Proceedings, 17th. International Workshop on Graph Theoretic Concepts in Computer Science, Fischbachau, Germany. Lecture Notes in Computer Science, v. 70,Springer-Verlag, Berlin, pp. 113-l 25.
Guibas, L. and Stolfi, J., 1985. Primitives for the manipulation of general subdivisions and the computation of Voronoi diagrams.Transactions on Graphics, 4, pp. 74-123.
International Hydrographic Bureau, 2000. IHO transfer standard for digital hydrographic data, Edition 3.0. Special publication No. 57
International Hydrographic Bureau, 2001. Regulations of the IHO for internal (INT) charts and chart specification of the IHO.
International Maritime Organization, 2004. SOLAS: International Convention of the Safety of Life at Sea, 1974 -Consolidated Edition. International Maritime Organization Publishing
Li, R. and Saxena, N. K., 1993. Development of an Integrated Marine Geographic Information System. Journal of Marine Geodesy, 16, pp. 293-307.
Mostafavi, M., Gold, C.M. and Dakowicz, M., 2003. Dynamic Voronoi/ Delaunay Methods and Applications.Computers and Geosciences, 29(4), pp. 523-530.
Okabe, A., Boots, B. and Sugihara, K., 1992. Spatial
Tessellations - Concepts and Applications of Voronoi
Diagrams. John Wiley and Sons, Chichester, 521p.
Roos, T., 1990. Voronoi Diagrams over Scenes. In: Proceedings, Second Canadian Conference on Computational Geometry, Ottawa, pp. 209-213.
Stroh, B. and Schuldt, S., 2006. Integration of an AIS transponder into the PC-based operational marine simulator 'Marine GIS' using NMEA interface/ communication protocol, Final project report. Ecole navale, Brest.
Wright, D.J., 1999. Dawn to the Sea in Ships: The Emergence of Marine GIS.In: Wright, D. J. and Bartlett, D. (Eds), Marine and Coastal Geographical Information Systems, Taylor & Francis, London, pp. 1-10.