THE LOW BACKSCATTERING TARGETS CLASSIFICATION IN URBAN AREAS
L. Shi.a, a
The State Key Laboratory of Information Engineering in Surveying, Mapping and Remote Sensing of Wuhan
University, 430079, P. R. China
[email protected]
Commission VII, WG VII /4
KEY WORDS: Polarimetric Synthetic Aperture Radar, Low Backscattering, Classification
ABSTRACT:
The Polarimetric and Interferometric Synthetic Aperture Radar (POLINSAR) is widely used in urban area nowadays. Because of the physical and geometric sensitivity, the POLINSAR is suitable for the city classification, power-lines detection, building extraction, etc. As the new X-band POLINSAR radar, the china prototype airborne system, XSAR works with high spatial resolution in azimuth (0.1m) and slant range (0.4m). In land applications, SAR image classification is a useful tool to distinguish the interesting area and obtain the target information. The bare soil, the cement road, the water and the building shadow are common scenes in the urban area. As it always exists low backscattering sign objects (LBO) with the similar scattering mechanism (all odd bounce except for shadow) in the XSAR images, classes are usually confused in Wishart-H-Alpha and Freeman-Durden methods. It is very hard to distinguish those targets only using the general information. To overcome the shortage, this paper explores an improved algorithm for LBO refined classification based on the Classification in urban areas. Firstly, the Pre-Classification is applied in the polarimetric datum and the mixture class is marked which contains LBO. Then, the polarimetric covariance matrix C3 is re-estimated on the Pre-Classification results to get more reliable results. Finally, the occurrence space which combining the entropy and the phase-diff standard deviation between HH and VV channel is used to refine the Pre-Classification results. The XSAR airborne experiments show the improved method is potential to distinguish the mixture classes in the low backscattering objects.
1. INTRODUCTION
The Synthetic Aperture Radar (SAR) is now capable of producing the high quality remote sensing image in variation weather and atmosphere conditions. The recently development new radar techniques, Polarimetric and Interferometric SAR (POLINSAR), give the multitude observers to describe the physical and geometry characteristics which used in digital elevation model (DEM) estimation, vegetation structure estimation and the target recognition, .etc (Saatchi, S., 1997; Neumann, M., 2010; Mette, T.,2004).
The land-cover classification has been widely developed by many literatures. The prevalent frameworks firstly initialize the features space to obtain the class centres; then, the Wishart Probability Density Function (PDF) memberships of each class group are measured. The general POLSAR and POLINSAR feature contain the H-Alpha, the Freeman-Durden scattering mechanisms and the optimal coherence, .etc (Freeman, A., 2007; Yamaguchi, Y., etc, 2011).
In general, the classic Wishart-H-Alpha classification method has a favourable performance in nature land-cover types and the overall accuracy is better than 80% ( Lee, J. S., 2006; Pottier, E., 2000; Hill, M. J, 2005; Freeman, A., 2007; Yamaguchi, Y., 2011; Lee, J. S., 2001; Greco, M. S., 2007). Moreover, the urban presents a little difference with the land-cover classification. The nature classification tries to distinguish the nature-cover block types. However, the scattering mechanisms of man-made area are complex and some kinds of objects show the similar scattering process. The bare soil, cement roads, the water body and the shadow of building are the common scenes in cities. The prevalent
methods, such the Wishart-H-Alpha, always confuse those low backscattering sign objects (LBO) in Figure.1.
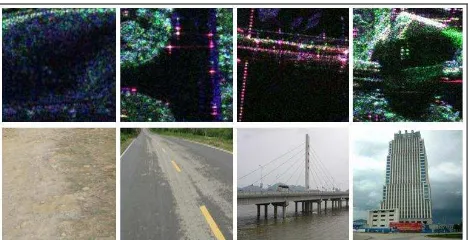
Figure 1. The typical low backscattering objects: from left to right, the bare soil, cement roads, the water and the shadow. Two reasons cause the indistinguishable phenomenon. Firstly, the low- and high-order statistical characteristics, such the backscattering cross-section (RCS) and polarimetric covariance matrix, need large look numbers to reduce the speckle. But, roads and soils usually present a narrow geographical distribution. The boxcar neighbourhood always arouses the spatial resolution loss. Furthermore, because of absenting the obvious texture, the recently popular spherically invariance random vectors (SIRV) algorithm does not represent much improvement than boxcar estimator (Hondt, O. D., 2007; Vasible, G., 2010; Formont, P., 2010). Secondly, the incident angle causes a weak backscattering power while the specular reflection dominating.
_________________________
The works are funded by The National Natural Science Fund Project (60890074), The 863 High Technology Program of ISPRS Annals of the Photogrammetry, Remote Sensing and Spatial Information Sciences, Volume I-7, 2012
The XSAR airborne radar is the dual-antenna prototype POLINSAR system. The LBO targets confusion problem also arises in the city images of XSAR. In general, the surface medium scattering process contains two scattering mechanisms: the specular reflector and the Bragg backscatter. The water polarization and the interferometer operator is necessary. 2) The rest of three low backscattering types could be subdivided by polarimetric mechanisms which combines the entropy of the polarimetric covariance matrix and the Phase Standard Deviation (PSD) of the HH/VV channel.
The paper is organised as the following structure. The section 2 discusses the sign feature of the LBO. The section 3.1 presents the refined polarimetric covariance matrix estimation based on pre-classification and the section 3.2 gives the Entropy-PSD feature to subdivide the LBO targets. The test experiments are represented in section 4. The final section mentions the conclusion.
2. THE LBO LAND-COVER FEATURE
In general, the LBO contains the bare soil, cement road, the water and the shadow of the buildings. The most common interaction between the medium and the electromagnetic wave are the specular reflector and the Bragg backscattering. The calm water shows a specular reflection causing the low back sign of radar. But, the nature water body is always influenced by the wind-drive and that induces the slight Bragg backscatter which is very similar with the rough cement road. Moreover, the bare soil obeys the Rayleigh criterion which the roughness is highly relative to the wavelength and the local incident. The Figure.2 gives the sketch of the surface scattering that the backscattering power is mainly influenced by the Bragg scattering process.
Figure 2. The surface scattering types
The specular reflection and the Bragg backscatter could be formulated by the Fresnel and the Bragg surface model respectively. The Fresnel formulation presents the horizontal (HH) and vertical (VV) polarization reflection coefficient as:
2
The HH and VV Bragg scatter coefficient (Ulaby, F. T., 1912):
2
The dielectric ratio of boundary material is given by r
and the i
means the local incident angle.Figure 3. The theoretical intensity of the Fresnel and Bragg scatter in HH and VV channels. The εr is given by 4.
Figure 4. The bare soil, the road, the water body and the building shadow in HH and VV channels of the XSAR image. In Figure.3, the theoretical function curves are plotted from the equation (1) to (4). The HH intensity of the Fresnel is always higher than the VV channel; nevertheless, the VV of Bragg is larger than the HH channel in any local incident angle. We find the inherent scattering process of various roughness surfaces could be observed by polarimetric radar. The backscattering signal of monostatic radars is more dominated by the Bragg scattering and the correlation of HH/VV channel could be used to distinguish the LBO.
The backscattering coefficients of the low backscattering targets are represented in Figure.4. Firstly, in the bare soil, the VV is larger than the HH channel and the sign is always higher than other LBO targets. That is because the soil is more dominated by the Bragg backscattering. Furthermore, the cement road could be distinguished from the water in the HH/VV channel because of the low sign randomness. Finally, the water and the shadow are always confused in both the co-polarization channel; therefore, the interferometer operator is applied to reject the shadow. There are some literatures talking about the shadow extracting from the buildings (Tison, C., 2007; Brunner, D., 2010), so, the rest of this paper will only focus on the soil/road/water.
3. THE LBO LAND-COVER CLASSIFICATION polarimetric transmission and the horizontal receiving. To characterize the nature distribution types, such as the grassland and the forest, the spatial average is needed to reduce the randomness. Then, the polarimetric covariance matrix C3 is:
* “*” means the Hermitian operator. The LBO targets are always dominated by the coherence speckle of SAR. The speckle noise level could be suppressed by the Boxcar Estimation (BE) of multi-look average in homogenous areas. The region noise-filter methods mainly contain the Intensity Driven Adaptive Neighbourhood (IDAN) (Vasible, G., 2006) and the Span Driven Adaptive Neighbourhood (SDAN) (Vasible, G., 2008). As the improvement of IDAN, SDAN performs the better stationary in complex nature environments. However, is must be applied in the Sinclair matrix. This paper proposes a region C3 re-estimation method based on the Pre-Classification and the segmentation result, named the Object Boxcar Estimation (OBE).
Figure 5. The flow chart of the refined C3 matrix by OBE In Figure.5, the confusion classes are extracted and segmented after the Wishart-H-Alpha classification method (Lee, J. S., segmentation object could retain the independence of the scattering mechanisms between LBO targets. The re-estimation step is very important to refine the C3 matrix of low scattering targets when the speckle noise at the high level.
3.2 Entropy-PSD Feature Segmentation
To discriminate the Bragg scattering and the Bragg-Specular mixture scattering, the polarimetric entropy of C3 matrix is the contrary, the zero entropy gives the determinate scattering mechanism. In Figure.6, we sample 150 pixels to get the statistics of different land-cover characteristic. The entropy of soil is low at 0.6 and the road/water entropy is high. In general, the bare soil shows a very strong Bragg backscattering which implies the low or moderate entropy value. When the cement road and the water body perform the mixture Specular-Bragg feature, the low scattering power and the system noise will cause the high entropy value.
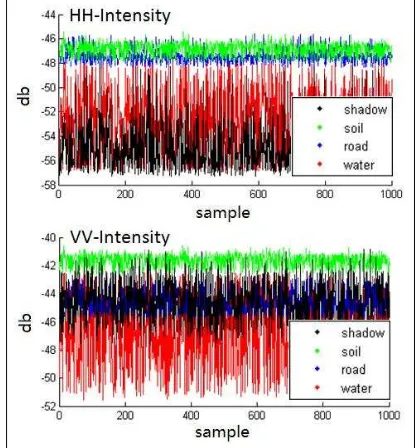
Figure 6. The entropy of 150 samples in the soil/road/water In the previous Figure.4, the water body presents a high sign randomness and the cement road is relatively steady. This paper proposes the standard deviation of the phase-difference (PSD) of the HH/VV channel. We define PSD as:
*
Figure 7. The relation between PSD and correlation value ISPRS Annals of the Photogrammetry, Remote Sensing and Spatial Information Sciences, Volume I-7, 2012
The Figure.7 shows the function relation between the PSD parameter and the correlation coefficient value. In the low correlation region, because of the low back sign and high noise of the road/water, the PSD gives the better sensitivity than the correlation parameter. In our statistical experiments, we find the sign phase of the cement road is steadier than the water. In the Figure.8, because of the phase station, the soil and the road take a low PSD; however, the water PSD value is influenced by the noise and the stochastic feature when radar imaging, that is why the water always shows high PSD.
Figure 8. The PSD of 150 samples in the soil/road/water 4. THE EXPERIMENTS OF THE LBO LAND-COVER
The XSAR is the china prototype dual-antenna POLINSAR system. There were several flight tests at the LingShui city of china from 2009 to 2010. The local ground truth was also measured when the airborne system flight.
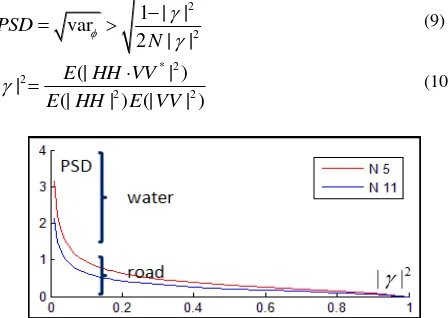
Figure 9. The dual-antennas XSAR system
The XSAR is a high-resolution (azimuth 0.1 m and slant range 0.4 m) experimental system. With 9.6 GHz frequency (X-band) and full-polarization radar, the interferometer works on dual-antennas in a 5.97 m baseline (in the Figure.9). There are already several public literatures about the XSAR system, such the calibration accuracy, the image registration and the classification precise, etc (Li, P. X, 2011; Shi, L, 2011). This paper gives two test suits of XSAR system in LingShui city; the experiment images are calibrated and the absolute amplitude is unified by the trihedral corner reflector.
4.1 Test site A
The Figure.10 represents the XSAR image which is processed by the Refined-Lee filter. The blue/green/red image
channel associates to the HH+VV/HH-VV/HV. The Pre-Classification is implemented by the Wishart-H-Alpha algorithm in the Figure.11. Comparing with the ground truth map Figure.10, the cement highway (1), the pond (2), the soil (3), the schoolyard (4), the shadow of buildings (5) and the basketball playground (6) are all confused in class 7 (the blue class in the Figure.11). Those land-cover types are also at low backscattering sign level in the Figure.10. Comparing to the other brightness targets, the Wishart PDF could not distinguish the intrinsic different of the LBO targets.
Figure 10. The PAULIRGB image of the XSAR and the corresponding ground truth
Figure 11. The classification result of Wishart-H-Alpha
Figure 12. The normalized Entropy-PSD feature segmentation ISPRS Annals of the Photogrammetry, Remote Sensing and Spatial Information Sciences, Volume I-7, 2012
When the C3 matrix is re-estimated in homogeneous areas by the OBE, the entropy and PSD parameters are calculated at large looks. The Figure.12 displays the Entropy-PSD feature and the colour bar is the unified histogram of the mixture class. The feature gives the clear boundary of the different class. In general, the water always presents the wide PSD range; that is because the water is a mixture of the Specular-Bragg and the low signal-noise-ratio (SNR) is also empoisoned by the system noise when the radar imaging. Then, the PSD of the water shows unsteady phase statistical feature. The feature of Entropy-PSD could be subdivided by a threshold.
Figure 13. The classification result of the mixture land-cover
Table 1. The classification accuracy of the mixture land-cover, UA is the user accuracy and PA means the producer accuracy The final refined mixture land-cover classification result is given in the Figure.13 and the relative quantitative evaluation is also displayed in the table.1. Obviously, the mixture classes of the Figure.11 are distinguished clearly. Because the schoolyard is made by the roughness plastic and the strong Bragg backscattering is same with the real bare soil, they are labelled as the same. We also find the cement highway and the cement basketball ground is very similar because of the same material. The producer accuracy is slight higher than the user accuracy. The final overall accuracy is 82.8% and the Kappa coefficient is better than 0.72. The improvement method shows a nice improvement in the mixture land-cover types which can not be differentiated by the general algorithm.
4.2 Test site B
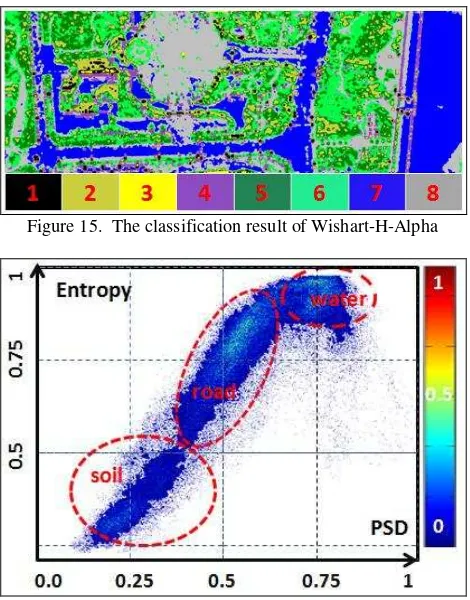
Furthermore, we give the other test site of XSAR. This area locates in the urban area. In Figure.14, The LBO contains the river-wall (1), the cement road (2), the man-made pool (3) and the river (4). The general classification result is presented in the Figure.15. The rough surface seems separable to others; however, the water and cement surface, such as road and river wall, are still confused.
Figure 14. The PAULIRGB image of the test site B and the corresponding ground truth
Figure 15. The classification result of Wishart-H-Alpha
Figure 16. The normalized Entropy-PSD feature segmentation When the Entropy-PSD feature algorithm is applied, the LBO shows a remarkable distinguish in Figure.16. The further classification gives an improvement of LBO. The river/pool are separated with the road/river-wall. However, there is always some confusion when the high brightness target, such as streetlight, around the LBO. The brightness radar target is caused by the stabilized phase and that increases the randomness of surrounding PSD parameter. That is why the test site B does not present well as the test site A.
Figure 17. The classification result of the mixture land-cover ISPRS Annals of the Photogrammetry, Remote Sensing and Spatial Information Sciences, Volume I-7, 2012
5. CONCLUSION AND FURTURE WORK
This paper exploits the low backscattering targets classification. The general algorithms always confuse the typical darkness targets of radar images which contain the bare soil, the cement road, the water body and the shadow. We propose combining the Entropy and PSD parameter to subdivide the mixture classes. The preparing of the refined classifying contains three steps. Firstly, re-estimate the C3 matrix based on the Pre-Classification result. The next, calculate the entropy and PSD parameters. Finally, segment the Entropy-PSD feature using the threshold or the mean-shift method, then, output the classification result. In the improvement algorithm, the Pre-Classification only ascertains the mixture classes and provides the initial classification info. The further sub-dividable process is implemented by the Entropy-PSD and the betterment is considerable.
Acknowledgements
The authors would like to thank the Lijun Lu of Chinese Academy of Surveying and Mapping for useful discussions.
References:
Ainsworth, T. L., Grunes, M. R., and Lopez Martinez, C., Carlo, Monte, 2006. Evaluation of multilook effect on entropy alpha anisotropy parameters of polarimetric target decomposition. Proceedings of IGARSS, Denver, Colorado, USA.
Brunner, D., Lemoine, G., Bruzzone, L., Greidanus, H, 2010. Building Height Retrieval from VHR SAR Imagery Based on an Iterative Simulation and Matching Technique. IEEE Trans. Geosci. RemoteSens., 48(3), pp. 1487–1504.
E. Pottier and J. S. Lee, 2000. Unsupervised classification scheme of PolSAR images based on the complex Wishart distribution and the entropy alpha anisotropy Polarimetric decomposition theorem. Proceeding of EUSAR, Munich, Germany, pp. 265-268.
Freeman, A., 2007. Fitting a two components scattering model to polarimetric SAR data from forests. IEEE Trans. Geosci. Remote Sens., 45(8), pp. 2583–2592.
Formont, P., etc, 2010. Statistical classification for heterogeneous polarimetric SAR images. IEEE Journal of Selected Topics in Signal Processing, 5(3), pp. 567–576. Greco, M. S., and Gini, F., 2007. Statistical analysis of high resolution SAR ground clutter data. IEEE Trans. Geosci. RemoteSens., 45(3), pp. 566–575.
Hill, M. J, etc., 2005. Integration of optical and radar classification for mapping pasture type in Western Australia.
IEEE Transactions on Geo science and Remote Sensing, 43(7), pp. 1665-1680.
Hondt, O. D., López-Martínez, C., Ferro-Famil, L., and Pottier, E., 2007. Spatially non stationary anisotropic texture analysis in SAR images. IEEE Trans. Geosci. RemoteSens., 45(12), pp.3905–3918.
Lee, J. S., Grunes, M. R., and Pottier, E., 2001. Quantitative comparison of classification capability: Fully polarimetric versus dual and single polarization SAR. IEEE Transactions on Geo science and Remote Sensing, 39(11), 2343-2351. Lee, J. S., Ainsworth, T. L., Grunes, M. R., and Lopez Martinez, C., Carlo Monte, 2006. Evaluation of multilook effect on entropy alpha anisotropy parameters of polarimetric
target decomposition, Proceedings of IGARSS, Denver, Colorado, USA.
Li, P. X, Shi, L., Yang, J., Lu, L. J., 2011. Assessment of polarimetric and interferometric image quality for Chinese domestic X-band airborne SAR system. Proceedings of International image and data fusion, Yunnan, China.
Mette, T., Papathanassiou, K. P., and Hajnsek, I., 2004. Biomass estimation from Polarimetric SAR interferometry over heterogeneous forest terrain. Proceedings of IGARSS, Anchorage, AK, USA.
Neumann, M., Ferro-Famil, L., and Reigber, A., 2010. Estimation of forest structure, ground, and canopy layer characteristics from multi-baseline polarimetric interferometric SAR data. IEEE Trans. Geosci. Remote Sens., 48(3), pp. 1086– 1104.
S. Seymour and I. G. Cumming, 1994. Maximum likelihood estimation for SAR interferometer, Proceedings of IEEE IGARSS 94, Pasadena, USA.
Saatchi, S., and Soares, J., 1997. Mapping deforestation and land use in Amazon rainforest using SIR-C imagery. Remote Sens. Environ, 59(2), pp. 191–202.
Shi, L., Li, P. X, Yang, J., 2011. Polarimetric and interferometric SAR imagery registration based on hybrid triangle. Geomatics and Information Science of Wuhan University, 37(3), pp. 330-333
Tison, C., Tupin, F., Maitre, H., 2007. A Fusion Scheme for Joint Retrieval of Urban Height Map and Classification from High-Resolution Interferometric SAR Images. IEEE Trans. Geosci. RemoteSens., 45(2), pp. 496–505.
Ulaby, F. T., Moore, R. K. and Fung, A. K.,1912. Microwave Remote Sensing: Active and Passive. Vol II. Radar Remote Sensing and Surface Scattering and Emission Theory. Addison-Wesley.
Vasible, G., and Philippe J., Ovarlez etc, 2010. Coherency matrix estimation of heterogeneous clutter in high resolution polarimetric SAR images. IEEE Trans. Geosci. RemoteSens., 48(4), pp. 1809–1826.
Vasible, G., etc, 2006. Intensity-Driven Adaptive-Neighborhood Technique for Polarimetric and Interferometric SAR Parameters Estimation. IEEE Trans. Geosci. RemoteSens., 44(6), pp. 1609–1620.
Vasible, G., etc, 2008. Normalized Coherency Matrix Estimation Under The SIRV Model Alpine Glacier POLSAR Data Analysis. Proceedings of IGARSS, Boston, Massachusetts, USA.
Yamaguchi, Y., etc, 2011. Four component scattering power decomposition with rotation of coherency matrix. IEEE Trans. Geosci. Remote Sens., 49(6), pp. 2251–2258.