Full Terms & Conditions of access and use can be found at
http://www.tandfonline.com/action/journalInformation?journalCode=ubes20
Download by: [Universitas Maritim Raja Ali Haji] Date: 13 January 2016, At: 00:33
Journal of Business & Economic Statistics
ISSN: 0735-0015 (Print) 1537-2707 (Online) Journal homepage: http://www.tandfonline.com/loi/ubes20
The Measurement of Medicaid Coverage in the
SIPP
David Card, Andrew K.G Hildreth & Lara D Shore-Sheppard
To cite this article: David Card, Andrew K.G Hildreth & Lara D Shore-Sheppard (2004) The
Measurement of Medicaid Coverage in the SIPP, Journal of Business & Economic Statistics, 22:4, 410-420, DOI: 10.1198/073500104000000208
To link to this article: http://dx.doi.org/10.1198/073500104000000208
Published online: 01 Jan 2012.
Submit your article to this journal
Article views: 58
The Measurement of Medicaid Coverage in
the SIPP: Evidence From a Comparison of
Matched Records
David CARD
University of California of Berkeley, Berkeley, CA 94720 (card@econ.berkeley.edu)
Andrew K. G. HILDRETH
California Census Research Data Center, University of California Berkeley, Berkeley, CA 94720
Lara D. SHORE-SHEPPARD
Williams College, Williamstown, MA 01267
This article studies the accuracy of reported Medicaid coverage in the Survey of Income and Program Participation (SIPP) using administrative records from the State of California. Overall, we estimate that the SIPP underestimates Medicaid coverage in the California population by about 10%. The probability of correctly reporting coverage for those actually covered by Medicaid is around 85%, and is even higher for low-income children. The probability that people who are not covered by Medicaid incorrectly report that they are covered is about 1.3% for the population as a whole, but is higher (up to 7%) for low-income children.
KEY WORDS: Attenuation bias; Misclassification.
1. INTRODUCTION
One of the most widely debated policy concerns in the United States is the adequacy of health insurance coverage for low-income children and adults. The Medicaid program was estab-lished in 1965 to provide health insurance for female-headed families on public assistance and for the aged, blind, and dis-abled. Over the past two decades the program has gradually expanded to cover low-income families that are not participat-ing in other welfare programs (Gruber 2002). Despite these ex-pansions, data from the Current Population Survey (CPS) show that about 25% of poor children lacked health insurance cover-age in the mid-1990s (U.S. Department of Commerce, Bureau of the Census 2000). In the wake of recent federal and state-level welfare reforms, there have been renewed efforts to main-tain and expand Medicaid coverage. Nevertheless, CPS data show that the fraction of the U.S. population with measured health insurance coverage fell slightly over the 1990s.
Although analysts agree that expansions in the potential availability of Medicaid have not led to equivalent increases in measured coverage (Shore-Sheppard 1999; Gruber 2002), there is less consensus on the reasons for this phenomenon. One simple explanation is that people underreport their true Med-icaid status in surveys such as the CPS or the Survey of In-come and Program Participation (SIPP), the two key sources of data on health insurance coverage in the United States. Indeed, comparisons between administrative data and CPS estimates of the number of Medicaid recipients show a growing diver-gence in the 1990s. For example, administrative data from the “Form 2082” reporting system show a 29% rise in the num-ber of people covered by Medicaid at any point during the year from 1992 to 1998 (U.S. Department of Health and Human Services, Center for Medicaid and Medicare Services 2002), whereas survey data from the March CPS show only a 7% rise. Even if underreporting by people who have coverage is partially
offset by “false-positive” responses among nonrecipients, mea-surement errors in Medicaid coverage can lead to significant understatement of the takeup rate for the program, potentially explaining some of the puzzling results in the literature.
In this article we present new evidence on the accuracy of Medicaid coverage responses in the SIPP. Unlike the March CPS, which asks individuals whether they were covered by Medicaid at any time in the previous year, the SIPP asks questions about coverage on a month-by-month basis. We use a unique dataset formed by merging survey information from the 1990–1993 SIPP panels with administrative data on Medic-aid coverage from California’s Medi-Cal Eligibility File (MEF). The combined sample contains actual and reported Medicaid coverage status for 20,000 individuals and 640,000 person-months. We construct estimates of net and gross error rates in reported coverage for the overall population and for various subgroups that can be used by researchers to gauge the potential biases in statistical analyses that use the SIPP data.
The article is organized as follows. Section 2 provides a brief overview of the Medicaid program. In Section 3 describes the SIPP survey and presents various data on measured Medicaid participation patterns in the California sample. Section 4 de-scribes the administrative data and summarizes the matching process. It also presents information on the characteristics of the matched sample versus the overall California population. Section 5 contains our main results, including cross-tabulations of reported Medicaid status in the SIPP survey and the MEF for the overall matched sample, and various subsamples. It also summarizes the implications of our findings for studies that use reported Medicaid coverage as either a dependent vari-able or an explanatory varivari-able. Finally, Section 6 reviews our main conclusions.
© 2004 American Statistical Association Journal of Business & Economic Statistics October 2004, Vol. 22, No. 4 DOI 10.1198/073500104000000208 410
2. THE CALIFORNIA MEDICAID PROGRAM
Medicaid is a joint state–federal program that pays for med-ical services for low-income individuals, including the elderly, blind, and disabled recipients of SSI; the “medically needy” (people who have recently incurred large medical expenses); and people in low income families. Historically, the latter group was made up exclusively of participants in the Aid to Fami-lies with Dependent Children (AFDC) program. Starting in the mid-1980s, however, a series of federal law changes expanded Medicaid eligibility to families with incomes above the AFDC threshold and others that did not meet the family composition rules of AFDC. The 1989 Omnibus Budget Reconciliation Act (OBRA) mandated that states offer Medicaid coverage to preg-nant women and children up to age 6 with family incomes below 133% of the federal poverty threshold. OBRA 1990 fur-ther expanded coverage to children born after September 30, 1983 and living in families with incomes below the poverty line. Other legislative changes in the late 1980s and early 1990s allowed states to expand Medicaid coverage beyond these mimum mandates. California, for example, raised the family in-come limit for pregnant women and infants to 200% of the federal poverty line.
During the 1990s, enrollment patterns in the California Med-icaid program—known as Medi-Cal—closely tracked national trends. Between 1991 and 1998, the state accounted for a steady 16% of average monthly Medicaid enrollment in the United States. Further, the ratio of per-capita expenditures in California to the nation as a whole remained relatively con-stant. In light of this stability and the size and diversity of the
California population, we believe that the state provides an ex-cellent testing ground for evaluating the quality of Medicaid coverage responses.
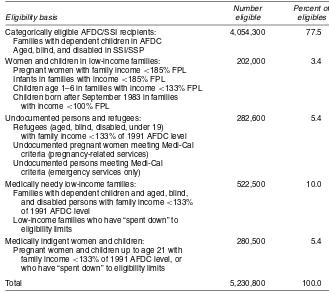
Table 1 reports the various Medi-Cal eligibility categories in effect in California as of late 1995, along with estimates of the number of people covered under each category. Despite the coverage expansions in the late 1980s and early 1990s, more than 75% of individuals covered by Medi-Cal in 1995 were adults or children enrolled in AFDC or SSI. The majority of this group—about 60% of total Medi-Cal enrollees—were AFDC recipients. Another 10% were medically needy adults and chil-dren, 5% were refugees and undocumented aliens, and 5% were medically indigent adults and children. Only about 3% of Medi-Cal enrollees in 1995 were women or children who were re-ceiving coverage as a result of the poverty-related expansions. In part this reflects the generous AFDC limits in California, where the fraction of children in families with incomes above the AFDC threshold but below the poverty line is lower than in most other states.
Given the high fraction of Medi-Cal enrollees whose cover-age is linked to welfare participation, it is not surprising that changes in Medi-Cal enrollment are strongly related to changes in the welfare caseload. The recession of the early 1990s led to a rise in California’s welfare rolls and increases in Medi-Cal enrollment. Since 1996, welfare rolls and Medicaid enroll-ment have both declined in California, with evidence that most of the drop in Medi-Cal has been attributable to the drop in the number of families receiving cash assistance (Broaddus and Guyer 2000).
Table 1. Medi-Cal Eligibility Criteria and Caseload as of 1995
Number Percent of
Eligibility basis eligible eligibles
Categorically eligible AFDC/SSI recipients: 4,054,300 77.5 Families with dependent children in AFDC
Aged, blind, and disabled in SSI/SSP
Women and children in low-income families: 202,000 3.4 Pregnant women with family income<185% FPL
Infants in families with income<185% FPL
Children age 1–6 in families with income<133% FPL Children born after September 1983 in families
with income<100% FPL
Undocumented persons and refugees: 282,600 5.4 Refugees (aged, blind, disabled, under 19)
with family income<133% of 1991 AFDC level Undocumented pregnant women meeting Medi-Cal
criteria (pregnancy-related services) Undocumented persons meeting Medi-Cal
criteria (emergency services only)
Medically needy low-income families: 522,500 10.0 Families with dependent children and aged, blind,
and disabled persons with family income<133% of 1991 AFDC level
Low-income families who have “spent down” to eligibility limits
Medically indigent women and children: 280,500 5.4 Pregnant women and children up to age 21 with
family income<133% of 1991 AFDC level, or who have “spent down” to eligibility limits
Total 5,230,800 100.0
NOTE: FPL denotes the federal poverty line for the family unit.
Source: State of California Legislative Analyst’s Office (1995).
3. MEDICAID COVERAGE AMONG CALIFORNIA RESPONDENTS IN THE SIPP
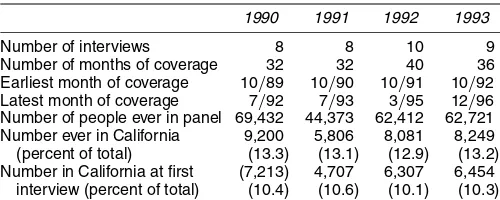
In this article we study the reporting of Medicaid cover-age by California respondents in the 1990–1993 SIPP panels. Table 2 provides an overview of the SIPP data. Each panel of the SIPP consists of four rotation groups who are inter-viewed on a staggered schedule every 4 months. Individu-als in the 1990 and 1991 panels were interviewed 8 times, those in the 1992 panel were interviewed 10 times, and those in the 1993 panel were interviewed 9 times. The four pan-els contain information for a total of 238,938 people cover-ing the period October 1989–December 1996. Just over 10% of the sample (24,681 individuals) were in California in their first interview. A larger fraction—about 13% of the sample, or 31,336 people—spent at least 1 month in California.
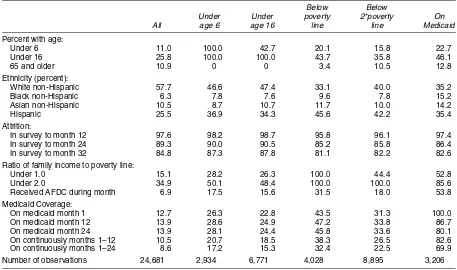
Table 3 presents some descriptive statistics for the sample of individuals who were in California at the first SIPP inter-view and for various subsets of this population, including young children (age 5 or under), all children, people living in poor and “near-poor” families, and people who reported that they were covered by Medicaid in the first survey month. About 25% of the SIPP California sample are children, and just over 10% are elderly. Consistent with national patterns, children are over-represented among the populations of poor and near-poor and make up close to 50% of Medicaid participants. The diversity of the California population is evident in the ethnic composi-tion of the SIPP sample. White non-Hispanics account for less than 60% of Californians, and make up even smaller fractions of children, people in poverty, and Medicaid recipients. Hispan-ics (of all racial groups) make up 25% of the overall California population and larger shares of children, people in poverty, and Medicaid recipients.
Like other longitudinal surveys, the SIPP has sample attrition (see Jabine, King, and Petroni 1990). About 10% of individu-als who are in the first SIPP interview leave the sample by the sixth interview, and another 3% leave by the eighth interview. Attrition rates are about the same for children as for the over-all sample but are higher for people who were in poor or near-poor families in the first interview or were enrolled in Medicaid. These selective attrition patterns imply that trends in Medicaid enrollment within a panel are slightly downward-biased relative to trends across panels (see below).
In the early and mid-1990s, California had somewhat higher poverty rates, and higher welfare and Medicaid participation rates, than the nation as a whole (Card 2001). On average, about 15% of the SIPP California sample was poor (i.e., had
Table 2. Characteristics of 1990–1993 SIPP Panels
1990 1991 1992 1993
Number of interviews 8 8 10 9 Number of months of coverage 32 32 40 36 Earliest month of coverage 10/89 10/90 10/91 10/92 Latest month of coverage 7/92 7/93 3/95 12/96 Number of people ever in panel 69,432 44,373 62,412 62,721 Number ever in California 9,200 5,806 8,081 8,249 (percent of total) (13.3) (13.1) (12.9) (13.2) Number in California at first (7,213) 4,707 6,307 6,454
interview (percent of total) (10.4) (10.6) (10.1) (10.3) NOTE: Based on the authors’ tabulations of the SIPP full panel research files.
family income below the federal poverty line), with an even higher poverty rate among children. In view of Medicaid eligi-bility criteria, it is not surprising that more than 50% of Medic-aid enrollees are poor, and more than 85% live in families with incomes less than 200% of the federal poverty line.
The bottom rows of Table 3 present Medicaid coverage data for the SIPP sample. About 13% of the sample reported being covered by Medicaid in the first interview month. Participation rates in later months are higher, suggesting that coverage rates were rising in the early 1990s. This is confirmed in Figure 1, which plots the fraction of SIPP respondents living in Califor-nia who were enrolled in Medicaid by panel and month, along with the average monthly enrollment rate (for all California res-idents) across all of the SIPP panels. There is a tendency for enrollment rates within a panel rise to more slowly than the av-erage enrollment rate. As noted earlier, one explanation for this pattern is that individuals with a higher probability of Medic-aid participation have higher attrition rates, so that participation rates are downward-biased in later months of the panel. To ex-plore this idea, we constructed within-panel changes in Medic-aid participation for people who remained in the sample for at least 32 months, and compared these with the changes shown in Figure 1 (which are based on all available observations in each month). As expected, the within-panel changes for the contin-uing sample are larger, but on average, selective attrition can account for only about 33% of the slower within-panel growth in Medicaid participation.
Another striking feature of Figure 1 is that Medicaid cover-age rates are higher in the 1993 panel and lower in the 1990 panel than in the two middle panels. We believe that these dif-ferences are largely explained by difdif-ferences in the characteris-tics of the California sample from panel to panel. In particular, interpanel comparisons of the fraction of people who live in poverty suggest that the 1990 panel has relatively fewer poor families than the 1991 or 1992 panel, whereas the 1993 panel has more. Once differences in the distributions of age, ethnic-ity, and poverty status are taken into consideration, cross-panel differences in Medicaid coverage narrow substantially.
A common feature of longitudinal data collected from ret-rospective surveys is “seam bias” (see, e.g., Jabine et al. 1990; Groves 1989). SIPP participants are interviewed every 4 months about their program participation and other activities in the preceding 4 months, and there is a tendency for changes in status to be recorded at the interview “seams”—between the fourth and fifth months, for example. Not surprisingly, this is true for changes in reported Medicaid coverage. Figure 2 shows the transition rates into and out of Medicaid coverage in the first 31 months of the combined 1990–1993 SIPP pan-els. (The sample underlying this figure includes only individ-uals who were living in California in the current and previous months.) The figure also shows the average fraction of individ-uals who reported Medicaid coverage by SIPP interview month in the pooled sample. Roughly 67% of all spell beginnings and endings occur at a seam (versus an expected frequency of 25%). Moreover, there is a small but noticeable seam pattern in the rate of Medicaid coverage, with a tendency for higher coverage rates in the month just before the SIPP interview (i.e., inter-view months 4, 8, 12, and so on). These patterns provide prima facie evidence of measurement error in SIPP-reported Medic-aid coverage.
Table 3. Characteristics of California Residents in First Interview of 1990–1993 SIPP Panels
Below Below
Under Under poverty 2*poverty On All age 6 age 16 line line Medicaid
Percent with age:
Under 6 11.0 100.0 42.7 20.1 15.8 22.7
Under 16 25.8 100.0 100.0 43.7 35.8 46.1
65 and older 10.9 0 0 3.4 10.5 12.8
Ethnicity (percent):
White non-Hispanic 57.7 46.6 47.4 33.1 40.0 35.2 Black non-Hispanic 6.3 7.8 7.6 9.6 7.8 15.2 Asian non-Hispanic 10.5 8.7 10.7 11.7 10.0 14.2
Hispanic 25.5 36.9 34.3 45.6 42.2 35.4
Attrition:
In survey to month 12 97.6 98.2 98.7 95.8 96.1 97.4 In survey to month 24 89.3 90.0 90.5 85.2 85.8 86.4 In survey to month 32 84.8 87.3 87.8 81.1 82.2 82.6 Ratio of family income to poverty line:
Under 1.0 15.1 28.2 26.3 100.0 44.4 52.8 Under 2.0 34.9 50.1 48.4 100.0 100.0 85.6 Received AFDC during month 6.9 17.5 15.6 31.5 18.0 53.8 Medicaid Coverage:
On medicaid month 1 12.7 26.3 22.8 43.5 31.3 100.0 On medicaid month 12 13.9 28.6 24.9 47.2 33.8 86.7 On medicaid month 24 13.9 28.1 24.4 45.8 33.6 80.1 On continuously months 1–12 10.5 20.7 18.5 38.3 26.5 82.6 On continuously months 1–24 8.6 17.2 15.3 32.4 22.5 69.9 Number of observations 24,681 2,934 6,771 4,028 8,895 3,206 NOTE: Means are weighted by SIPP weight assigned for the first year of the panel (e.g., 1990 weights are used for the 1990 panel).
Source: Authors’ tabulations of the SIPP microdata.
Figure 1. Medicaid Participation Rates in California, by SIPP Panel.
Figure 2. Medicaid Coverage ( ), Entry ( ), and Exit ( ) Rates by Survey Month.
Figure 3. Medicaid Participation Rates in California: Administrative Data, SIPP, and CPS [ average monthly caseload/population; March CPS (aligned to January); average of 1990–1993 SIPP panels].
Another important indicator of measurement error is the discrepancy between average Medicaid participation rates in the SIPP and the average number of Medicaid beneficiaries per capita. Figure 3 illustrates this comparison. For reference, it also shows estimated Medicaid participation rates from the March CPS. The smooth line in the figure is the ratio of monthly Medi-Cal enrollment (for January and July of each year from 1989 to 1996), divided by the Census Bureau’s an-nual estimate of state population, linearly interpolated across months. This is presumably the true fraction of the California population enrolled in Medicaid. The solid line marked with crosses is the average Medicaid enrollment rate from the four SIPP panels. The SIPP-based estimate of Medicaid enrollment tracks the administrative estimate fairly well, but is systemati-cally lower. Averaged over all months of the sample period and weighted by the number of people in the combined SIPP Cali-fornia sample in each month, we estimate that the SIPP sample underestimates Medicaid enrollment by 12%.
In contrast to the SIPP survey, which asks about Medicaid enrollment on a monthly basis, the March CPS asks about Med-icaid enrollmentat any timeduring the previous calendar year. If answered correctly, this rate should be substantially above the average monthly enrollment rate, because many people move into and out of Medicaid during the year. Indeed, using Medic-aid administrative data, we estimate that the number of people who were on Medicaid at any time during the year is 25–30% higher than the average monthly caseload. However, most ana-lysts have concluded that March CPS respondents report some-thing closer to their current Medicaid status, rather than their participation at any time in the previous year (e.g., Bennefield 1996). Consistent with this interpretation, the March CPS en-rollment rates in Figure 3 are about equal to the estimated enrollment per capita for January of the same year, although the CPS rates rise more slowly over the 1989–1996 period. Because of the difficulty of interpreting the March CPS cover-age responses, comparing the relative accuracy of SIPP versus CPS is difficult. Our interpretation is that both surveys contain errors, and that the net underreporting errors from the SIPP ap-pear to be more stable over time.
4. MATCHING SIPP AND ADMINISTRATIVE DATA
4.1 Potential Matching of Medi-Cal Data to the SIPP
To move beyond the simple comparisons in Figure 3, it is necessary to match survey responses on Medicaid cover-age with administrative data on actual covercover-age. We compare 1990–1993 SIPP data for California residents with data from the state’s Medi-Cal Eligibility Data system. Records were matched using Social Security numbers (SSNs). Because not all individuals in the SIPP have a valid SSN (or allow the Cen-sus Bureau to use their SSN for research purposes), it is impor-tant to understand the characteristics of the subsample of SIPP respondents who are eligible for matching.
In the first SIPP interview, household respondents are asked to provide names and SSNs for all people in the household. Respondents can provide SSNs, or can refuse to allow their SSNs to be used, or can respond that they do not have an SSN or do not know it. In subsequent waves the interviewers try to obtain SSNs for individuals who have not yet provided one. Information for respondents who have not explicitly refused the use of their SSN is forwarded to the Social Security Admin-istration for SSN validation. An attempt is made to assign an SSN (using name, sex, and address information) to respondents whose numbers were not reported.
For purposes of this project a list of validated SSNs for all individuals in the 1990–1993 SIPP panels was searched for matches with SSNs in the administrative file described later. Among the 31,296 individuals in the four SIPP panels who lived in California for at least 1 month, 76.1% had a valid SSN. The fraction is higher (82.2%) for the 24,681 people who were living in California at the first SIPP interview. The difference is partially explained by two factors. First, most of the people who were not in California at the start of the panel (93%) joined a household that was already in the panel. The joiners included newborn infants and young children who are less likely to have a valid SSN. Second, the joiners tended to be in the SIPP for a relatively short time (median number of months, 10). Thus interviewers have less chance of obtaining a valid SSN.
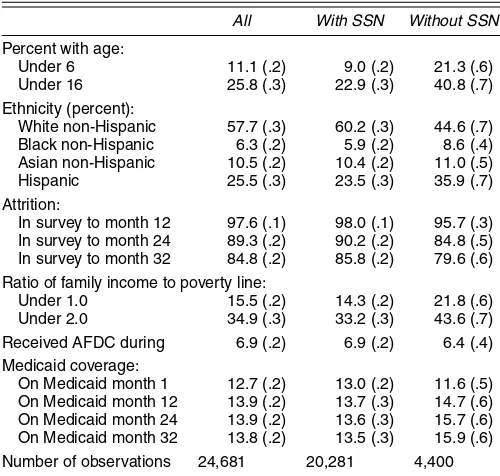
Table 4 compares the characteristics of SIPP respondents with and without a valid SSN who were living in California at
Table 4. Characteristics of California Residents in the First Interview of 1990–1993 SIPP Panels With and Without a Valid SSN
All With SSN Without SSN
Percent with age:
Under 6 11.1 (.2) 9.0 (.2) 21.3 (.6) Under 16 25.8 (.3) 22.9 (.3) 40.8 (.7) Ethnicity (percent):
White non-Hispanic 57.7 (.3) 60.2 (.3) 44.6 (.7) Black non-Hispanic 6.3 (.2) 5.9 (.2) 8.6 (.4) Asian non-Hispanic 10.5 (.2) 10.4 (.2) 11.0 (.5) Hispanic 25.5 (.3) 23.5 (.3) 35.9 (.7) Attrition:
In survey to month 12 97.6 (.1) 98.0 (.1) 95.7 (.3) In survey to month 24 89.3 (.2) 90.2 (.2) 84.8 (.5) In survey to month 32 84.8 (.2) 85.8 (.2) 79.6 (.6) Ratio of family income to poverty line:
Under 1.0 15.5 (.2) 14.3 (.2) 21.8 (.6) Under 2.0 34.9 (.3) 33.2 (.3) 43.6 (.7) Received AFDC during 6.9 (.2) 6.9 (.2) 6.4 (.4) Medicaid coverage:
On Medicaid month 1 12.7 (.2) 13.0 (.2) 11.6 (.5) On Medicaid month 12 13.9 (.2) 13.7 (.3) 14.7 (.6) On Medicaid month 24 13.9 (.2) 13.6 (.3) 15.7 (.6) On Medicaid month 32 13.8 (.2) 13.5 (.3) 15.9 (.6) Number of observations 24,681 20,281 4,400 NOTE: Standard errors are in parentheses. Based on authors’ tabulations of 1990–1993 SIPP microdata. Means are weighted by the SIPP weight assigned for the first year of the panel (e.g., 1990 weights are used for 1990 panel).
the first interview. The first column reports the characteristics of the overall sample, whereas the second and third columns report the characteristics of the subsamples with and without a valid SSN. About 33% of the people without an SSN refused to grant permission for the Census Bureau to use their SSN, whereas the remaining 67% consist of people who either did not have an SSN or reported an SSN that could not be validated against their name and address information.
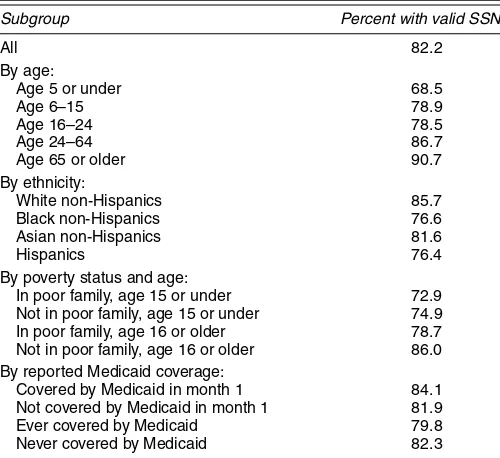
As shown in Appendix Table A.1, a key factor determining whether a valid SSN is available is age. Only 69% of chil-dren under age 6 (at the first interview) have a valid SSN, compared with 79% of 6 to 24-year-old and more than 85% of older adults. Because of these differences, the valid SSN subsample underrepresents children. Ethnicity is also a factor; about 86% of white non-Hispanics have a valid SSN, compared with 77% of black non-Hispanics, 82% of Asian non-Hispanics, and 76% of Hispanics. Thus the valid-SSN subsample slightly overrepresents white non-Hispanics relative to other groups. Individuals with valid SSNs are also less likely to be poor or near-poor. Sample attrition rates of the subsamples with and without valid SSNs are fairly similar.
Importantly for this study, however, Medicaid coverage rates are fairly similar for the subsamples with and without valid SSNs. On the one hand, this equality may seem surprising, given that the subsample without SSNs includes a higher frac-tion of children (who have higher Medicaid coverage rates) and a higher fraction of individuals with low incomes (who also have higher coverage rates). On the other hand, the public assistance and Medicaid systems require SSNs for most peo-ple who are covered (except undocumented immigrants). Thus nearly all adults and children who receive Medi-Cal coverage should have an SSN or should be in the process of obtain-ing one. On balance, this requirement offsets the lower rate of
SSNs for children and poor adults, leading to a roughly pro-portional representation of people covered by Medicaid in the valid SSN subsample. Based on the comparisons in Table 4, we conclude that the group of individuals in the SIPP who can be matched to administrative Medicaid records via their SSNs is not completely representative of the California population, but does include reasonable fractions of children and people from low-income families.
4.2 The Medi-Cal Eligibility File
Medicaid enrollment in California is established at county social welfare offices through on-line access to a statewide data-base maintained by the state’s Health and Welfare Data Center. This file has a record for each individual who is currently en-rolled in Medi-Cal or was enen-rolled at any time over the previ-ous 15 months. Around the 24th of each month, a “snapshot” is taken of the eligibility database; collectively these snapshots form the MEFs. (Here eligibility refers to the fact that peo-ple in the system are eligible to have their medical bills paid by Medi-Cal.) Each MEF snapshot includes individual charac-teristics (sex, date of birth, ethnicity, address, SSN) and two key pieces of information regarding Medi-Cal coverage: a code summarizing eligibility status and a code identifying the pro-gram that provides coverage. We use these codes to determine Medicaid coverage status for each person in each month.
For this project, the California Department of Health Ser-vices granted access to a series of 17 MEFs drawn every 6 months from July 1989 to July 1997. Each file contains data for the current and previous 12 months. The 17 files provide data for the 109-month period from June 1988 (the earliest date covered by the July 1989 MEF) to July 1997. The files were shipped directly to the U.S. Census Bureau, where all records for individuals with SSNs that matched those of people in the 1990–1993 SIPP panels were retained, and coded with an iden-tifier that could be matched to the public-use versions of the SIPP data. The MEF records for this subset of matched peo-ple were then shipped to the California Census Research Data Center, where they were matched to the SIPP files.
An important feature of the MEF records is the overlap in information provided for each person. For example, eligibility information for January 1992 is contained in the January 1992 MEF, the July 1993 MEF, and the January 1993 MEF. For a va-riety of reasons, the information for a given month is not neces-sarily consistent across MEFs. A key source of inconsistency is that Medicaid coverage can be established “after the fact”—this is particularly likely to affect coverage under medically needy and medically indigent programs (Klein 1999). A simple way of combining data across MEF files is to adopt the rule that the latest information is the most accurate; thus coverage in any given month is assigned based on the last MEF that covers that month. After closely examining the monthly coverage patterns in overlapping MEF files, we decided on a variant of this rule. Specifically, for any calendar month we use the data in the most recent MEF, with the exception that we did not use the informa-tion provided for the twelfth previous month, because in many cases it seems that information for the twelfth previous month had been overwritten with information from the current month.
Even with this rule, the administrative coverage data exhibit a “seam bias” pattern, suggesting that there is some remain-ing measurement error in assigned coverage. In particular, us-ing MEF records for individuals who can be matched to the SIPP, we estimate that roughly 40% of spell transitions in any 6-month period occur at a seam date (months 6, 12, 18,. . .of the 109-month sample period) versus an expected frequency of 16.7% if transitions occurred equally across months. At least some of this seam bias is probably due to our matching pro-cedures. Rather than linking all of the MEF records for a sin-gle individual before attempting a match to the SIPP files, each MEF record with an SSN was linked individually to the SIPP, and the matched records were shipped to the California Census Data Research Center. Consequently, if the SSN was missing on an initial Medi-Cal application and updated later, then only the later MEF records for that individual would be included in the matched file; the early records would be missing. This would make it appear that the individual had started Medi-Cal at the time of the seam. We are unable to determine the magnitude of this source of seam bias, because we have access only to MEF records that were successfully matched to a SIPP record. Obvi-ously, however, the MEF dataset contains some errors—a fact that must be taken under consideration in evaluating the relia-bility of SIPP-reported coverage.
5. ANALYSIS OF THE MATCHED FILE
5.1 Cross-Tabulations of Survey and Administrative Coverage
To analyze the accuracy of Medicaid coverage in the SIPP, we compare reported coverage status in the SIPP and MEF files for the same individual in the same calendar month. The
analy-sis is restricted to individuals who reported a valid SSN and who were living in California (according to SIPP records) in the month in question. Appendix Table A.2 provides a sum-mary of the resulting sample. In brief, 23,850 individuals in the 1990–1993 SIPP panels reported living in California for at least one month and provided a valid SSN. On average, each person in this sample has just under 28 months of valid SIPP interview data, and provided just under 27 months of data while living in California, leading to a total of 642,859 person-months of potential Medicaid Coverage. The average fraction of months with reported Medicaid coverage is 14.02%.
For individuals who match with a MEF record, we derive MEF-based coverage for each month directly from their admin-istrative data. In months when an individual is not in the MEF system (but is still living in California), we assume that the in-dividual is not covered by Medicaid. Similarly, for inin-dividuals who report a valid SSN and are living in California butnever
appear in the MEFs during the period July 1988–July 1997, we assume that the individual was never covered by Medicaid.
It is important to note that any errors in the SIPP–MEF matching process will lead us to underestimate Medicaid cov-erage in the MEF. For example, if the wrong SSN is assigned to an individual in the SIPP, then there is relatively little chance of finding a match in the MEF, and the individual will be coded as uncovered. More importantly, if an individual’s SSN is mis-coded or missing in the MEF record that is the potential source of data for the current month, then no match will be found, and an individual who is actually covered by Medicaid will be as-signed an uncovered status. We discuss some evidence on the extent of this problem later.
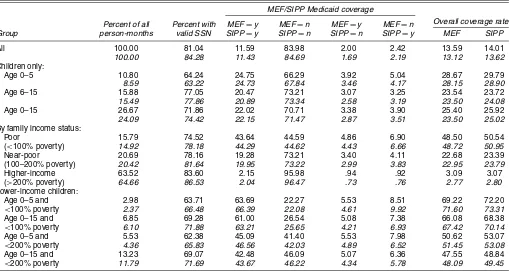
Table 5 presents cross-tabulations of MEF and SIPP Med-icaid coverage for the overall sample of California residents
Table 5. Medicaid Coverage Rates in SIPP versus MEF for Individuals With Valid SSNs (unweighted and weighted)
MEF/SIPP Medicaid coverage
All 100.00 81.04 11.59 83.98 2.00 2.42 13.59 14.01
100.00 84.28 11.43 84.69 1.69 2.19 13.12 13.62
Children only:
Age 0–5 10.80 64.24 24.75 66.29 3.92 5.04 28.67 29.79
8.59 63.22 24.73 67.84 3.46 4.17 28.15 28.90
Age 6–15 15.88 77.05 20.47 73.21 3.07 3.25 23.54 23.72
15.49 77.86 20.89 73.34 2.58 3.19 23.50 24.08
Age 0–15 26.67 71.86 22.02 70.71 3.38 3.90 25.40 25.92
24.09 74.42 22.15 71.47 2.87 3.51 23.50 25.02
By family income status:
Poor 15.79 74.52 43.64 44.59 4.86 6.90 48.50 50.54 (<100% poverty) 14.92 78.18 44.29 44.62 4.43 6.66 48.72 50.95
Near-poor 20.69 78.16 19.28 73.21 3.40 4.11 22.68 23.39 (100–200% poverty) 20.42 81.64 19.95 73.22 2.99 3.83 22.95 23.79
Higher-income 63.52 83.60 2.15 95.98 .94 .92 3.09 3.07 (>200% poverty) 64.66 86.53 2.04 96.47 .73 .76 2.77 2.80
Lower-income children:
Age 0–5 and 2.98 63.71 63.69 22.27 5.53 8.51 69.22 72.20
<100% poverty 2.37 66.48 66.39 22.08 4.61 9.92 71.60 73.31
Age 0–15 and 6.85 69.28 61.00 26.54 5.08 7.38 66.08 68.38
<100% poverty 6.10 71.88 63.21 25.65 4.21 6.93 67.42 70.14
Age 0–5 and 5.53 62.38 45.09 41.40 5.53 7.98 50.62 53.07
<200% poverty 4.36 65.83 46.56 42.03 4.89 6.52 51.45 53.08
Age 0–15 and 13.23 69.07 42.48 46.09 5.07 6.36 47.55 48.84
<200% poverty 11.79 71.69 43.67 46.22 4.34 5.78 48.09 49.45
NOTE: Entries are percentages of person-months for individuals with a valid SSN who are living in California in the month. Unweighted percentages are in regular type; weighted percentages are in italics.
with valid SSNs and for various subsamples, including children, individuals in poor or near-poor families, and children in lower-income families. The table contains two sets of entries; the up-per entry in each cell is based on unweighted data, whereas the lower entry (in italics) is estimated using the first-year sample weights for each person to weight their person-month observa-tions. Because the SIPP sample is based on a stratified sam-pling scheme, the weighted estimates are arguably preferable, although the estimates tend to be quite similar.
The first two columns of Table 5 provide some information on the particular subsample: the fraction of overall person-months contributed by the subsample and the fraction of person-months for the subgroup as a whole attributable to peo-ple with a valid SSN. The latter ratio is more than 80% for the overall sample but is lower for people in poor families, as would be expected given the results in Table 4 and Appen-dix Table A.1. The next four columns show the fractions of person-months in each of four possible categories: covered by Medicaid in both the MEF and the SIPP, uncovered in both files, covered in the MEF but not in the SIPP, and covered in the SIPP but not in the MEF. On average, just over 4% of the person-month observations appear in the two conflicting categories. Interestingly, for the entire sample and for almost all subgroups, the fraction of people who report coverage in the SIPP but not in the MEFexceeds the fraction covered in the MEF but not in the SIPP. The estimated Medicaid coverage rate for individuals with valid SSNs is therefore higher using SIPP-reported coverage than using the MEF records, as shown in the final two columns of the table.
Given the evidence in Figure 3 that overall Medicaid cover-age rates are understated in the SIPP, this is a surprising conclu-sion. Under the assumption that the MEF data are accurate and that there are no errors in the matching process, the only expla-nation is that SIPP respondents without valid SSNs (i.e., those who are not included in Table 5) substantially underreport their coverage. Indeed, if the 80% of people with valid SSN’s over-reporttheir Medicaid coverage in the SIPP, and yet the overall rate of Medicaid participation in the SIPP is 10% below the true rate (as suggested in Fig. 3), the implied underreporting rate for people with missing or invalid SSNs has to be more than 40%. To see this formally, let MV represent the fraction of people with valid SSNs who are covered in the MEF, letMIrepresent the fraction of people with invalid SSNs who are covered in the MEF, and letρdenote the fraction of people who report a valid SSN to the SIPP. The overall fraction covered by Medic-aid in the MEF isρMV+(1−ρ)MI. Similarly, letSVandSI represent the fractions of people with valid and invalid SSNs who report coverage in the SIPP. Then the ratio of the number of people covered by Medicaid caseload to number estimated in the SIPP is (ρMV+(1−ρ)MI)/(ρSV+(1−ρSI))≈1.1. The fractionsSV,SI, ρ, andMV are all observable. Plugging in these numbers provides an estimate of the MEF coverage rate for people with invalid SSNs equal to 26%. The implied reporting rate of true coverage by people with invalid SSNs is
SI/MI=.58—an underreporting rate of 42%.
A more plausible explanation is that there are missing or in-valid SSNs in the MEF system. The MEF records have a field indicating the status of the SSN, and about 20% have missing
or invalid SSNs. Of course, not all these records potentially match to people who report a valid SSN to the SIPP. For ex-ample, undocumented immigrants (about 5.4% of the Medi-Cal caseload) and many young children will not have a valid SSN. Nevertheless, we believe that a significant fraction of Medicaid cases generated by people with valid SSNs in the SIPP have erroneous or missing SSNs in the administrative system.
To understand the implications of such errors for drawing inferences about the reliability of the SIPP data in our matched sample, suppose that the true fraction of person-months covered by Medicaid isπ, and that a fractionαof person-months in the MEF system have missing or incorrect SSNs. Assume that if a person is covered by Medicaid in a given month, then the prob-ability that he or she reports the coverage is(1−fn), where
fnis the false-negative reporting rate. Similarly, assume that if a person isnotcovered by Medicaid in a given month, then the probability that he or she reports the coverage isfp, wherefpis the false-positive reporting rate. Then the probability of observ-ing a person-month of coverage in both the SIPP and the MEF is π(1−α)(1−fn), the probability of observing a person-month of coverage in the MEF but not the SIPP is π(1−α)fn, and the probability of observing a person-month of coverage in the SIPP but not the MEF is (1− π )fp + π α(1−fn). The ratio of the measured Medicaid coverage rate in the SIPP to the true coverage rate is(1−fn)+fp(1−π )/π, which is larger than 1 iffp>fnπ/(1−π ).
Regardless of the value ofα, the false-negative reporting rate (fn) is identified by the fraction of people who are covered in both the SIPP and the MEF, relative to the fraction who covered in the MEF. For a given value ofα, the other two parameters (π andfp) are also identified from the observed fractions with various combinations of SIPP and MEF coverage. Specifically, let R11 represent the fraction of people who report coverage in the both SIPP and the MEF, let R10 represent the fraction of people covered in the MEF and not in the SIPP, and let
R01 represent the fraction of people covered in the SIPP and not the MEF. Thenfn=R10/(R10+R11),π=R10/(fn(1−α)), andfp=(R01−απ(1−fn))/(1−π ).
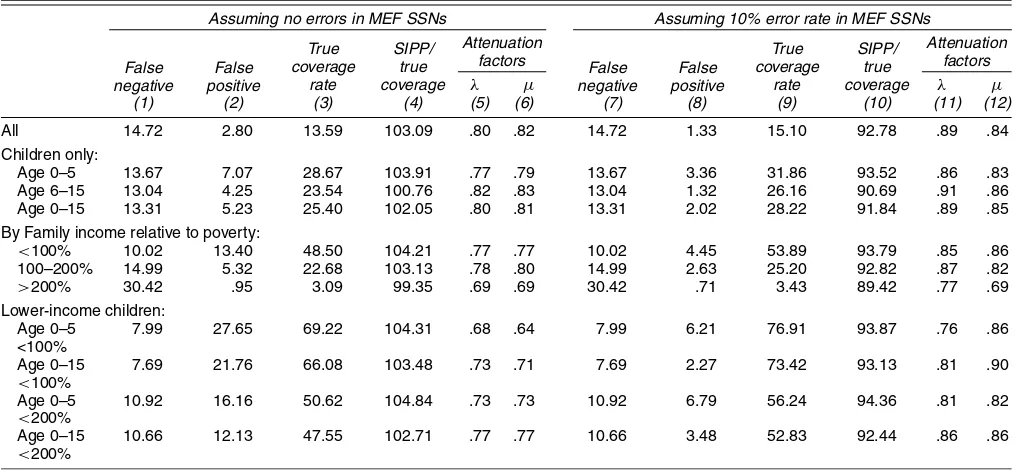
The first 3 columns of Table 6 report estimates ofπ,fn, andfp for the overall sample of people in the SIPP with valid SSNs and for various subgroups under the assumption thatα=0, that is, there are no missing or incorrect SSNs in the MEF. The fourth column gives the implied ratio of Medicaid cover-age in the SIPP to the true covercover-age rate. Ignoring errors in the MEF system, the estimated false-negative rate is about 15%, the estimated false-positive rate is 2.8% and the ratio of the Medicaid coverage measured in the SIPP to the true coverage rate is 103%. Looking across subgroups of the population, the estimated false-negative rate is fairly stable at 8–15%. In com-parison, the estimated probability of a false-positive SIPP re-sponse varies substantially across groups, with a rate up to 25% or children under age 5 in poor families. Across nearly all groups, the estimated net coverage is over-reported in the SIPP by 3–5%.
Inferences about the false-positive rate and the net coverage rate change when allowance is made for the possibility of er-rors or omissions of SSNs in the MEF system. Columns 7–10 present estimates of the same parameters under the assump-tion that 10% of MEF records for people with valid SSNs in
the SIPP have missing or incorrect SSNs. (We explain later why we believe that a 10% error rate is appropriate). Allow-ing for such errors has no effect on the false-negative rate but leads to the a substantial reduction in the false-positive rate, an increase in the estimated true coverage rateπ, and a reduc-tion in the ratio of coverage in the SIPP to the true coverage. Allowing for errors in the MEF also tends to stabilize the es-timated false-positive rate across subgroups. For example, the estimated false-positive rate ranges from 1–7% in column 8, compared with a range of 3–28% in column 2. We believe this is indicative of the plausibility of the assumption of error rates around 10% in the MEF.
In addition, the assumption of a 10% error rate in the MEF leads to the implication that the ratio of SIPP coverage to true coverage for people with valid SSNs is around 90% for all groups in Table 6. For the entire California population, evi-dence in Figure 3 suggests that SIPP-based coverage is equal to about 90% of the true coverage. If the error ratesfn andfp are independent of whether a valid SSN is reported to the SIPP, we would expect the net coverage rate from the SIPP for people with valid SSNs to also equal 90%.
Given the limitations of our matched file, it is difficult to find direct evidence on the fraction of incorrect or missing SSNs in the MEF. However, we have examined likely errors among one group: children whose mothers report Medicaid coverage in both the SIPP and the MEF. Because most mothers who are covered by Medicaid are eligible through AFDC, their children should also be covered by Medicaid. Thus we recalculated the entries in Table 5, assuming that all children who are recorded as covered by Medicaid in the SIPP but not in the MEF and whose mothers reported Medicaid coverage in both datasets are actually enrolled in Medicaid. Unfortunately, this procedure af-fects only the subset of children who are living with mothers who provided valid SSNs to the SIPP. Nevertheless, using this assumption raises the coverage rate for children in the MEF (π )
to a level slightly above the SIPP coverage rate (from 25.4% to 26.2%, ignoring weights). We believe that this provides fur-ther confirmation of the likely importance of invalid or missing SSNs in the MEF file, particularly for children.
5.2 Implications of Estimated Misreporting Rates
Measurement errors in a dichotomous outcome like Medicaid coverage will affect the consistency of conventional statistical estimators when the outcome is used as either an explanatory variable or a dependent variable in the analysis. In the case where Medicaid status is used as an explanatory variable, it is conventional to summarize the impact of the measurement er-rors by the reliability statistic,λ(see, e.g., Angrist and Krueger 1999). This is the regression coefficient of true coverage status on observed SIPP coverage status and is equal to
Pr(true coverage =“yes”|SIPP=“yes”)
−Pr(true coverage=“yes”|SIPP=“no”).
In terms of our notation, the reliability is
λ=π(1−fn)/[π(1−fn)+(1−π )fp]
−πfn/[πfn+(1−π )(1−fp)].
The reliability index measures the degree of attenuation bias that would arise if observed SIPP coverage status were used as an explanatory variable in a regression model in place of “true” MEF coverage. If other covariatesXare included in the regres-sion and it is assumed that the misreporting rates are constant across the population, then the attenuation bias is
λx= {λ−R2/(1−fn−fp)}/{1−R2},
where R2 is the R-squared from a linear probability model for observed SIPP coverage status on theX’s [see Card 1996,
Table 6. Implications of Estimated Coverage Patterns
Assuming no errors in MEF SSNs Assuming 10% error rate in MEF SSNs True
All 14.72 2.80 13.59 103.09 .80 .82 14.72 1.33 15.10 92.78 .89 .84 Children only:
Age 0–5 13.67 7.07 28.67 103.91 .77 .79 13.67 3.36 31.86 93.52 .86 .83 Age 6–15 13.04 4.25 23.54 100.76 .82 .83 13.04 1.32 26.16 90.69 .91 .86 Age 0–15 13.31 5.23 25.40 102.05 .80 .81 13.31 2.02 28.22 91.84 .89 .85 By Family income relative to poverty:
<100% 10.02 13.40 48.50 104.21 .77 .77 10.02 4.45 53.89 93.79 .85 .86 100–200% 14.99 5.32 22.68 103.13 .78 .80 14.99 2.63 25.20 92.82 .87 .82
>200% 30.42 .95 3.09 99.35 .69 .69 30.42 .71 3.43 89.42 .77 .69 Lower-income children:
Age 0–5 7.99 27.65 69.22 104.31 .68 .64 7.99 6.21 76.91 93.87 .76 .86 <100%
Age 0–15 7.69 21.76 66.08 103.48 .73 .71 7.69 2.27 73.42 93.13 .81 .90
<100%
Age 0–5 10.92 16.16 50.62 104.84 .73 .73 10.92 6.79 56.24 94.36 .81 .82
<200%
Age 0–15 10.66 12.13 47.55 102.71 .77 .77 10.66 3.48 52.83 92.44 .86 .86
<200%
NOTE: Entries are based on unweighted entries in Table 5; see the text for the formulas. Entries in columns 5 and 11, labeledλ, represent the reliability of SIPP-reported coverage. Entries in columns 6 and 12, labeledµ, represent the attenuation in a linear probability model when reported coverage is the dependent variable.
eq. (4)]. The addition of X’s that explain Medicaid coverage will lower the effective reliability of the observed indicator.
If observed Medicaid status is used as a dependent variable in the analysis and it is assumed that the true probability of coverage isπ =F(Xβ), whereF is a cumulative distribution function (e.g., logistic or normal), then
P(SIPP=“yes”|X)=fp+(1−fn−fp)F(Xβ)
(see Hausman 2001). In the case of a linear probability specifi-cationF(Xβ)=Xβ, this equation implies that theβcoefficients will be attenuated by a factorµ=(1−fn−fp). More generally, if theX’s are dummies indicating mutually exclusive categories, then estimated differences in the probability of Medicaid cov-erage across categories will be attenuated by approximatelyµ. For example, ifXβ includes a constant and a dummy indicat-ing Medicaid eligibility status, then the estimated takeup rate— that is, the coefficient on the eligibility dummy—will converge in probability to approximatelyµtimes the true rate.
Columns 5 and 6 of Table 6 report estimates ofλandµ un-der the assumption that there are no errors in the MEF-recorded SSNs, whereas columns 11 and 12 report parallel estimates assuming a 10% error rate (i.e., α=.1). The estimated reli-ability of SIPP-reported Medicaid coverage for the California population ranges from .80 when MEF errors are ignored to .89 assuming a 10% error rate. The estimate ofµ is not as sensi-tive to assumptions about the error rate in the MEF system, and ranges from .82 to .84. Looking across subgroups, the estimates ofλ andµ are relatively stable when errors in the MEF are taken into account, but vary more when these errors are ignored. Given the evidence of errors in the MEF and the comparisons of net Medicaid coverage rates under alternative assumptions, we believe that an estimate ofα=.1 is plausible. This implies that λandµare in the range of 80–90% for the overall population and for most subgroups (other than people from relatively high-income families). A value ofµequal to about 80% suggests that measurement errors in coverage are only a small part of the ex-planation for the relatively low estimated takeup rates typically found in studies of the impact of the Medicaid expansions (e.g., Currie and Gruber 1996; Card and Shore Sheppard 2002).
We have also calculated the values of the parametersfn,fp, π,λ, andµfor a wider range of values ofα. An assumed value of α > .16 leads to a negative estimate of the false-positive rate for the overall sample. We therefore take .16 as an upper bound on the range of feasible error rates in the MEF. For values ofαbetween 0 and .16, the implied value ofλranges between 80% and 95%, whereas the implied value ofµranges from 83% to 85%. Thus conclusions about the likely attenuation arising from mismeasured Medicaid coverage data are relatively robust to uncertainty about the error rate in the MEF records.
6. CONCLUSIONS
In this article we use a unique matched dataset for California respondents in the 1990–1993 SIPP panels to assess the valid-ity of Medicaid coverage information in the SIPP. A key finding is that the SIPP provides relatively accurate data on Medicaid coverage for those who are actually receiving it. For the pop-ulation in the SIPP who have valid SSNs and can be matched, we estimate that 85% of all person-months of actual Medicaid
coverage are accurately reported. This ratio is even higher for groups with a high likelihood of Medicaid coverage, including children and people in low-income families. Our conclusions on the accuracy of reported coverage for people who are not actually receiving Medicaid are tempered by the observation that any errors in the matching process between the SIPP and the administrative records will lead to an overstatement of the false-positive coverage rate. Making no allowance for such er-rors, we estimate that 2.5–3% of people who are not covered by Medicaid report that they are covered in the SIPP. However, making a plausible assumption about the rate of missing and invalid SSNs in the administrative data system, we estimate a much lower rate of false-positive responses—around 1.5% overall, and no higher than 7% for poor children. The range of error rates in our study suggest that when reported Medic-aid coverage from the SIPP is used as either a dependent or an independent variable in a statistical analysis, misclassification errors cause attenuation biases of no more than 20%.
ACKNOWLEDGMENTS
The authors thank Gene Hiehle, James Klein, and David Illig of the California Health and Human Services Agency and John Abowd, Julia Lane, Ron Prevost, and Lars Vilhuber of the U.S. Census Bureau for advice and assistance with the data used in this project. They also thank Barrett Graf for research assis-tance and two referees for helpful comments. Partial funding for this project was provided by the California Program on Ac-cess to Care (grant 447615-19900) and by the Joint Center for Poverty Research/U.S. Census Bureau Research Development Grant Program. All opinions are those of the authors and do not reflect the views of the U.S. Census Bureau or the California Department of Health Services.
APPENDIX: BACKROUND TABLES
Table A.1. Probabilities of Having a Valid SSN for Individuals Living in California in the First Month of 1990–1993 SIPP Panels
Subgroup Percent with valid SSN
All 82.2
Age 65 or older 90.7 By ethnicity:
White non-Hispanics 85.7 Black non-Hispanics 76.6 Asian non-Hispanics 81.6
Hispanics 76.4
By poverty status and age:
In poor family, age 15 or under 72.9 Not in poor family, age 15 or under 74.9 In poor family, age 16 or older 78.7 Not in poor family, age 16 or older 86.0 By reported Medicaid coverage:
Covered by Medicaid in month 1 84.1 Not covered by Medicaid in month 1 81.9 Ever covered by Medicaid 79.8 Never covered by Medicaid 82.3 NOTE: All table entries are unweighted counts. The sample includes 24,681 people who were living in California in the first month of the 1990–1993 SIPP Panels.
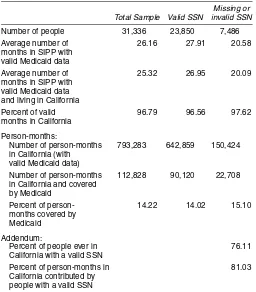
Table A.2. Counts of People and Person-Months for Individuals in 1990–1993 SIPP Panels Who Were Ever in California
Missing or Total Sample Valid SSN invalid SSN
Number of people 31,336 23,850 7,486 Average number of 26.16 27.91 20.58 months in SIPP with
valid Medicaid data
Average number of 25.32 26.95 20.09 months in SIPP with
valid Medicaid data and living in California
Percent of valid 96.79 96.56 97.62 months in California
Person-months:
Number of person-months 793,283 642,859 150,424 in California (with
valid Medicaid data)
Number of person-months 112,828 90,120 22,708 in California and covered
by Medicaid
Percent of person- 14.22 14.02 15.10 months covered by
Medicaid Addendum:
Percent of people ever in 76.11 California with a valid SSN
Percent of person-months in 81.03 California contributed by
people with a valid SSN
NOTE: All table entries are unweighted counts.
[Received September 2001. Revised July 2003.]
REFERENCES
Angrist, J., and Krueger, A. B. (1999), “Empirical Methods in Labor Eco-nomics,” inHandbook of Labor Economics, Vol. 3A, eds. O. Ashenfelter and D. Card, Amsterdam: Elsevier, pp. 1277–1366.
Bennefield, R. L. (1996), “A Comparative Analysis of Health Insurance Cover-age Estimates: Data From CPS and SIPP,” paper presented at the American Statistical Association Joint Meeting, Chicago, IL.
Broaddus, M., and Guyer, J. (2000), “Losing Ground: Recent Declines in the Medi-Cal Enrollment of Families With Children,” working paper, Center on Budget and Policy Priorities.
Card, D. (1996), “The Effect of Unions on the Structure of Wages: A Longitu-dinal Analysis,”Econometrica, 64, 957–980.
(2001), “Welfare Reform and the Labor Market Outcomes of Women,” inThe State of California Labor, eds. J. Lincoln and P. Ong, Berkeley, CA: University of California, Institute of Industrial Relations.
Card, D., and Shore-Sheppard, L. (2002), “Using Discontinuous Eligibility Rules to Identify the Effects of the Federal Medicaid Expansions on Low-Income Children,” Working Paper 9058, National Bureau of Economic Research.
Currie, J., and Gruber, J. (1996), “Health Insurance Eligibility, Utilization of Medical Care, and Child Health,” Quarterly Journal of Economics, 111, 431–466.
Groves, R. M. (1989),Survey Errors and Survey Costs, New York: Wiley. Gruber, J. (2002), “Medicaid,” Working Paper 7829 revised, National Bureau
of Economic Research.
Hausman, J. (2001), “Mismeasured Variables in Econometric Analysis: Prob-lems for the Right and ProbProb-lems From the Left,” Journal of Economic Perspectives, 15, 57–67.
Jabine, T., King, K., and Petroni, P. (1990), “Measurement Error,” inSIPP Quality Profile, Washington, DC: United States Department of Com-merce Bureau of the Census; available at http://www.sipp.census.gov/ sipp/qp/c6.html.
Klein, J. (1999), “A Researcher’s Guide to Medi-Cal Data,” unpublished paper, Medical Care Statistics Section, California Department of Health Services. Shore-Sheppard, L. (1999), “Stemming the Tide? The Effect of
Expand-ing Medicaid Eligibility on Health Insurance Coverage,” workExpand-ing paper, University of Pittsburgh, Dept. of Economics.
State of California Legislative Analyst’s Office (1995), Medi-Cal Program, Sacramento, CA: Legislative Analyst’s Office.
U.S. Department of Commerce, Bureau of the Census (2000),Heath Insur-ance Historical Tables, available atwww.census.gov/hhes/hlthins/historic/
(updated December 2000).
U.S. Department of Health and Human Services, Center for Medic-aid and Medicare Services (2002), HCFA-2082 Report, available at
http://cms.hhs.gov/medicaid/msis/mstats.asp.
U.S. House of Representatives Committee on Ways and Means (2000),Green Book, available atwww.access.gpo.gov/congress/wm001.html.
![Figure 3. Medicaid Participation Rates in California: Administrative Data, SIPP, and CPS [average monthly caseload/population;CPS (aligned to January);Marchaverage of 1990–1993 SIPP panels].](https://thumb-ap.123doks.com/thumbv2/123dok/1144960.764854/6.612.120.479.44.202/medicaid-participation-california-administrative-caseload-population-january-marchaverage.webp)