Summary The value of two heat sum methods, one linear (degree days > 5 °C) and the other curvilinear (period units), were assessed together with calendar days as predictors of the duration of microsporogenesis in seven natural stands of Nor-way spruce (Picea abies (L.) Karst.) and eleven natural stands of Scots pine (Pinus sylvestris L.). Microsporogenesis was divided into two subperiods: March 19 to tetrads (i.e., the end of meiosis) and tetrads to anthesis. The total period from March 19 to anthesis was also assessed.
The methods were compared on a calendar day basis. When annual deviations between the predicted (stand means) and the observed annual heat sums were converted to days, the period unit method outperformed the other methods for both sub-phases and for the total period of microsporogenesis. The degree day parameter was more variable but a better predictor of the duration of the initial phase up to tetrads and of the total period than the calendar day parameter, but the calendar day parameter more accurately predicted the duration of the sub-phase from tetrads to anthesis. The heat sum methods were better predictors of the duration of development of mi-crosporogenesis in exceptionally cold or warm years than the calendar day method.
Keywords: anthesis, heat sum, phenology, Picea abies, Pinus sylvestris, tetrad phase.
Introduction
The progress of many developmental phases in organisms is strongly temperature dependent. Various temperature sum methods have been developed to predict events such as flow-ering, fruit ripening and the emergence of pests. Simple calen-dar time has also been used for this purpose.
Although linear heat sum systems, like degree days, have been criticized because they are nonphysiological (for a his-torical review see Sarvas 1972, cf. Wang 1960), these methods are frequently used in botanical studies because of their sim-plicity. On the other hand, curvilinear regressions of develop-ment rate on temperature have been used occasionally in entomological studies (Shelford 1927, Messenger and Flitters 1958), but only rarely in botanical studies (Sarvas 1972).
Postmeiotic microsporogenesis from tetrads to anthesis of-fers a unique opportunity to measure precisely the length of a generative process without the complications caused by a biofix (zero point). In practice, the biofix is more or less
arbitrary. The use of a biofix is unavoidable if both ends of a process are not limited by observable events. The first phase of microsporogenesis up to tetrad formation and the total period of microsporogenesis up to anthesis both suffer from the un-avoidable use of a biofix.
The aim of this study was to appraise the advantages of using a curvilinear heat sum method rather than a linear heat sum method for estimating developmental intervals during mi-crosporogenesis. In particular, degree days (> 5 °C) and the period unit system of Sarvas (1972) were compared for fore-casting the progress of microsporogenesis in Norway spruce (Picea abies (L.) Karst.) and Scots pine (Pinus sylvestris L.). Both heat sum methods were compared to calendar days as timing parameters. The postmeiotic phase of microsporogene-sis was given special attention because of the advantage of dispensing with a biofix. The consequences of using a biofix to mark the onset of microsporogenesis were also evaluated. Physiological reasons were sought to explain differences in the predictive accuracy of the parameters.
Materials and methods
Ten to 30 male buds were excised either from each tree or from a population of 10 trees daily, one to six times a day, depending on air temperatures (Luomajoki 1977, 1984). Each sample was handled separately. The buds were bisected longitudinally (one half being discarded), and each half bud was put in fresh fixative containing 9/11 (v/v) glacial acetic acid/absolute etha-nol. A pooled squashed sample from 10 to 30 fixed bud halves was subsequently prepared in acetic (or formic) orcein on 4--6 slides. Between 400 and 600 pollen mother cells (PMC) from each pooled squashed sample were inspected under the micro-scope. The onset of each phase of meiosis was considered a point event.
Because meiotic materials were more scarce than those of anthesis, the study was limited by the meiosis data. The meio-sis data had to be adjusted according to the biofix, which was set at March 19 (i.e., the first day of the year with 12 h of sunlight) for the anthesis study (Luomajoki 1993a, 1993b). Consequently, the period unit heat sum data given by Luoma-joki (1984) are not fully comparable with the data used here. For this study, the tetrad stage data were reprocessed (see Figures 2 and 3). The Scots pine data differed from the earlier published data (n = 43; Luomajoki 1984) by the addition of one data set (Rovaniemi XXIX in 1971; locality 8 in Figure 1)
Phenological measurements of microsporogenesis in trees
ALPO J. LUOMAJOKI
The Finnish Forest Research Institute, Kolari Research Station, FIN-95900 Kolari, Finland
Received January 21, 1994
consisting of two observations (each based on a sample of 20 male buds) of the occurrence of the tetrad stage (Table 1).
The stands for the study of early microsporogenesis were the same as used in earlier anthesis studies (Luomajoki 1993a, 1993b). Anthesis was measured on site, but male buds were sampled for the assessment of pollen mother cells.
Mature, thinned stands of several hectares were classified as normal stands for pollination (see Sarvas 1962). Antheses were measured in each stand at tree-top height with one to three self-recording pollen samplers (model Sarvas-Vilska 1963, see Sarvas 1968). The mean of daily pollen catches was used when more than one sampler was used. A Fuess (Berlin Steglitz) thermograph was also placed at tree-top height in each stand.
The pollen catch was counted with the aid of a microscope from the recording bands, and the results presented in terms of daily catches of the recorders, catch averages, cumulative sums and cumulative percentages of the pollen catch (Sarvas 1972). The cumulative percentages were plotted with the Systat/Sy-graph computer program (Wilkinson 1990). The ordinate scale is a Gauss integral with a linear abscissa scale. The abscissa showed the cumulative temperature sum at the end of each day (corresponding to the measurement of the cumulative pollen catch). Because of the effects of secondary pollen on anthesis data (see Luomajoki 1993b), exclusion of points outside the zone from −2 to +1.2 standard deviations was necessary to position the regression line (Figures 2 and 3). The point of 50% completion of each stage was used as a criterion for attaining a given stage. The 50% point is unbiased by standard deviation. One series of observations of anthesis in Norway spruce was
Figure 1. Localities of stands studied: (1) Bromarv, (2) Eckerö, (3) Tuusula, (4) Jokioinen, (5) Heinola, (6) Punkaharju, (7) Vilppula, (8) Rovaniemi, and (9) Kittilä.
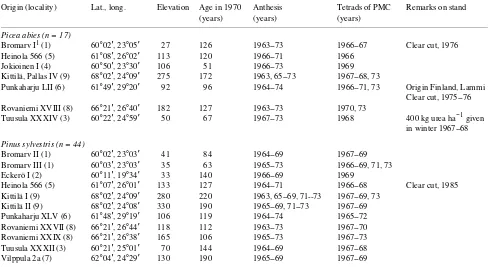
Table 1. Stand characteristics and years of study; PMC = pollen mother cell.
Origin (locality) Lat., long. Elevation Age in 1970 Anthesis Tetrads of PMC Remarks on stand (years) (years) (years)
Picea abies (n = 17)
Bromarv I1 (1) 60°02′, 23°05′ 27 126 1963--73 1966--67 Clear cut, 1976 Heinola 566 (5) 61°08′, 26°02′ 113 120 1966--71 1966
Jokioinen I (4) 60°50′, 23°30′ 106 51 1966--73 1969 Kittilä, Pallas IV (9) 68°02′, 24°09′ 275 172 1963, 65--73 1967--68, 73
Punkaharju LII (6) 61°49′, 29°20′ 92 96 1964--74 1966--71, 73 Origin Finland, Lammi Clear cut, 1975--76 Rovaniemi XVIII (8) 66°21′, 26°40′ 182 127 1963--73 1970, 73
Tuusula XXXIV (3) 60°22′, 24°59′ 50 67 1967--73 1968 400 kg urea ha−1 given in winter 1967--68
Pinus sylvestris (n = 44)
Bromarv II (1) 60°02′, 23°03′ 41 84 1964--69 1967--69 Bromarv III (1) 60°03′, 23°03′ 35 63 1965--73 1966--69, 71, 73 Eckerö I (2) 60°11′, 19°34′ 33 140 1966--69 1969
Heinola 566 (5) 61°07′, 26°01′ 133 127 1964--71 1966--68 Clear cut, 1985 Kittilä I (9) 68°02′, 24°09′ 280 220 1963, 65--69, 71--73 1967--69, 73
Kittilä II (9) 68°02′, 24°08′ 330 190 1965--69, 71--73 1967--69 Punkaharju XLV (6) 61°48′, 29°19′ 106 119 1964--74 1965--72 Rovaniemi XXVII (8) 66°21′, 26°44′ 118 112 1963--73 1967--70 Rovaniemi XXIX (8) 66°21′, 26°38′ 165 106 1965--73 1967--73 Tuusula XXXII (3) 60°21′, 25°01′ 70 144 1964--69 1967--68 Vilppula 2a (7) 62°04′, 24°29′ 130 190 1965--69 1967--69
1 Plot numbers were assigned by the former Department of Silviculture of the Finnish Forest Research Institute. All other stand origins are local
rejected because of a minimal pollen catch (Bromarv I in 1968) to avoid bias by secondary pollen from neighboring stands.
The nine localities involved in the study are shown in Fig-ure 1. In all, 61 microsporogeneses studied from the biofix (March 19) to 50% anthesis completion were available, and 57 of them were used for a comparison by means of the annual deviations (between predicted and observed day) and by coef-ficients of variation.
The methods were compared on the basis of days (see Hari and Häkkinen 1991), but the means of the basic data of the heat sum methods are also shown (see Tables 2--4). The observa-tions made in calendar days were used directly, but for the heat sum methods, the expected heat sum (stand mean) and each observed annual value were compared. For each year of study, the expected heat sum (stand mean) was scanned on the par-ticular stand-specific annual heat sum scale in either direction from the heat sum actually observed to obtain the predicted day. It was necessary to convert the basic data obtained by the heat sum methods to a day basis, because the accumulation of daily heat sums accelerated toward the end of the study period (Figure 4).
Results
Based on estimates of period unit heat sums, the first phase of microsporogenesis in Scots pine (Table 2) from March 19 to 50% tetrad phase completion (Figure 5) was similar in length to the second part from tetrads to anthesis (Table 3), whereas in Norway spruce, the first phase was only about half the length of the second phase (Tables 2 and 3). However, when based on observed duration in calendar days, the second phase was considerably shorter than the first phase in both species (Tables 2 and 3). The difference between the two methods was a result of low ambient temperatures during the first phase. Low temperatures during the first phase also explain why the
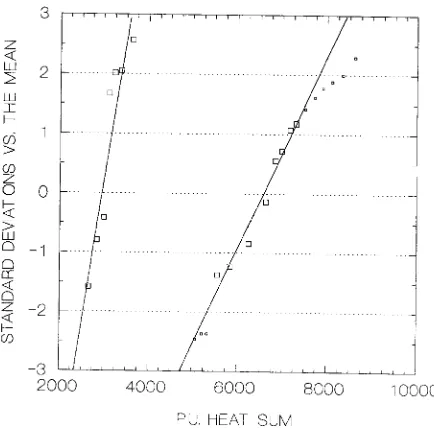
Figure 2. Tetrad stage of microsporogenesis (left) and anthesis (right) in Norway spruce at Punkaharju, Stand LII. The lines give the 50% completion points (at 0 of ordinate) of the tetrad stage and of anthesis: 50% of the pollen mother cells were in tetrad stage at 1577 period units and 50% of pollen in anthesis at 5244 period units. For anthesis, the central larger squares were used to position the line whereas the smaller ones beyond the limits of −2 to +1.2 standard deviations were excluded (see Luomajoki 1993b for details of the method). The slopes of the lines give the standard deviations (SD) of the two processes. The SD can be read along the line from the abscissa between the 0 and +1 points of the ordinate. As percentages, these points correspond to the 50 and 84.13% points of the scale. The SD of tetrad stage was 204 period units and the SD of anthesis was 414 period units. The dates of 50% completion of the tetrad and anthesis phases were May 10 and June 2, respectively.
Figure 3. Tetrad stage of microsporogenesis (left) and anthesis (right) in Scots pine at Rovaniemi, Stand XXIX. The method described in Figure 2 was applied. Fifty percent of the pollen mother cells were in tetrad stage at 2963 period units, and 50% of pollen had reached anthesis at 6878 period units. The standard deviation (SD) of tetrad phase was 209 period units, and the SD of anthesis was 618 period units. The dates of 50% completion of the tetrad and anthesis phases were on June 10 and 28, respectively.
predictions based on period units and degree days differed (cf. Figure 6).
All three periods of microsporogenesis (i.e., first phase, second phase and total period) in Scots pine were shorter in terms of period units in the north than in the south of Finland. A similar correlation with latitude was also found when the
prediction was based on the degree day method, even though the change in the length of the first phase of microsporogenesis from March 19 to tetrads was minimal (Figure 6). When the prediction was based on calendar days, both the first part and the total period of microsporogenesis were considerably longer in the north than in the south of Finland; however, the duration of the second phase of microsporogenesis in calendar days was not correlated with latitude.
A comparison of the performance of the three methods was only possible on a day basis. For both the heat sum methods, the predicted day was used as the criterion, whereas no conver-sion was necessary for the calendar day method. Based on the coefficient of variation, the period unit method was the best predictor for both subphases of microsporogenesis as well as for the total period from biofix to tetrads (Tables 2--4). The degree day method produced less consistent results than the period unit method, performing second best for the initial phase from biofix to tetrads and for the total period. The calendar day method was second best in performance for the phase from tetrads to anthesis, but it was the worst parameter for the initial phase and the total period (Tables 2--4).
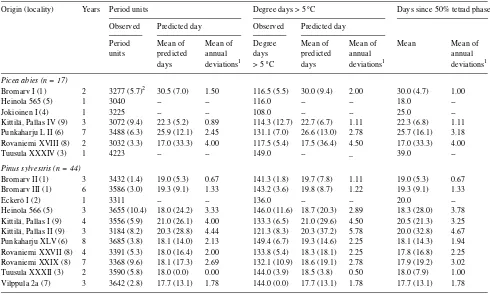
The mean of annual deviations between predicted and ob-served day is given in Tables 2--4. Ranking the parameters by the mean of annual deviations rather than by the coefficient of variation gave similar results with one exception. For the total period, considering only the accuracy of the forecast and the number of stands, the degree day method outperformed the Table 2. Comparison of timing parameters in measuring microsporogenesis from March 19 to 50% completion of tetrad phase.
Origin (locality) Years Period units Degree days > 5 °C Days since March 19
Observed Predicted day Observed Predicted day
Period Mean of Mean of Degree Mean of Mean of Mean Mean of
units predicted annual days predicted annual annual
days deviations1 > 5 °C days deviations1 deviations1
Picea abies (n = 17)
Bromarv I (1) 2 1214 (9.5)2 45.5 (17.1) 5.50 7.0 (40.4) 49.0 (8.7) 3.00 45.5 (10.9) 3.50
Heinola 565 (5) 1 1775 -- -- 29.0 -- -- 56.0
--Jokioinen I (4) 1 1615 -- -- 19.0 -- -- 49.0
--Kittilä, Pallas IV (9) 3 1785 (8.2) 75.3 (4.7) 2.44 24.3 (22.6) 75.7 (3.3) 1.78 75.3 (4.1) 2.22 Punkaharju L II (6) 7 1661 (11.9) 51.7 (6.1) 2.12 26.4 (37.4) 53.1 (6.0) 2.20 51.1 (8.3) 3.27 Rovaniemi XVIII (8) 2 1745 (2.1) 67.5 (5.2) 2.50 26.0 (10.9) 67.5 (3.1) 1.50 67.5 (5.2) 2.50
Tuusula XXXIV (3) 1 1639 -- -- 27.0 -- -- 39.0
--Pinus sylvestris (n = 44)
Bromarv II (1) 3 3300 (5.1) 67.0 (1.5) 0.67 63.3 (16.6) 67.7 (2.3) 1.11 67.3 (1.7) 0.89
Bromarv III (1) 6 3163 (4.3) 64.7 (2.5) 1.33 65.2 (24.7) 65.7 (6.0) 3.00 65.2 (3.3) 1.56
Eckerö I (2) 1 3279 -- -- 64.0 -- -- 72.0
--Heinola 566 (5) 3 3280 (14.7) 64.3 (3.2) 1.56 80.3 (12.5) 66.7 (6.8) 3.11 66.3 (7.7) 3.78
Kittilä, Pallas I (9) 4 2852 (7.7) 84.0 (7.2) 5.00 60.8 (19.7) 84.5 (7.6) 5.00 84.5 (7.0) 4.25 Kittilä, Pallas II (9) 3 3029 (15.9) 87.3 (9.3) 6.22 68.0 (21.4) 89.3 (4.5) 2.89 86.7 (11.2) 7.11 Punkaharju XLV (6) 8 3363 (6.3) 68.4 (4.1) 2.29 83.8 (14.6) 69.4 (5.3) 2.88 68.4 (4.7) 2.79 Rovaniemi XXVII (8) 4 3146 (7.0) 79.0 (5.8) 3.00 70.5 (13.2) 79.5 (5.3) 3.00 79.0 (6.3) 3.50 Rovaniemi XXIX (8) 7 3199 (8.5) 78.7 (4.1) 2.33 75.9 (22.0) 79.4 (4.8) 2.78 79.0 (5.3) 3.43 Tuusula XXXII (3) 2 3155 (14.2) 62.0 (4.6) 2.00 58.0 (14.6) 60.0 (9.4) 4.00 64.5 (7.7) 3.50
Vilppula 2a (7) 3 3497 (13.5) 69.7 (2.2) 1.11 77.3 (22.8) 70.3 (3.6) 1.78 69.7 (3.6) 1.78
1 Between observed day and predicted day. 2 Coefficient of variation in brackets.
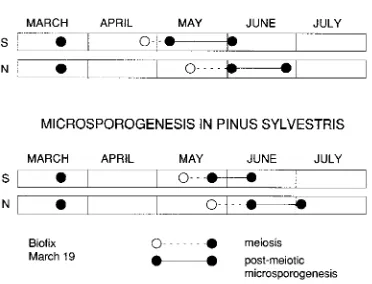
Figure 5. A diagrammatic presentation of the timing of microsporo-genesis in Norway spruce and Scots pine in southern and northern Finland. Distances between the solid points (d) were measured in this
study; open points (s) mark the estimated time when 50% of the
other methods in terms of mean of annual deviations. However, when the total number of years of study in the stands was considered, the period unit method outperformed the other methods. The mean of annual deviations is a simple unsquared value in contrast to the coefficient of variation, which involves squared terms that tend to amplify the occasional large differ-ences between estimates.
Tables 2--4 also demonstrate that the coefficient of variation changed considerably when the units of the heat sum methods were converted to a predicted day basis. The performance of the heat sum methods was apparently inferior when based on the coefficient of variation of the basic data than after sion to a calendar day basis. Nevertheless, even before conver-sion of the data, the period unit method was the best measure of the duration of the second phase of microsporogenesis.
Discussion
Placing the biofix on March 19 was justified by the metabolic activity observed in microsporangiate strobilus primordia of Scots pine in Finland (Kupila-Ahvenniemi et al. 1978, Hohtola et al. 1984, Häggman 1987, Häggman 1991), but it did not account for the inevitable annual variations.
The effects of irradiance were ignored. It is commonly assumed that irradiance effects are not significant for conifers in spring (Mirov 1956); however, light is known to affect microsporogenesis in other species (Alnus, Betula) toward the Table 3. Comparison of timing parameters in measuring microsporogenesis from 50% completion of tetrad phase to 50% completion of anthesis.
Origin (locality) Years Period units Degree days > 5 °C Days since 50% tetrad phase
Observed Predicted day Observed Predicted day
Period Mean of Mean of Degree Mean of Mean of Mean Mean of
units predicted annual days predicted annual annual
days deviations1 > 5 °C days deviations1 deviations1
Picea abies (n = 17)
Bromarv I (1) 2 3277 (5.7)2 30.5 (7.0) 1.50 116.5 (5.5) 30.0 (9.4) 2.00 30.0 (4.7) 1.00
Heinola 565 (5) 1 3040 -- -- 116.0 -- -- 18.0
--Jokioinen I (4) 1 3225 -- -- 108.0 -- -- 25.0
--Kittilä, Pallas IV (9) 3 3072 (9.4) 22.3 (5.2) 0.89 114.3 (12.7) 22.7 (6.7) 1.11 22.3 (6.8) 1.11 Punkaharju L II (6) 7 3488 (6.3) 25.9 (12.1) 2.45 131.1 (7.0) 26.6 (13.0) 2.78 25.7 (16.1) 3.18 Rovaniemi XVIII (8) 2 3032 (3.3) 17.0 (33.3) 4.00 117.5 (5.4) 17.5 (36.4) 4.50 17.0 (33.3) 4.00
Tuusula XXXIV (3) 1 4223 -- -- 149.0 -- _ 39.0
--Pinus sylvestris (n = 44)
Bromarv II (1) 3 3432 (1.4) 19.0 (5.3) 0.67 141.3 (1.8) 19.7 (7.8) 1.11 19.0 (5.3) 0.67
Bromarv III (1) 6 3586 (3.0) 19.3 (9.1) 1.33 143.2 (3.6) 19.8 (8.7) 1.22 19.3 (9.1) 1.33
Eckerö I (2) 1 3311 -- -- 136.0 -- -- 20.0
--Heinola 566 (5) 3 3655 (10.4) 18.0 (24.2) 3.33 146.0 (11.6) 18.7 (20.3) 2.89 18.3 (28.0) 3.78 Kittilä, Pallas I (9) 4 3556 (5.9) 21.0 (26.1) 4.00 133.3 (6.5) 21.0 (29.6) 4.50 20.5 (21.3) 3.25 Kittilä, Pallas II (9) 3 3184 (8.2) 20.3 (28.8) 4.44 121.3 (8.3) 20.3 (37.2) 5.78 20.0 (32.8) 4.67 Punkaharju XLV (6) 8 3685 (3.8) 18.1 (14.0) 2.13 149.4 (6.7) 19.3 (14.6) 2.25 18.1 (14.3) 1.94 Rovaniemi XXVII (8) 4 3391 (5.3) 18.0 (16.4) 2.00 133.8 (5.4) 18.3 (18.1) 2.25 17.8 (16.8) 2.25 Rovaniemi XXIX (8) 7 3368 (9.6) 18.1 (17.3) 2.69 132.1 (10.9) 18.6 (19.1) 2.78 17.9 (19.2) 3.02
Tuusula XXXII (3) 2 3590 (5.8) 18.0 (0.0) 0.00 144.0 (3.9) 18.5 (3.8) 0.50 18.0 (7.9) 1.00
Vilppula 2a (7) 3 3642 (2.8) 17.7 (13.1) 1.78 144.0 (0.0) 17.7 (13.1) 1.78 17.7 (13.1) 1.78
1 Between observed day and predicted day. 2 Coefficient of variation in brackets.
end of the growing season (Luomajoki 1986). The thermal effects of direct sunlight (Luomajoki 1977, Pukacki 1980) were also ignored.
The basic period unit method was a better predictor of both the first and second phases of microsporogenesis than degree days. The success of the curvilinear heat sum method for the second phase can be accounted for by the existence of real phenological observations that precisely define both the onset and the end of the period. The use of the basic heat sum data can be defended on account of its simplicity. Conversion to a predicted day basis compensates for the accelerating heat sum accumulation toward the end of the period under study, thereby making the comparison of parameters more objective. The coefficient of variation can only be used for assessing the parameters when the biofix is the same for all parameters and when the parameters can be converted to a common scale (days in the present case).
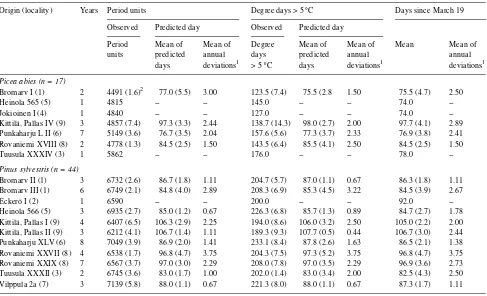
The period unit regression (Sarvas 1972) was developed under an assumption of invariability in the rate of development in a range of different tree species in the boreal zone. The shape of the regression was derived from forced experiments with meiosis in aspen (Populus tremula L.) and the opening rate of birch catkins (Betula pendula Roth, B. pubescens Ehrh.). Sar-vas (1972) also applied period units to the measurement of development rate in conifers, and tested the model with two species of Larix for the temperature range from 0.3 to 9.6 °C. I compared the regression developed by Sarvas (1972) with
Wilson’s (1959) early results and found close similarities in the lower parts of the two curves (Figure 7). Wilson’s (1959) method was inaccurate for the shortest durations of meiosis, so the upper part of the curve is the least reliable. Generally, the largest differences among curvilinear regressions of this kind occur at the upper inflection of the curve.
The climate in Finland is variable, and long cold or warm periods occur. In an exceptionally cold or warm year, heat sum methods will be better predictors of a developmental process than calendar days. Nevertheless, even sophisticated heat sum methods cannot fully compensate for the effects of extremes in weather (cf. Luomajoki 1984, 1993a).
The results indicate that the performance of the different methods depended on the stage of development under study. This confirms Wang’s (1960) conclusion that the thermal reac-tions of plants vary with phase of development and indicates that the homogeneity condition for successful simulation of development set by Sarvas (1977) is not met. Although tem-perature dependency of a developmental process may change with time, curvilinear heat sums have a potential advantage over linear heat sums if properly used. Furthermore, curvilin-ear heat sums can now easily be computerized. Although the degree day heat sum method was a poor predictor of the duration of microsporogenesis, it is better to apply the degree day method for forecasts rather than to depend on calendar time only, because the degree day method accounts for cli-matic extremes.
Table 4. Comparison of timing parameters in measuring microsporogenesis from March 19 to 50% completion of anthesis.
Origin (locality) Years Period units Degree days > 5 °C Days since March 19
Observed Predicted day Observed Predicted day
Period Mean of Mean of Degree Mean of Mean of Mean Mean of
units predicted annual days predicted annual annual
days deviations1 > 5 °C days deviations1 deviations1
Picea abies (n = 17) Kittilä, Pallas I (9) 4 6407 (6.5) 106.3 (2.9) 2.25 194.0 (8.6) 106.0 (3.2) 2.50 105.0 (2.2) 2.00 Kittilä, Pallas II (9) 3 6212 (4.1) 106.7 (1.4) 1.11 189.3 (9.3) 107.7 (0.5) 0.44 106.7 (3.0) 2.44 Punkaharju XLV (6) 8 7049 (3.9) 86.9 (2.0) 1.41 233.1 (8.4) 87.8 (2.6) 1.63 86.5 (2.1) 1.38 Rovaniemi XXVII (8) 4 6538 (1.7) 96.8 (4.7) 3.75 204.3 (7.5) 97.3 (5.2) 3.75 96.8 (4.7) 3.75 Rovaniemi XXIX (8) 7 6567 (3.7) 97.0 (3.0) 2.29 208.0 (7.8) 97.0 (3.5) 2.29 96.9 (3.6) 2.73 Tuusula XXXII (3) 2 6745 (3.6) 83.0 (1.7) 1.00 202.0 (1.4) 83.0 (3.4) 2.00 82.5 (4.3) 2.50 Vilppula 2a (7) 3 7139 (5.8) 88.0 (1.1) 0.67 221.3 (8.0) 88.0 (1.1) 0.67 87.3 (1.7) 1.11
Because variation of point events tends to increase with time (Sarvas 1972), the variation at meiosis should be less than at anthesis. Figures 2 and 3 demonstrate that this is so, although atmospheric factors can slow down anthesis and thus amplify the apparent variation. Sarvas (1967, 1972) concluded that variation during a developmental process remains at 6% of the coefficient of variation as a result of the simultaneous growth of the standard deviation and the mean. For the four point events shown in Figures 2 and 3, the CVs ranged from 7.1 to 12.9%.
Acknowledgments
The materials for this study were collected in the former Department of Silviculture of the Finnish Forest Research Institute. Professor Risto Sarvas (deceased in 1974) initiated extensive studies on the flowering of forest trees and thereby made this study possible.
References
Häggman, H. 1987. Seasonal variations in the ribosome assemblies and in in vitro translations in the buds of Scots pine. Acta Univ. Ouluensis Ser. A, Sci. Rerum Nat. 193:1--39.
Häggman, J. 1991. Cytokinins in developing buds and tissue cultures of Scots pine and their role in xylem production of loblolly pine. Acta Univ. Ouluensis Ser. A, Sci. Rerum Nat. 220:1--68.
Hari, P. and R. Häkkinen 1991. The utilization of old phenological time series of bud burst to compare models describing annual cycles of plants. Tree Physiol. 8:281--287.
Hohtola, A., S. Kupila-Ahvenniemi and R. Ohtonen. 1984. Seasonal changes in the cytoplasmic structures of sporogenous cells of the Scots pine. Ann. Bot. Fenn. 21:143--149.
Kupila-Ahvenniemi, S., S. Pihakaski and K. Pihakaski. 1978. Winter-time changes in the ultrastructure and metabolism of the microspo-rangiate strobili of the Scots pine. Planta 144:19--29.
Luomajoki, A. 1977. Effects of temperature on spermatophyte male meiosis. Hereditas 85:33--48.
Luomajoki, A. 1984. The tetrad phase of microsporogenesis in trees with reference to the annual cycle. Hereditas 101:179--197. Luomajoki, A. 1986. The latitudinal and yearly variation in the timing
of microsporogenesis in Alnus, Betula and Corylus. Hereditas 104:231--243.
Luomajoki, A. 1993a. Climatic adaptation of Scots pine (Pinus sylvestris L.) in Finland based on male flowering phenology. Acta For. Fenn. 237:1--27.
Luomajoki, A. 1993b. Climatic adaptation of Norway spruce (Picea abies (L.) Karst.) in Finland based on male flowering phenology. Acta For. Fenn. 242:1--28.
Messenger, P.S. and N.E. Flitters. 1958. Effect of constant temperature environments on the egg stage of three species of Hawaiian fruit flies. Ann. Entomol. Soc. Am. 51:109--119.
Mirov, N. 1956. Photoperiod and flowering of pines. For. Sci. 2:328--332.
Pukacki, P. 1980. Temperature of Norway spruce and Scots pine buds. Arbor. Kórnickie 25:277--286.
Sarvas, J. 1977. Mathematical model for the physiological clock and growth. Acta For. Fenn. 156:1--25.
Sarvas, R. 1962. Investigations on the flowering and seed crop of Pinus sylvestris. Commun. Inst. For. Fenn. 53:1--198.
Sarvas, R. 1967. The annual period of development of forest trees. Proc. Finn. Acad. Sci. Lett. 1965:211--231.
Sarvas, R. 1968. Investigations on the flowering and seed crop of Picea abies. Commun. Inst. For. Fenn. 67:1--84.
Sarvas, R. 1972. Investigations on the annual cycle of development of forest trees. Active period. Commun. Inst. For. Fenn. 76:1--110. Shelford, V.E. 1927. An experimental investigation of the relations of
the codling moth to weather and climate. Ill. Nat. Hist. Surv. Bull. 16:307--440.
Wang, J. 1960. A critique of the heat unit approach to plant response studies. Ecology 41:785--790.
Wilkinson, L. 1990. Sygraph: the system for graphics. Systat Inc., Evanston, 547 p.
Wilson, J.Y. 1959. Duration of meiosis in relation to temperature. Heredity 13:263--267.