The Potential and Limitations of the Learning Outcomes
Based Approach to Education in Promoting Equity
Central-European Comparative Overview
By: Péter Radó
Policy making for equity in education in Austria, Czech Republic, Hungary,
Slovakia and Slovenia
Content
Introduction ... 3
The purpose of the comparative overview ... 3
Equity in education: the implications of the learning outcomes based approach ... 3
1. Regional equity patterns... 6
1.1. The Central-European regional pattern ... 6
1.2. The common feature of the region: high selectivity of education... 8
2. Digging deeper into selection: the dimensions of educational disparities... 12
2.1 Socio-economic status... 12
2.2 Ethnicity ... 16
2.3 Special educational needs... 18
2.4 Residential status... 20
2.5 Gender ... 21
2.6 The possible reasons for high selection pressure ... 21
3. Policy overview... 24
3.1 The policy implications of the regional pattern of inequities... 24
3.2 Mainstream policies for greater equity... 26
Setting goals ... 28
Empowerment of schools ... 28
Quality evaluation ... 29
Professional support ... 30
Targeted developmental intervention... 30
3.3 Supplementary policies ... 31
3.4 Underlying policy assumptions revisited ... 33
Introduction
The purpose of the comparative overview
The purpose of this paper is to summarize the findings of a joint project of the Austrian, Czech, Hungarian, Slovakian and Slovenian ministries of education on equity in education. However, this overview is pursuing more ambitious objectives than simply providing a summary of the country reports on equity in the participating countries. On the one hand, it attempts to create a regional comparative framework that allows for reflection on the policies of the individual countries, that is, aims at extracting the lessons that can be learnt by mapping out the similarities and differences among the countries. On the other hand this paper is an attempt to follow up on the thematic focus of the joint project of the five Central-European Countries, that is, on the potential and limitations of the learning outcomes based approach to education in promoting equity.
The introduction of this comparative overview briefly outlines how equity in education reconsidered in the light of the learning outcomes based approach to education. Part 1 of the paper describes the performance profile of the Central-European countries in comparison to other European regional patterns and attempts to determine the key features of the Central European region. Part 2 looks at the impact of different dimensions of social inequalities on learning in the five countries and the possible underlying reasons for the high selectivity of these education systems. Part 3 offers a comparative educational policy framework and reflects on the equity policies of the five Central-European countries through the prism of the learning outcomes based approach.
This overview is based on three major pools of sources: (i) the country notes on equity in education produced by experts commissioned by the ministries of education of the participating countries (Slovenia did not prepared a country report within the framework of this project but participated the two workshops and provided valuable information for this overview.), (ii) international comparative information provided mainly by the progress reports of the Lisbon process in the European Union and by the international student achievement surveys of OECD and IEA, (iii) for the characteristics of the educational systems the country files of the Eurydice database. In addition to these main sources of information other international reports and research results were used.
Equity in education: the implications of the learning outcomes based approach
The prevailing “mainstream” approach to equity is a rather balanced one: although, social background of the students determines their educational outcomes to a huge extent, still, education has certain space to compensate for the negative impact of low social status on educational outcomes. Therefore, the question is how to enhance this compensation capacity of schools? This balanced view is the underlying approach of the definition of equity produced by an OECD expert group in 1997: “Educational equity refers to an educational environment in which individuals can consider options and make choices based on their abilities and talents, not on the basis of stereotypes, biased expectations or discrimination. The achievement of educational equity enables females and males of all races and ethnic backgrounds develop skills needed to be productive, empowered citizens. It opens economic and social opportunities regardless of gender, ethnicity, race or social status.” (OECD 1997.) For many decades educational inequalities were dealt with almost exclusively within the framework of equal access to education. However, the focus of thinking was gradually shifted from access to teaching, from teaching to learning outcomes. This shift is not independent from the fact, that the inequalities as they are measured by rather traditional indicators (such as enrollment rates at different levels of education or dropout rates) show a rather favorable picture for most of the countries in Europe, especially in a global perspective. The real reason however for the need to reconsider the interpretation of equity in education is the emerging new paradigm of education science and educational policy: the learning outcomes based
approach. According to this, all aspects and subsystems of education are worth to consider
trough the lens of the very purpose of educational services: the results of learning.
The learning outcomes based approach is a paradigm that incorporates two parallel processes in the theory of educational policy: the gradual reconsideration of relevant knowledge in education, that is the shifting emphasis from prefabricated knowledge to applicable knowledge (i.e. competencies), and the development of the lifelong learning model that refocuses our attention from teaching to learning, from the education service providers to learning pathways. The reconsideration of relevant knowledge in education was forced by various reasons that mutually strengthened their impact, such as the increasing emphasis on instrumental aims of education, the collapse of the knowledge monopoly of schools, the flare of easily accessible knowledge and the transformation of the traditional academic frameworks for structuring knowledge. Parallel to this, as a consequence of the prevailing lifelong learning paradigm educational policies started to put greater emphasis on learning and the learner instead of teaching and the teacher, started to apply a holistic approach to education systems that calls for ever stronger connection among the different levels and strands of education, and strived to better adjust the supply of education services to the actual demand. Since sometimes even the obvious must be emphasized: when refocusing our attention from access, by learning outcomes we mean something rather different than pure knowledge; we mean the competencies (i.e. knowledge, skills and attitudes) that open room for further learning and the successful application of knowledge in very diverse working and social contexts. According to a simple but easily applicable definition provided by a CEDEFOP study “Learning outcomes are statements of what a learner knows, understands and is able to do after completion of learning.” (CEDEFOP, 2008.)
the launch of Definition and Selection of Competences (DeSeCo) program in 1997 that provided the underlying measurement framework for the first PISA survey in 2000. This work was followed up by the European Union by adopting a list of key competences that serves as a common reference framework. (Commission, 2005.) Although EU’s work program in Education till 2010 sets benchmarks that contain traditional and learning outcomes based indicators, too, the policy initiatives of the Union in the second part of the decade, such as the European Qualifications Framework are clearly based on the learning outcomes based approach. The first attempt to apply the learning outcomes based approach to equity in education is the work of the EU Cluster on “access and social inclusion in lifelong learning” that refers to equity as “strategies to diminish the correlation between educational outcomes and socioeconomic background of learners”. This approach creates a balance between the two approaches leaving the consideration of their relative weight depending on the various contexts of the individual countries.
1. Regional equity patterns
1.1. The Central-European regional pattern
Undertaking a mild risk of simplifications, we can identify three different regional patterns on the north-west/south-east axis of Europe. The Northern-European countries can be characterized by high level of social equity with fair distribution of high or medium quality educational services, that result in high average performance of their education systems. The other end of the axis is the group of South-Eastern European countries, where much larger social inequalities are combined with relatively poor quality education services. As a consequence, the average performance of the education systems of these countries is poor, too.
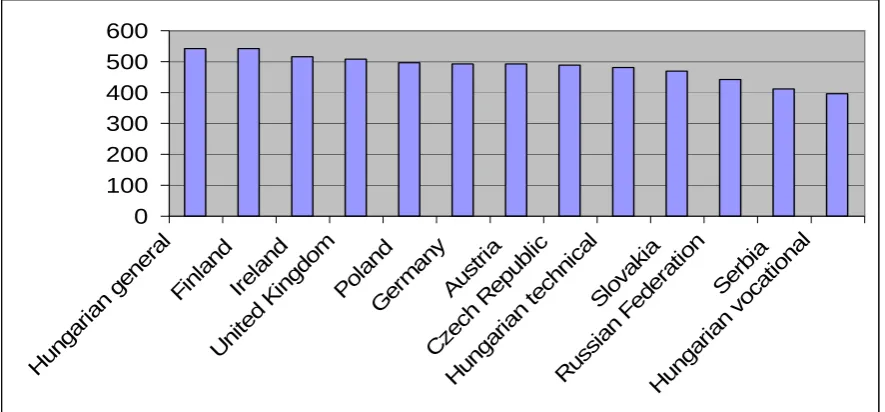
A rather clear regional patter in between is that of the Central-European countries. This pattern is clearly indicated by the average performance of the Central-European countries. For example according to the 2006 PISA survey the performance of the 15 years olds in reading is weaker than the OECD average, these countries score between 494 (Slovenia) and 466 (Slovak Republic).
Figure 1.1 Average literacy scores in selected European countries (PISA 2006)
Source: OECD PISA 2006.
As it was already mentioned, the equity of education systems can be measured by traditional, student attainment related indicators and learning outcomes indicators, as well. The common characteristic of the Central-European countries is the fact, that our judgment of the level of equity in these countries largely depends on the indicator (and the underlying approach) we chose. From a traditional point of view these countries perform rather well. For example, in relation to the proportion of early school leavers all of the five countries are among the eight top performers in Europe.
547
517 508 507 507 501 495 495 494 490 483 482 477 466 460 440
Figure 1.2 Early school leavers. The percentage of the population aged 18-24 with less than upper secondary education and not in education or training (2000 and 2007)
Source: Progress Towards the Lisbon Objectives in Education and Training 2008.
However, if we look at equity in terms of learning outcomes in these countries the picture is very different. For example, in the proportion of those 15 years olds whose reading competencies are at the level of 1 or lower the results of these countries disperse around the EU 27 average.
Figure 1.3 Percentage of pupils with reading literacy proficiency level 1 and lower on the PISA reading scale (2000 and 2006)
Source: Progress Towards the Lisbon Objectives in Education and Training 2008.
The above mentioned regional patterns along the north-west/south-east axis of Europe are very much visible in this respect, too. For example, while the proportion of students with very poor reading competencies is the lowest in the Scandinavian countries, their percentage in Bulgaria and Romania was more than half of the 15 years olds in 2006.
Performance characteristics
North-Western European Countries
Central-European Countries
South-Eastern European Countries Access and
participation related
problems Mild Mild Serious
Average learning outcome performance
Good Medium Poor
Inequalities in terms of learning outcomes
Mild Medium Strong
When referring to specific regions in Europe with common heritage and similar characteristics of their education systems most probably we handle the former communist countries or the countries of the former Yogoslavia as distinct regions. In fact, there are several aspects of the performance and the systemic features of the education systems of these countries that show remarkable similarities. However, if we dig deeper into the performance profile of these countries we find out, that these regional borders do not necessarily work out. For example, the analysis of the results of the PISA survey suggest, that Poland is much closer to North-European performance patterns than to the clearly Central-European neighboring Czech Republic. Also, in this respect Slovenia and Croatia is much closer to the Central-European regional pattern than to Serbia. Therefore, when pursuing an obviously valid and relevant regional approach to educational problems we should not mix these regional patterns up with the old political structure of Europe.
1.2. The common feature of the region: high selectivity of education
According to most analysis, the similarity of the results of the Central-European countries is caused by the most striking common feature of their education: the high level of selectivity of education systems. The analysis of the data of student achievement proves, that bigger performance differences among the schools leads to lower overall average performance of the system.
Figure 1.4 Between school variance explained by the PISA index of economic, social and cultural status of students and schools 2006
What is even more striking is the impact of selection on learning outcomes. For example, according to the PISA 2003 results for Austria the difference between the performance of students in academic secondary schools and general secondary schools (ISCED 2) is 100 points in literacy and 88 points in math. (Simon, 2008) The same survey revealed even greater performance gap among the three strands of the Hungarian secondary schools (ISCED 3). The difference between the average performance of students in general secondary schools and in vocational schools is 148 points in literacy and 146 points in math. In Hungary, where education seems to be the most selective system among the Central-European countries there are sub-systems that perform at the level of effectiveness of the most successful countries, while there are others underperforming the effectiveness of any European countries. Data suggest that – although the extent of the impact of selection varies - this pattern prevails in other countries of the region, too.
Figure 1.5 The average literacy performance of students in the three Hungarian secondary schools types in international comparison (PISA 2003)
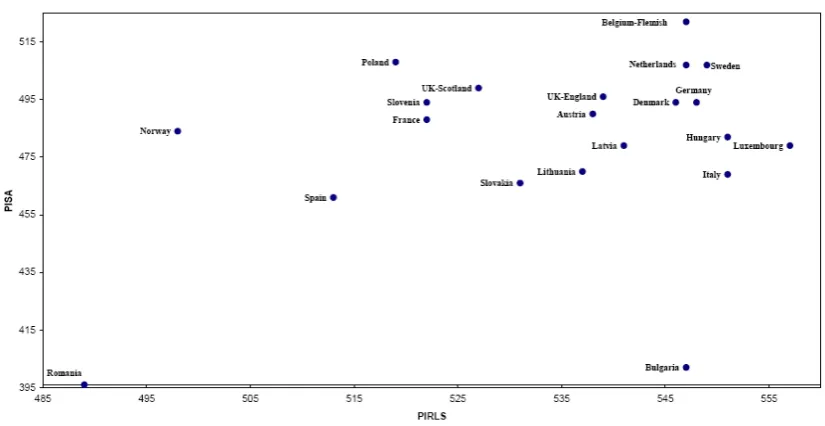
Obviously, disparities measured in the age of 15 arise much earlier. The question is: when and where? Getting the answer is supported by the fact that four countries of the region (Austria, Hungary, Slovakia and Slovenia) participated in the PIRLS survey, too. Although, both surveys measure reading skills, they are not directly comparable. PIRLS measure the competencies at the end of grade 4 (10 years olds) and the tests refer to a common curricular basis. PISA measure at the age of 15 and it is disconnected from curricula, its measurement framework is created on the basis of definition of competencies in the DeSeCo project of OECD. However, exactly these are the differences that are making the comparison of PIRLS and PISA results interesting.
In international comparison all of the four Central-European countries performed better in PIRLS than in PISA. Due to the above mentioned differences between the two surveys it can be interpreted in two possible ways: (i) education in these countries is much more focused on curriculum knowledge than on everyday practical competencies, (i) younger students are better prepared in literacy competencies than students in the age of 15. Bearing in mind everything what we know or presume about typical teaching styles in the schools of the region we may assume that teaching is still very much oriented to curricular knowledge. Since the reconsideration of desired learning outcomes is an ongoing process in all of these countries, in spite of deliberate policies aiming at supporting the realignment of teaching there was not enough time for it. The other interpretation seems to be applicable to the schools of the region, too. From grade 5 classroom teaching is replaced by subject teaching. Although, it happens together with the change of schools only in Austria, this shift is not less dramatic in other countries of the region. The alignment, goals, style and methods of teaching are still very much different in grade 4 than in grade 5, subject teaching is not oriented towards the development of practical competencies anymore. (According to a Hungarian saying, till grade 4 teachers teach children, from grade 5 they teach subjects.) To sum it all up, most probably it is the last two years of ISCED 1 and ISCED 2 are the levels where the attention of policies should be focused at.
Figure 1.6 Country performance in PIRLS and PISA (2006)
Source: Progress Towards the Lisbon Objectives in Education and Training 2008.
2. Digging deeper into selection: the dimensions of educational disparities
The source of educational disparities is the impact of a wide range of social inequalities. These social dimensions (and very often their combinations) may all impose a negative impact on learning. In order to understand the educational mechanisms that connect social disadvantages with school failure we have to estimate the relative weight of the different dimensions of inequalities and their relevance to educational outcomes. This is what we call the equity profile of the education system. Mapping out the equity profile of education systems is instrumental for estimating the capacity of schools to compensate for the negative impact of social disadvantages. (Although, it is beyond the scope of this report country-based analysis may judge upon the changing weight of the different dimensions on the basis of the analysis of longitudinal data.)
In this overview we are focusing on five major social dimensions: Socio-economic status
Ethnicity
Personal abilities (in education referred to as special educational needs) Residential status
Gender
Educational policy making in the participating Central-European countries do not equally emphasize the different dimension of inequalities. It is partly due to the different weight of certain dimension in these countries, but it also reflects the perception of the importance of the various possible sources of educational disparities. In addition to these, quite obviously, available information shapes the policy agenda. If certain types of information are not accessible certain types of educational disparities will remain invisible. (We will return to the information needs of policy making in the following sections.) When trying to better understand the common regional patterns of inequities briefly outlined in the previous section by mapping out the similarities and differences of the equity profiles of each country, an attempt will be made to make a distinction between the relative weight and the policy perception of the different dimensions.
2.1 Socio-economic status
The socio-economic background of the children entering formal schooling in the Central-European countries is a little bit more favorable than the Central-European average; the proportion of those children whose parents’ attainment is less than upper secondary education is lower, the proportion of those with upper secondary attainment is higher than the European average. In terms of proportion of parents with higher education only the Eastern-European former communist countries have less favorable data than the EU average.
Table 2.1 Children aged 3 to 6 by the education level of parents
Educational attainment of the parents % Country
Low Medium High
Czech Republic 5,66 73,41 20,93
Hungary 16,30 61,44 22,26
Austria 10,57 61,42 38,00
Slovenia 4,94 57,03 38,03
Slovakia 9,72 71,94 18,34
EU 27 average 18,96 47,74 33,29
Source: Progress Towards the Lisbon Objectives in Education and Training 2008.
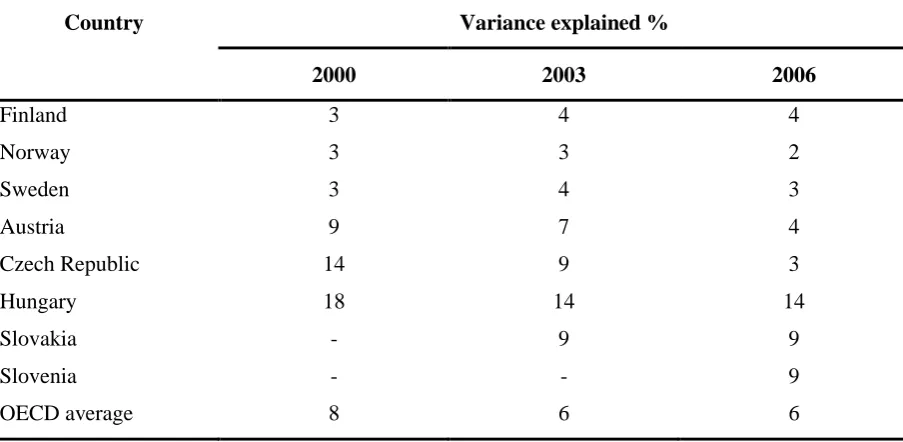
As far as the impact of the family’s socio-economic status on learning of the students is concerned, it is the most strongly emphasized dimension of educational disparities in the Central-European countries – for good reasons. The analysis of PISA results clearly demonstrates that educational attainment has a great influence on learning results, especially in Hungary, Slovakia and Slovenia. This relationship is getting weaker in Austria, and to a huge extent in the Czech Republic. (The dramatic decreasing of the extent to which parents’ education explains the variance of the reading results in the Czech Republic calls for deeper analysis, especially in the light of other data, for example, the increasing proportion of students performing at the proficiency level 1 or lower in PISA, or the very strong influence of the occupational status of the parents.)
Table 2.2 Effect of the highest level of parents’ education on student performance in reading since PISA 2000 (selected European countries)
Variance explained % Country
2000 2003 2006
Finland 3 4 4
Norway 3 3 2
Sweden 3 4 3
Austria 9 7 4
Czech Republic 14 9 3
Hungary 18 14 14
Slovakia - 9 9
Slovenia - - 9
OECD average 8 6 6
Table 2.3 Effect of the highest occupational status of parents on student performance in reading since PISA 2000 (selected European countries)
Variance explained % Country
2000 2003 2006
Finland 6 5 6
Norway 8 7 8
Sweden 8 7 8
Austria 13 15 11
Czech Republic 15 10 13
Hungary 17 13 13
Slovakia - 12 11
Slovenia - - 13
OECD average 11 9 10
In the Central-European countries the socio-cultural status is a very strong aspect of social stratification, especially in comparison to the Scandinavian or South-East European countries. It is even more important if education heavily builds on the work of the students at home, as it is the case in the region. Therefore, with the exception of Slovakia, the impact of this background variable is bigger in the region than the European average.
Table 2.4 Reading performance of students by the level of cultural possessions in the home (PISA 2006) (selected European countries)
Country Students with a low level of cultural possessions in the
home
(Bottom quarter of the index)
Students with a high level of cultural possessions in the
home (Top quarter of the
index)
Difference
Finland 514 570 56
Norway 443 520 77
Sweden 475 536 61
Austria 458 537 79
Czech Republic 446 523 77
Hungary 426 515 89
Slovakia 426 487 61
Slovenia 452 528 76
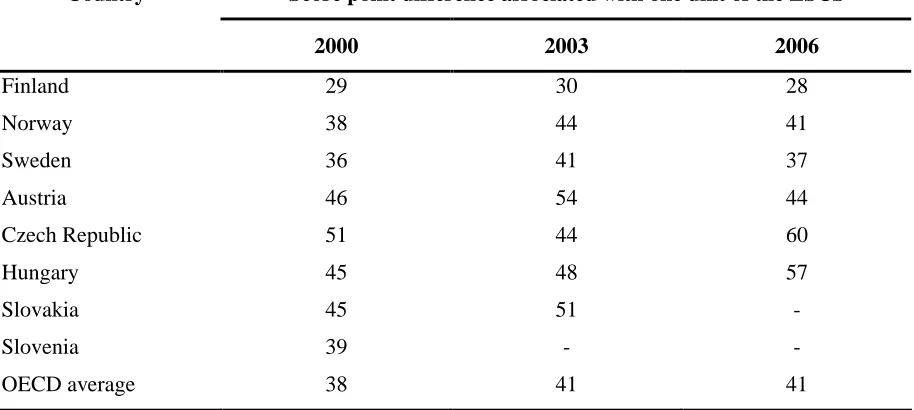
The economic, social and cultural index of PISA (ESCS) combines the above mention social background indicators. Not surprisingly at all, even minor changes in this index may result in great achievement differences in the Central-European countries. It is not a too much brave assumption that this great impact of socio-economic and socio-cultural background on learning is to a certain extent the result of the selective nature of these education systems.
Table 2.5 Relationship between student performance in reading and the PISA index of economic, social and cultural status (ESCS) 2000, 2003 and 2006 (selected European countries)
Score point difference associated with one unit of the ESCS Country
2000 2003 2006
Finland 29 30 28
Norway 38 44 41
Sweden 36 41 37
Austria 46 54 44
Czech Republic 51 44 60
Hungary 45 48 57
Slovakia 45 51
-Slovenia 39 -
-OECD average 38 41 41
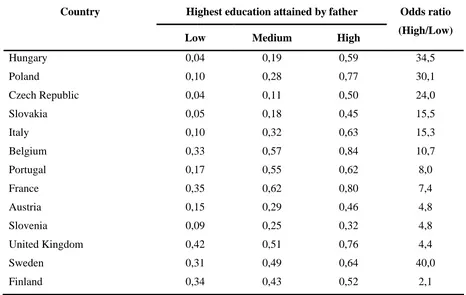
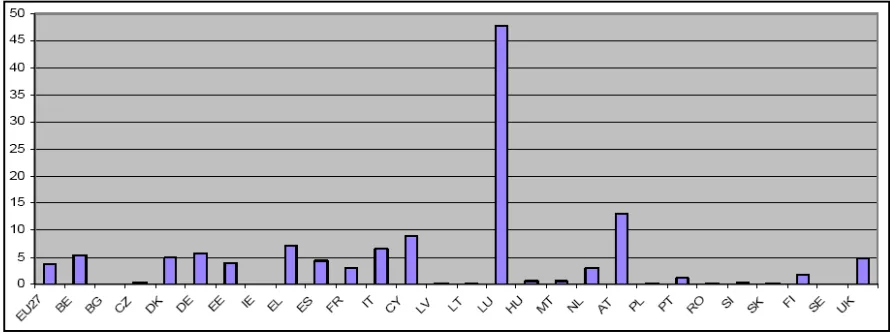
Table 2.6 The probability of attaining higher education by the education level of the father of 25-34 olds in selected European countries
Highest education attained by father Country
Low Medium High
Odds ratio (High/Low)
Hungary 0,04 0,19 0,59 34,5
Poland 0,10 0,28 0,77 30,1
Czech Republic 0,04 0,11 0,50 24,0
Slovakia 0,05 0,18 0,45 15,5
Italy 0,10 0,32 0,63 15,3
Belgium 0,33 0,57 0,84 10,7
Portugal 0,17 0,55 0,62 8,0
France 0,35 0,62 0,80 7,4
Austria 0,15 0,29 0,46 4,8
Slovenia 0,09 0,25 0,32 4,8
United Kingdom 0,42 0,51 0,76 4,4
Sweden 0,31 0,49 0,64 40,0
Finland 0,34 0,43 0,52 2,1
Source: Progress Towards the Lisbon Objectives in Education and Training 2008.
2.2 Ethnicity
Another possible and equally strongly emphasized dimension of social inequalities is the ethnic background of students. No doubt, in three out of the five countries (Czech Republic, Slovakia and Hungary) this dimension is almost completely associated with the educational failure of great proportion Roma students. Also, this question is widely be considered as the greatest failure of these education systems; in spite of almost two decades of efforts and investments to the improvement of the educational achievement of Roma students the results are almost invisible.
Table 2.7 The estimated number and proportion of Roma students in the Central-European countries.
Country Estimated Roma population (thousands)
The estimated proportion of the Roma population
(%)
Estimated number of Roma
children under 18 (thousands)
Estimated percentage of Roma children
under 18 (%)
Czech Rep. 160 – 300 2,25 110,4 48,0
Hungary 550 -600 5,69 245,5 42,7
Slovakia 350 – 370 6,67 156,6 43,5
Slovenia 7 - 10 0,43 3,9 46,4
We are a little bit better supplied with learning outcomes data in relation to the other form of ethnicity: the education of students with migrant background. However, in the Central-European region it is only Austria, where the number and proportion of migrants places this aspect on the educational policy agenda. One of the many indications of the relative failure of immigrant students is provided by the 2006 PISA survey. According to its results in Austria the reading performance of first generation immigrant students was 48 points, that of the second generation students was 79 points weaker than the performance of the native students. These differences were bigger than in Austria only in Belgium and Germany in Europe.
The other country that has relatively big immigrant population is Hungary, but the huge majority of immigrants moving to Hungary mainly in the first part of the nineties were ethnic Hungarians from the neighboring countries. Hungary also has a relatively big Chinese immigrant population. We have no evidences about their educational performance, only anecdotal information suggests that they are not performing poorly in comparison to the native students.
Figure 2.1 Percentage of children aged 3 to 6 with migrant background of the total number of children in the same age in 2006.
Source: Progress Towards the Lisbon Objectives in Education and Training 2008.
much on immigrants, the Czech, Slovakian and Hungarian agenda is very much dominated by the education of the Roma children, while in Slovenia ethnic affiliation is not an outstanding equity issue. However, due to the massive population decline of the countries of the region and their increasing global linkages will increase the importance of education’s capacity to provide success for immigrant students beyond Austria, too.
It happens very often that the educational problems of immigrant and Roma students are dealt with separately. However, we may assume that the reasons for their failure are rooted in the very same deficiencies of the education systems. In other words: we can’t assume, that if an education system is not able to provide learning success for Roma children it will able to do this for immigrant children. One of the indications for the similarity of underlying reasons is the fact that immigrant students in Austria and Roma students in the Czech Republic, Slovakia and Hungary are equally overrepresented in special education.
Another type of ethnic affiliation with educational relevance is the case of national minorities living in all of the countries of the region in a big number. Although, most observers and policy makers are convinced that the performance of the students with national minority affiliation is not worse than that of the majority students it is not supported by evidences either.
Figure 2.2 Percentage of early school leavers with migrant backgrounds 2006.
Source: Progress Towards the Lisbon Objectives in Education and Training 2008.
2.3 Special educational needs
Table 2.8 Percentage of pupils in compulsory education recognized as having special education needs (in all educational settings) 2006 and 2008.
Country 2006 2008
Source: Progress Towards the Lisbon Objectives in Education and Training 2008.
The question that attracts more and more attention is the level of separation of these children in education. This policy problem is already on the policy agenda in Austria since the eighties, in other countries of the region it became one of the major equity requirements only at the second part of the nineties. In addition to the genuine special educational needs related considerations integration became one of the most widely discussed problems because of its strong links to the problems of the education of Roma students. (In the Czech Republic, Slovakia and Hungary Roma students are very much overrepresented in special education settings that considered as one of the many ways of ethnic segregation.) Although, the increasing pressure for integration in the Czech Republic and in Hungary resulted in the decrease of the proportion of children with special needs educated in segregated settings, it is still very high. In Hungary where the decline of segregation of special needs children is significant there is no evidence suggesting that it went together with the improved inclusion capacity of schools. Integration without preparing the schools for inclusion called “rigid integration” that not necessarily provides better learning environment for special needs children.
2.4 Residential status
The most obvious example for the fact, that the educational policy agenda is very much shaped by the available data is the fact, that the only country contribution to a comparative overview on equity in education addressing the impact of residential status on learning is the Hungarian one. The reason for this is the fact, that the PISA survey and other international surveys that are the major sources of understanding of inequalities of learning outcomes are based on sampling, therefore, they are not providing representative data for this dimension. (Of course, statistical data on participation patterns are available in all of the respected countries.) In Hungary however, the “National Assessment of Competences” since 2001 immediately drove the attention to the “settlement slope” of basic competencies.
Table 2.9 The average performance of Hungarian students in reading and math learning in the schools of different settlement types (2004)
Literacy Math
Settlement type
6. grade 10. grade 6. grade 10. grade
Budapest 542 523 539 522
County seat town 533 510 532 510
Small town 507 484 502 480
Village 484 437 478 432
Source: National assessment of competencies 2004.
However, further analysis of these results proved that this unequal distribution of learning outcomes is not necessarily caused by the quality differences of education that the schools of different settlement types offer. With the use of the “SES added value index” the number of schools that underperforming or performing better than it is expected on the basis of the social composition of their student intake can be estimated. In this respect, the small schools of small villages do not necessarily perform very differently, than any other schools. In other words, the different learning outcomes of students in the schools of different settlements are caused by the different social composition of the students. (Kistelepülések kisiskolái, 2005.) Having this in mind we are getting back again to the huge impact of socio-economic status. In spite of these findings, the weight of settlement differences is still very high on the Hungarian equity agenda.
Table 2.10 Socio-economic added value: the performance of schools in relation to their expected performance in math and literacy.
Schools with better performance than expected (%)
Schools with weaker performance than expected (%)
School type
Math Literacy Math Literacy
Small schools of small villages
10 9 7 9
National 7 6 7 8
2.5 Gender
The problem of gender differences in learning outcomes is another example, in this case for the fact that even well documented disparities are not necessarily influence heavily the educational policy agenda. As the PISA survey demonstrated the literacy performance of boys is better and the underperformance of girls is bigger in the Central-European countries than the OECD average. In spite of this fact, the only country of the region where this dimension is on the educational equity agenda is Austria. Other countries of the region also address this dimension of performance disparities but the intensity of policy intervention is lagging far behind in comparison to the increasing weight of the problem.
Table 2.11 Gender differences in reading performance (PISA 2006)
Country Gender differences (M-F)
Czech Republic -46
Austria -45
Slovakia -42
Hungary -40
OECD average -38
Gender differences in terms of learning outcomes are combined with two other possible types of problems: the different participation patterns in formal schooling for male and female students and the socialization impact of education that helps the survival of unequal power distribution between men and women.
2.6 The possible reasons for high selection pressure
The brief overview of the equity profile of the education systems of the five Central-European countries on the previous pages clearly demonstrate that – probably with the only exception of gender inequalities – all disparities of measured learning outcomes has something to do with the very selective character of these systems. In fact, selection intensifies the effect of all these dimensions of social inequalities on learning outcomes. However, the most important question still remains unanswered: what are the reasons of the high selectivity of these systems? In other words: what are the characteristics of the education systems of the Central-European countries that generate the high pressure for selection and segregation?
In order to answer this question we definitely need more educational research beyond the measurement of the learning outcomes of students. Nevertheless, a short distillation of certain findings may orient further research without offering more than “educated guess” on the underlying reasons for selection. The following possible problems may all contribute to the pressure for selection and segregation. However, what is important is their summative impact, they don’t necessarily explain high selection alone.
School structure.
academic secondary schools that is creaming the best achieving students off in the 7t grade of primary schools. However, the example of several other European countries show, that school structure does not necessarily makes selection unfair to this extent. The question is rather the way how enrolled students are selected if there is a shortage of places in certain school types. The closer the selection method brings the process to a meritocratic ideal is obviously the smaller space for affluence of the better-off. There are experiments with using lottery for selection. This is a fair selection procedure, indeed. However, it has nothing to do with the actual performance of students. Probably the better approach is adjusting the capacities to the needs as possible and using selection mechanisms that are based on the standardized external measurement of the key competencies of students.
Pedagogical methods: the lack of differentiation.
The fact that in homogeneous classrooms the traditional teaching methodologies contribute to the generation of greater learning outcome disparities among schools, therefore, result in lower average performance of the whole system was already mentioned. What we should also see is the impact of this pedagogical pattern on school enrollment policies and on the way how learning is organized within the schools. The traditional way of teaching (the so called “frontal teaching”) that is characterized by the lack of the use of the methodological toolbar of differentiation and the lack of individualized approach to teaching generates pressure to form homogeneous, “easily teachable” classes. The most important characteristics of traditional teaching are the following: whole class instruction dominates, coverage of text and curriculum drives teaching, a single text prevails, a single definition of excellence exist, assessment is almost exclusively summative at the end of learning, student differences are acted upon when problematic, teachers drive student behavior and teachers solve the problems, time is relatively inflexible. (Tomlinson, 1999.) Since this type of teaching has to face serious difficulties in a classroom of students with diverse backgrounds to what methodological adjustment would be needed, it generates a “self-protection” drive to guide students who would “cause problems” to special education settings. This is the underlying reason why the extent to which certain student groups can be educated in integrated setting is determined by the preparedness of ordinary schools in the first place.
Written and walking curricula.
The lack of differentiation is typically combined with elitist expectations towards children. Even if the problem of “curriculum overload” is solved by fully competence-based national core curricula that is completely free from content (as in the case of Hungary) the expectation of the teachers may remain elitist. In addition to this, determining goals to be pursued in schools and the content of education is very much the monopoly of the “profession” (i.e. that of teachers and subject experts who are developing curricula and school programs). As a consequence, setting goals from educational services is not detached from the actual design of curricula and programs. It is important to note here that elitist expectations (that are based on the cultural code of the educated middle class, therefore, that have an exclusive impact for low status students) are not to be mixed up with high expectations that are individualized and mainly oriented towards the success of learning.
Biased expectations.
supplemented by external pressure for segregation by those social groups whose influence on the most important decisions on the school is great. Very often schools can’t resist to this pressure even if they have the intention to do so.
The negative side-effects of decentralization.
As it will be seen on the following pages decentralization is one of the most important conditions for achieving greater equity in education. The countries of the region are at different stages of education sector decentralization. This process ensures a bigger space for schools to adjust teaching strategies, the organization of learning, institutional policies and the internal allocation of financial and human resources to the actual composition of students they educate. However, decentralization has certain counter-productive side-effects, too, that call for deliberate intervention. For example, strengthened institutional school autonomy in determining enrollment policies, as well as in determining the profile of education provided by the schools is in most cases combined with free choice of schools. In an internal and external environment in which the pressure for selection is great it leads to the well known phenomenon in the region: the “white flight”. It means that if the number or proportion of Roma or immigrant children reaches a certain level the white middle-class parents bring their children to another school that leaves the original school with an almost homogeneous Roma or immigrant student group. Another potential shortcoming of decentralization is its possible impact of unequal distribution of all sorts of resources that are essential in ensuring equity in education. If public administration and fiscal decentralization is not matched with appropriate policy coordination mechanism and financial equalization schemes decentralization may generate greater differences among schools.
Financial and organizational interests.
The combined effect of the declining number of students due to demographic reasons, the per capita based financial allocation system and the rigidity of the system in perpetually adjusting the capacities to the number of students are the reasons for the strong competition among schools for the “enrollable” children. (This is stronger in countries with per capita financing systems like Hungary or Slovakia, and weaker in Austria, where the compensation of teachers is rather centralized.) The winners of this competition are those schools that are able to offer attractive programs already in the first grade that leads to strong early selection. Certain policies artificially generate interest for segregation by rewarding special education programs or Roma education programs with supplementary funding. An additional aspect of organizational interests is the way how the principles of schools are selected and how their work is evaluated. If teachers have a voice in their selection and if the performance of principles is not evaluated by the owners of the schools on a regular basis their primary reference is the inner world of the schools and not the expectations set by education management agents outside of the schools. In these cases – and it is typical for the Central-European region - the principles are the prisoners of the “self-protection” efforts of teachers, whose work is not judged upon the success of the schools either.
3. Policy overview
3.1 The policy implications of the regional pattern of inequities
As it was seen in the previous sections the huge majority of educational disparities that can be described by the traditional indicators of participation (dropout and repetition rates, enrollment in low value added programs and dead end strands of education, early school leaving, etc.) are generated by the failures of learning. Identifying inequities in terms of learning outcomes allows for better understanding the reasons for school failures and allows for adjusting the policies to the specific context within which inequities are generated. We also saw that this context have certain very important similarities in the Central-European countries, especially the selective nature of the education systems that is demonstrated by the social sorting of students and by the strong power of between school differences in explaining the variance of learning outcomes. In fact, unfair selection increases the negative impact of the different dimensions of social inequalities on learning and individual schools are not able to compensate for these effects.
What are the implications of this pattern for the policies aiming at reducing educational disparities that are considered to be illegitimate? At this point it might be worth returning to the already mentioned three regional patterns along the north-west/south-east axis of Europe. In the Scandinavian countries that are characterized by low social sorting among schools, (i.e. the mainstream system is rather equitable) direct targeted development of the students at risk of failure is appropriate. In the South-Eastern European countries, where social sorting of the students is lower than in the Central-European countries, but the internal effectiveness (performance) of education is poor, heavy investment into the improvement of quality of educational services of all schools seems to be the appropriate approach.
In between of these two regions, the most effective policy alignment might be also a type of policy in between: addressing the quality of education in those schools that are underperforming. It was already suggested by the PISA 2003 report: “Another key issue is whether to target low-performing schools or students. The proportion of performance variation between schools, (…) can provide a useful indicator in judging the appropriateness of particular policy approaches. If there is little performance variation between schools, as in Canada, Denmark, Finland, Iceland, Ireland, Norway, Poland or Sweden, then within-school policies aimed at improving the performance of low performing students are likely to be more effective. By contrast, in countries such as Austria, Belgium, the Czech Republic, Germany, Hungary, Italy, Japan, the Netherlands and Turkey, large performance differences between schools would suggest that policies should target low-performing schools, at least within each type of school where the education system is stratified.” (OECD PISA 2003.) This – unfortunately not very much noticed conclusion of the PISA survey – also suggest that the type of intervention that offers greater chances for success are targeted at certain schools, and not certain student groups.
policy toolkit (policy model) that designed to respond to the specific obstacles to learning success:
The roots of Roma underachievement The appropriate type of policy Poor quality of educational services
(Roma students are enrolled to underperforming schools)
Targeted school improvement
(color blinded mainstream policy, targeting underperforming schools regardless of the ethnic composition of students)
Interethnic relations
(status differences among Roma and non-Roma, demography, institutional support)
Affirmative action - often called: positive discrimination
(supplementary, color conscious preferential and developmental measures)
Minority rights
(access to culture and mother tongue instruction, involvement of self-organized minorities)
If we look back to the last decade of educational policies of the Czech Republic, Slovakia and Hungary what we see is huge investment into the improvement of the education of Roma students with very modest result. (The same applies to all sorts of programs of international donor agencies.) Of course, sometimes there are illusionary expectations towards education in this respect. However, the relative failure of education is well documented. One of the underlying reasons for this failure is the fact that these policies and developments fall under the category of supplementary policies, while – due to the lack of targeted school improvement - the main features of the education system remained untouched. In other words: what really matters is the capacity of the whole education system, especially, that of the individual ordinary schools to achieve a minimum level of equity for all students regardless of their ethnic background.
This logic does not apply only to the education of Roma students. Without the targeted development of underperforming schools the separation/segregation pressure of the system hardly can be reduced and the impact of supplementary measures will remain relatively limited. Also, this is the main reason why the many good practices of particular schools remain isolated and can’t be scaled up. Obviously, without generating demand by generating development in the underperforming schools the available good practices and working solutions will not be applied in other schools.
Having this problem in mind, let’s look at the recent measures and programs of the participating countries as they are outlined in the country reports. The brief overview of policies in the following sections is based on the distinction between mainstream and
supplementary policies. Mainstream policies are changes in the whole education system that –
“mainstreaming” for the integration and inclusion of particular students groups. Nevertheless, in most cases successful mainstreaming is the results of successful mainstream policies.) Supplementary policies are targeting certain student groups or may target entire levels or segments of the system for the sake of solving specific problems of particular students groups.
“Mainstream policies” “Supplementary policies”
The self-evaluation based school improvement efforts of the staff and management of schools is in the focus
The additional support provided to students, teachers, schools and other actors is in the focus
Aims at improving equity of the entire system
Aims at improving the leaning success of specific student groups
Target underperforming schools Target specific student groups Based on the identification of
underperforming schools
Based on the classification of targeted students groups
Uses the instruments of governance of education that are adjusted to this purpose
Its specific measures are implemented by incremental policy making or by
development projects
3.2 Mainstream policies for greater equity
This section is based on a specific underlying assumption. Obviously, promoting quality, effectiveness and equity in education are sometimes contradictory goals. However, - in spite of the many different trade-offs - within the already outlined context of Central-European countries targeting underperforming schools and promoting differentiated teaching in all classrooms may well serve all of the three wider public policy objectives. At the level of this generality these goals are not contradictory, at all. Having said that, we should be aware of the fact that at the much more concrete level of the actual design of policies and policy instruments, there are almost always offs to be considered. One example for these trade-offs might be the design of tests that serve the external assessment of the achievement of students. These tests may serve formative (quality improvement) purposes or summative (accountability) purposes. Since one test fits only to one purpose, the entire quality evaluation system should create the balance between the two equally important aims.
The point of departure for any mainstream policies is the fact, that only the deliberate and systematic development efforts of the staff and management of the schools can solve any problems. Putting it in a different way: schools can not be developed from outside. School
improvement (that is in fact identical with school-based quality management systems that are
From this point of view there are quite big differences among the five Central-European countries. Self-evaluation is the mandatory task of the schools in Austria, in Hungary and since 2007 in the Czech Republic but this activity is still not properly supported and incited in any of these countries. It is recommended to Slovenian schools but hasn’t made mandatory by any regulation. In Slovakia there is no such expectation set towards the schools. In general, self-evaluation based school improvement is an essential area for development in all of these countries.
Mainstream policies are built on school based development, therefore, their primary purpose is to create a systemic environment around the schools that makes it happen. The framework for mainstream policies is outlined by the Hungarian country report. (Keller, 2008.) This framework is the “governing by learning outcomes” model. It is based on the following algorithm: (Radó, 2008)
Setting easily interpreted minimum standards, that is, goals and targets determined in
terms of competencies for all schools;
Empowerment, that is, ensuring the necessary space and autonomy that allows the school
to adjust teaching, organization of learning, institutional strategies, policies and processes to the new external expectations;
Quality evaluation, that is, external evaluation (whole school inspection), regular
measurement of the achievement of students (i.e. the performance of school) and feeding back the evaluation/assessment results;
Demand driven external professional services for schools and teachers that adjust to the
very diverse development needs of schools;
Intervention, that is, identification of underperforming schools and targeted developmental
intervention.
Setting standards, evaluating, assessing and feeding back the extent, to which these goals are met by the schools and targeted intervention in case of poor performance altogether compose a full performance management system in education.
Figure 3.1 The educational policy model of “governing by learning outcomes”
The most important limitation of this approach is the fact, that it can not be applied without having certain – sometimes quite expensive – systemic conditions in place. However, without deliberate investment into these systemic conditions education systems with the already described characteristics of the Central-European countries hardly can be made more equitable. A brief overview on the extent to which the necessary instruments are in place in the countries of the region is necessary in order to grasp the capacity of these education governance systems to develop and implement mainstream policies.
Setting goals
As far as the mechanism of setting targets for schools are concerned that can be easily interpreted and translated into school and teaching strategies (i.e. setting targets in terms of required student competencies) all countries made serious steps. For example, the Czech Republic and Slovakia are in the implementation stage of major curricular reforms. In relation to content regulation (input/process and outcome regulation) there are two distinct patterns in use. In the Czech Republic, Slovakia and Slovenia outcome standards are incorporated into curricular documents. In this system of regulation setting achievement standards (output regulation instruments) separate from the national curricula and programs (input regulation instruments) would be redundant. It raises the problem that seems to be relevant for an equity point of view that issuing separate curricular frameworks for different specific educational purposes (such as special education, art education, education of minorities, etc.) almost automatically leads to separate sets of standards. However, there is an important question: how many standards are needed in order to set common minimum requirements for schools? There is a widely shared opinion according to which inputs and processes should be adjusted to different aims and specific students groups but minimum standards should be applied to all schools and all students. The pattern of content regulation in Austria and Hungary is different, in these systems curricular and outcome regulation is more separated. However it is only Austria that has started to develop a new output regulation mechanism; Austria already started to implement standards for grades 4 and 8 and for Vocational Education and training. In Hungary the only standards in place is the examination requirements for the high school graduation exam; there are no standards in use for imposing backward regulatory impact for primary and lower secondary education, these levels are still process regulated.
Empowerment of schools
Quality evaluation
In terms of making quality evaluation systems able for the purpose, the overall picture is a little bit less positive. The Czech, Austrian and Slovenian external school evaluation mechanism is more or less up to the task, the transformation of the old control oriented inspection in Slovakia also has started. In Hungary – although in theory the task is deployed to the owners of the schools – in fact external whole school evaluation does not exist. As far as regular measurement of the competencies of all students (i.e. the performance of the schools) is concerned, the pattern is exactly the opposite as we have seen in relation to inspection. The only country operating a full scale testing system is Hungary since 2001 (the National Assessment of Competencies). However, the Hungarian measurement system is actually used exclusively for formative purposes, therefore, the accountability functions (i.e. identifying underperforming schools, publishing the aggregated results of schools) are not ensured. The Czech Republic experimented with several measurement projects, Slovakia tested all 9th grade students in 2007 and Austria is setting up the necessary testing administration framework in connection to the trial of the new standards. The experience accumulated in these projects and developments are providing a good basis for further development of the measurement systems in these countries.
The lack of information on the performance of students and schools produced by external assessment causes an additional problem. Since information shapes policy, the lack of information leaves policies unshaped. In other words: until the information basis of policy-making is provided mainly by traditional statistical data policies will remain basically inputs and processes oriented.
It is important to note here, that standardized external secondary school leaving exams (that exist in Slovenia and Hungary and planned to be introduced in the other countries, as well) do not replace external assessment. Due to the high individual stake of these examinations tests are not designed to produce reliable comparable feedback on the performance of schools. (It is clearly demonstrated by the distribution of the results of the Hungarian high school graduation (érettségi) exam.)
Professional support
With the exception of Hungary, professional services provided to schools are typically supply driven systems but they can made more responsive to the diverse development demand of the schools. However, even in Hungary the large investment into the development of education funded by EU structural fund resources makes the initially demand driven professional support system very much driven by central government agendas. (Regardless the way how the support system is organized, making its services quality assured is one of the key conditions of successful development in the schools.)
Targeted developmental intervention
Since the quality evaluation systems are not yet capable to identify those schools that are underperforming (in the case of Hungary it is not designed and used for this purpose) the targeted mandatory development based intervention in these schools is not possible. Certain countries may use target substitutes, such as in the case of the Hungarian Vocational School Development Program (2002-2006), by which the development of an entire underperforming segment of the school system was attempted. A similar temporary solution would be in Austria to focusing development efforts to general secondary schools.
Since combating school failure by improving the results of underperforming schools is a genuine effectiveness problem, when designing the content of mainstream intervention it is worth turning to the large school effectiveness literature. The following list of the key characteristics of the effective schools is a distillation of this literature and serves mere demonstration purposes.
What works in general? Achievement focus, high expectations.
Good leadership.
The cohesion of the teaching staff.
School program, rich learning opportunities. School climate.
The self-evaluation capacity of the school. Classroom climate.
Planned and structured teaching.
The effective use of learning time, self-managed learning. Differentiated teaching.
Monitoring of the progress of the pupils, feedback and reinforcement.
3.3 Supplementary policies
As it was mentioned earlier, when emphasizing the need for professional accountability type of intervention it does not mean at all, that these interventions can be replaced or dropped. These measures and developments are addressing directly certain obstacles to the learning success of certain student groups.
The countries of the region are using a wide range of such developments, many of them grew out from different NGO programs in the nineties. Many of these programs proved to be very successful, even if – due to the obstacles outlined in the previous sections – they are rarely scaled up and very often were not sustainable. It is not the purpose of this paper to provide a full overview of these policies, sometimes even the country reports had difficulties to put together a full inventory. However, a structured indication of the types of policies is needed.
Targeted supplementary policies. These are policy measures, programs and developments that
address certain specific education related problems of specific student groups in a targeted way.
The target groups are the students themselves. For example, mentoring for Roma students in Hungary.
The target groups are the teachers teaching specific student groups. For example, anti-bias training for teachers educating Roma students in Slovakia and elsewhere, multicultural training for teachers in Slovakia, differentiated teaching training for teachers educating disadvantaged students and inclusion training for teachers in the Czech Republic, gender sensitive education training in Austria.
The target groups are the schools educating specific student groups. For example, providing supplementary human resources (e.g. Roma teacher assistants) for those school that are educating Roma students in the Czech Republic and Slovakia or support teachers in support classes in Austria, supplementary financial resources for opening zero/preparatory classes for disadvantaged children in the Czech Republic and Slovakia, or the “Arany János” dormitory and vocational school program in Hungary,
The target groups are local self-governments. For example, the mandatory school districts regulation and the mandatory development of “equal chances plans” by local self-governments in Hungary.
The target groups are other players of education. For example, the revision of the work of expert committees in Hungary and the Czech republic, non-biased school readiness testing in Slovakia, the establishment of Roma Education Centers in Slovakia.
Universal supplementary policies. All sorts of policies and developments that are basically
justified by equity related considerations but are extended to all children. For example:
Policies aiming at increasing kindergarten enrollment in Austria, Slovakia and the Czech Republic.
Extending participation in whole day care in Austria and Slovakia.
Additional resources for employing school psychologists and guidance advisors in the Czech republic.
Addressing non educational obstacles to learning. Very often the reasons of failure or the
obstacles to further participation have very little to do with the quality of available education services. Examples for such policies and programs are:
As this brief overview – that is far from being complete - demonstrates, there might be an endless menu of programs addressing a wide range of problems. However, we can’t take granted that all of these programs are effective, just because they serve good purposes. Since the evaluation of even large scale government programs is not mandatory in the countries of the region we have much more program ideas than evidences about their impact and the sustainability of their impact. Therefore, one of the key areas for development in relation of supplementary policies is getting access to information about working solutions that really work. Evaluation is especially important for channeling the experience and know-how accumulated by supplementary measures and developments into school development in other schools by creating a modularized offer of such developments.
There is a visible shift in the way, how supplementary policies are targeted from individual teachers to entire schools. The whole school approach is a genuine feature of mainstream policies, but the planners of supplementary policies are also more and more aware of the fact, that any developments that target individual teachers will have the tendency to remain isolated within the school. In addition to this, the sustainability of the development also can be ensured only by targeting the whole institution. This kind of policy design is reinforced by the shift of emphasis to basic competences. Unlike subject knowledge, the development of competences (such as reading literacy) can not be designated to one or another teacher; this type of learning outcomes are the unified results of almost all teachers educating the same students. That strengthens the value of organized cooperation among teachers.
A typical problem in the design and implementation of supplementary policies is the way how the different measures are financed. In several cases the additional financial and human resources deployed to schools are incorporated into the normal allocation of financial resources. It is done by amendments to regulations that recognize the specific costs of certain additional services. Therefore, the schools become entitled to use a part of their budget for these services. Another way through ordinary financial allocation is a per capita based grant supplement for specific purposes, regardless whether the supplement is earmarked or not. The problem with both allocations mechanisms is the fact, that it is very hard to connect these resources with well defined outcome expectations. In addition to this, due to the weakness of evaluation systems typically there is no appropriate information on the actual impact of these measures. Policy makers simply take granted that the resources made available for different purpose well serve the goals of the particular policy. Another way is a set aside scheme that allocates resources on the basis of applications (project plans) developed by the schools. In this case financing occurs on a contractual basis that opens space for setting concrete outcome expectations and for external monitoring. The operational costs of this financing method are much bigger. Recently Hungary is experimenting with set aside schemes for the use of available resources.