Contact:
Equity & Index Valuation Division Phone: (6221) 7278 2380
“Disclaimer statement in the last page is an integral part of this report”
Source: Bloomberg, Pefindo Equity & Index Valuation Division
Market Value Added & Market Risk
Source:PT Selamat Sempurna Tbk, Pefindo Equity & Index Valuation Division
Established in January, 1976, PT Selamat Sempurna Tbk (SMSM) currently is known as the largest filter manufacturer in Indonesia. Besides filter, SMSM produces wide range of product types that include radiators, oil coolers, condensers, brake pipes, fuel pipes, fuel tanks, exhaust systems, and press parts. SMSM has an extensive range of product that involves
5,000 stock keeping units (SKUs). SMSM’s products market is mainly in the
after-market and sold under the flagship brand of Sakura and
ADR-Radiator. The company’s products are exported to more than 100 countries
worldwide that include Asia, America, Europe, and Australia. SMSM also registered its products trademark in more than 100 countries around the world. SMSM put products quality as the main priority; therefore the company continues to comply with latest international standard of products quality, updating machineries and technology, as well as collaboration with international players of automotive parts. Recently, the company acquired
its sister company, PT Hydraxle Perkasa (“HP”), that engages in
“Disclaimer statement in the last page is an integral part of this report” www.pefindo.com
Selamat Sempurna, Tbk
Global Car Sales Keep Stretching Despite the Headwinds of Crisis
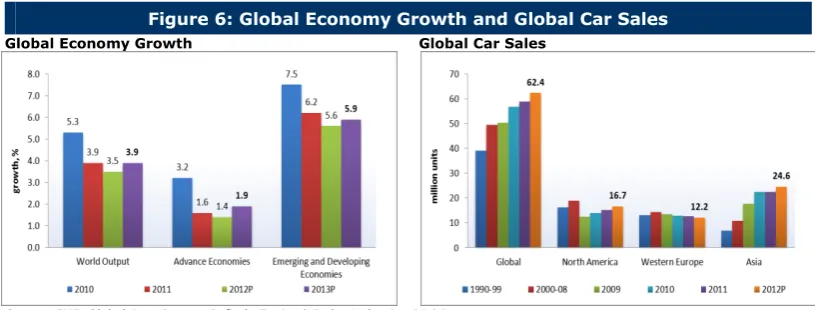
Global economy is slowing down as the European countries entering a recession that impacting spread over the world. Nonetheless, there is positive view for global economy condition as described in IMF forecasts that it would be grow at 3.5% YoY in 2012 and expected to pick up to 3.9% YoY in 2013. Moreover, despite the headwinds of current Euro crisis, global car sales grew 6% YoY during 1H12. We expect the growth will continue in 2H12 underpinned by low interest rates in most nations that drives the pace of automotive lending, and enhancement of job creation in emerging economies. In 1H12, employment in emerging economies has increased 4% YoY which lifted global job growth to 2.3% YoY. Global car sales are estimated to reach 62.4 million in units in 2012 compared to 58.9 million units in previous year. The main drivers of the growth is estimated from markets such as North America, Eastern Europe, and Asia, which projected to grow by 10%, 11%, and 9% YoY, respectively.
Broad Opportunities in the Domestic Market
After 2009, domestic economy has been growing solidly with growth pace of above mechanism. On the other hand, the development of mining (particularly coal mining) and agriculture (particularly palm oil) industry is very exciting. Coal production has grown by 20% CAGR during the period of 2007-2011, while CPO production by 8% CAGR. The condition attracts some well-known heavy equipment manufacturer, such as Sinotruk, Sumitomo, Sany Group, and Hyundai, plans to expand or make new investment in this year or in the coming years. We believe SMSM could utilize the opportunities in heavy equipment industry since the company has an extensive range of products supported with quality compliance to international standards.
Expected Continue to Deliver Strong Growth in the Future
During 1H12, SMSM’s sales only grew by 2% YoY, where radiators sales declined 13% YoY and filters sales growth decelerated to only 5% YoY. The decline of radiator sales is related to positive development of U.S. auto industry; therefore auto manufacturers depleted their inventories to be back at normal levels which then lead auto parts distributors to lower their inventories levels as well. Meanwhile, deceleration of filter sales growth mainly occurred in Asia, America, and Australia markets due to the effect of global economic crisis that shrinking the demand of many countries. SMSM has proven its capacity to manage strong growth over long periods as well to manage its resilient to the economic crisis. SMSM has managed consecutive net revenue growth for almost two decade (1992-2011) with a rate of growth of 33% CAGR and 9 years (2002-2011) of consecutive net income growth with pace of 20% CAGR. Going forward, considering Hydraxle Perkasa (its newly acquired company) contribution in the future and current business capacity to deliver growth, we are projecting that
SMSM’s net revenue and net profit could grow by about 20% CAGR for the next five years. interest rate, manageable inflation, and increment of middle class population will support many industries to grow including automotive, mining, and agriculture industry which then create wide opportunities for SMSM to expand in the domestic market. We believe that SMSM has sufficient resources and competitiveness to take
advantage of those lucrative opportunities. Accordingly, we project the company’s net
revenue should grow with exciting pace of 20% CAGR for the period of 2011-2016.
“Disclaimer statement in the last page is an integral part of this report” www.pefindo.com
Selamat Sempurna, Tbk
th
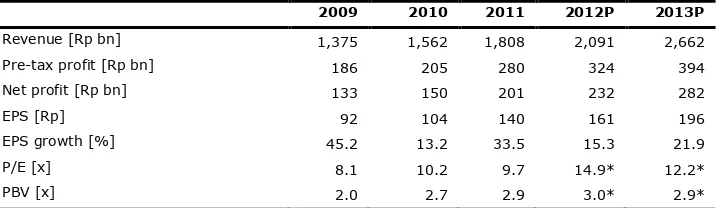
Table 1: Performance Summary
2009 2010 2011 2012P 2013P
Revenue [Rp bn] 1,375 1,562 1,808 2,091 2,662
Pre-tax profit [Rp bn] 186 205 280 324 394
Net profit [Rp bn] 133 150 201 232 282
EPS [Rp] 92 104 140 161 196
EPS growth [%] 45.2 13.2 33.5 15.3 21.9
P/E [x] 8.1 10.2 9.7 14.9* 12.2*
PBV [x] 2.0 2.7 2.9 3.0* 2.9*
“Disclaimer statement in the last page is an integral part of this report” www.pefindo.com
Selamat Sempurna, Tbk
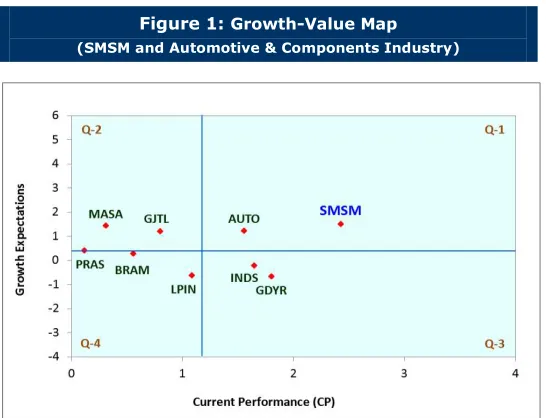
Growth-Value Map provides overview of market expectations for the companies listed
on IDX. Current Performance (“CP”) metric, running along the horizontal axis, is a portion of current stock market value that can be linked to the perpetuity of current
company’s performance in profitability. Growth Expectations (“GE”) metric, plotted on
the vertical axis, is the difference between current stock market value and the value
of current performance. Both metrics are normalized by the company’s book value.
Growth-Value Map divides companies into four clusters, they are:
Excellent value managers (“Q-1”)
Market expects companies in Q-1 to surpass their benchmark in profitability and growth.
Expectation builders (“Q-2”)
Market has relatively low expectations of profitability from companies in Q-2 in the short term, but has growth expectations exceed the benchmark.
Traditionalists (“Q-3”)
Market has low growth expectations of companies in the Q-3, although they showed a good profitability in the short term.
Asset-loaded value managers (“Q-4”)
Market has low expectations in terms of profitability and growth for companies in Q-4.
Figure 1: Growth-Value Map (SMSM and Automotive & Components Industry)
Source: Pefindo Equity & Index Valuation Division
We classify SMSM into an excellent value managers (Q-1) company. SMSM profitability and future growth opportunity is expected to exceed market’s benchmark.
We see that SMSM’s performance is perceived outperformed its peers within
automotive & components industry which is also confirmed by our research. We believe that SMSM will continue to record its excellent performance in the future.
“Disclaimer statement in the last page is an integral part of this report” www.pefindo.com
Selamat Sempurna, Tbk
th
A Brief Profile
SMSM was established on January 19, 1976 and now is predicated as the largest filter manufacturer in the country. SMSM is part of ADR Group, a respected group that focuses on manufacturing and distribution of automotive components. SMSM has an extensive products portfolio reaching 5,000 SKUs, which comprised of filters, radiators, oil coolers, condensers, brake pipes, fuel pipes, fuel tanks, exhaust systems, and press parts.
Table 2: SMSM has Large Production Capacity
Product Type Production Capacity
(000 Units)
Utilization (2011)
Filtration 96,000 54%
Heat Exchanger (Radiator) 1,950 44%
Brake Pipe 1,800 34%
Fuel Tank 96 58%
Muffler 76 40%
Source: PT Selamat Sempurna Tbk, Pefindo Equity & Index Valuation Division
SMSM markets its products under flagship brand of ADR Radiator and Sakura. SMSM exports its products to more than 100 countries worldwide and has trademark registration in also more than 100 countries worldwide. SMSM strongly markets its products to aftermarket; only around 5% of SMSM’s sales are to original equipment manufacturers (OEMs). In the domestic market, SMSM could record around 40% market share for filters and radiators in the aftermarket.
Figure 2: SMSM’s Flagship Brands
Source: PT Selamat Sempurna Tbk, Pefindo Equity & Index Valuation Division
PT Hydraxle Perkasa (“HP”) was acquired to consolidate in August, 2012. Meanwhile,
SMSM signed joint venture agreement of new associated company PT Tokyo Radiator
Selamat Sempurna (“TRSS”) in January, 2012, and plan to be fully commercially
operated in April 2013.
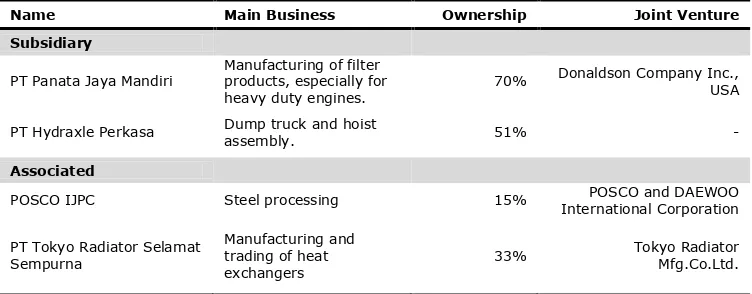
Table 3: SMSM’s Subsidiaries and Associated Companies
Name Main Business Ownership Joint Venture
Subsidiary
PT Hydraxle Perkasa Dump truck and hoist
assembly. 51% -
Associated
POSCO IJPC Steel processing 15% POSCO and DAEWOO
International Corporation
Source: PT Selamat Sempurna Tbk, Pefindo Equity & Index Valuation Division
“Disclaimer statement in the last page is an integral part of this report” www.pefindo.com
Selamat Sempurna, Tbk
Hydraxle Perkasa Acquisition: Vertical Integration and Escalating Future Profits
On May 1, 2012, SMSM acquired 49% shares of its sister company namely PT
Hydraxle Perkasa (“HP”), a manufacture of dump body, tanks, boxes, trailers, dump hoist, steel slitting, shearing, and molding and dies. Then, on August 1, 2012 SMSM used its option to increase ownership in HP to become 51%. SMSM invest about Rp 123 billion (Rp 157/share) for the acquisition, and received loan commitment without collateral from Mizuho Bank to finance the acquisition.
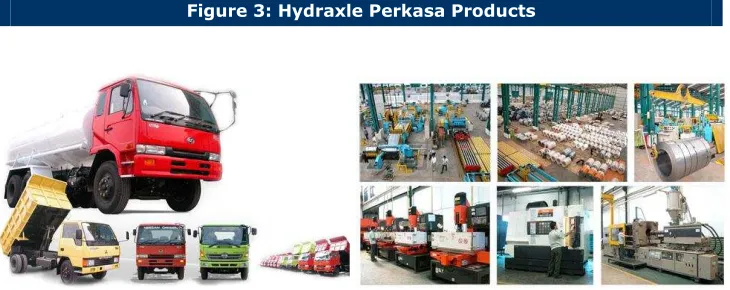
Figure 3: Hydraxle Perkasa Products
Source: PT Selamat Sempurna Tbk, Pefindo Equity & Index Valuation Division
Besides HP is the largest manufacturer dump body hoist in Indonesia, HP acquisition
will extend the variety of SMSM’s products as well as assurance supply of mold and
dies to SMSM. Currently, around 80% of HP’s products are used for mining industry,
and the rest are used for plantation and construction industry. Considering HP’s
historical performance, we believe that this is a lucrative acquisition where we project
HP will escalate SMSM’s revenue and profits in the future.
Table 4: Hydraxle Perkasa’s Production Capacity, Utilization, and Revenue
Contribution per Product Type
Product Type Production Capacity
(Unit/Year)
Utilization (2011)
Revenue Contribution (2011)
Dump truck Body 10,000 34% 81%
Tank 1,500 5% 1%
Molding 1,200 8% 3%
Dies 1,200 22% 4%
Source: PT Selamat Sempurna Tbk, Pefindo Equity & Index Valuation Division
Figure 4: Financial Performance of Hydraxle Perkasa
Source: PT Selamat Sempurna Tbk, Pefindo Equity & Index Valuation Division
Integrated Business within ADR Group
“Disclaimer statement in the last page is an integral part of this report” www.pefindo.com
Selamat Sempurna, Tbk
th
Figure 5: ADR Group Industrial Complex
Source: PT Selamat Sempurna Tbk, Pefindo Equity & Index Valuation Division
Joint Venture in a Heat Exchangers Company
SMSM already signed a joint venture agreement with Tokyo Radiator Mfg. Co. Ltd
(“TRMC”) in January, 2012, to establish an Indonesian based company that engages in
manufacture and sale of heat exchangers that mainly intended for OEM market. The company named PT Tokyo Radiator Selamat Sempurna (“TRSS”) with paid in capital of
Rp 17.2 billion, and 33% of SMSM ownership in the company. TRSS’s factory will be located in ADR’s industrial complex in Banten, and planned to commercially operating
in April 2013. We view this joint venture will benefit SMSM’s capabilities and capacities in producing and selling heat exchangers products, strengthening OEM market as well as financial performance in the future.
Positive Development of Global Car Sales Growth in the Midst of Ongoing Crisis
Global economy is slowing down as the European countries entering a recession that impacting spread over the world. According to IMF, at least there are two types of risks that overshadow global economy, i.e. insufficient policy action that will further escalates crisis in Euro area, and fiscal policy hurdles in advanced economies mainly in U.S. and Japan. Nonetheless, there is positive view for global economic condition as described in IMF forecasts on global economy growth that would be 3.5% YoY in 2012 and 3.9% YoY in 2013. Moreover, despite the headwinds of current Euro crisis, global car sales grew 6% YoY during 1H12. We expect the growth will continue in 2H12 underpinned by low interest rates in most nations that drives the pace of automotive lending, and enhancement of job creation in emerging economies. Therefore, we are
optimist that SMSM’s export markets would brighter in the coming periods.
Figure 6: Global Economy Growth and Global Car Sales
Global Economy Growth Global Car Sales
Source: IMF, Global Auto Report, Pefindo Equity & Index Valuation Division
Solid Growth of Indonesia Economy and Bright Prospects in Domestic Market
After 2009, domestic economy has been growing solidly with growth pace of above 6.0% YoY. The soaring of investment realization in this year, including foreign direct investment (FDI), as the effect of improving perception of domestic economy in the global community, has also contributed to economic growth. Therefore, we expect that income per capita will go higher, projected to break USD 4,000 in 2012. This positive development of domestic economy will further driving automotive sales in the country and encourage the sales to continue its pace of growth as historically grow at 13% CAGR for the last five years.
“Disclaimer statement in the last page is an integral part of this report” www.pefindo.com
Selamat Sempurna, Tbk
is entering middle class economy, low and stable interest rate has driven number of car sales that using vehicle loans (60% portion is car loans). Likewise, heavy equipment sales also increasing over the years since about 90% of sales are through leasing mechanism which sensitive to interest rate movements. Considering all the facts, we are optimist that SMSM has bright prospects in the domestic market.
Figure 7: Domestic Economy and Car Sales Development
Domestic Economy Development Domestic Car Sales
Source: Bank Indonesia, Central Bureau of Statistics, Gaikindo, Pefindo Equity & Index Valuation Division
Lucrative Opportunities from Mining and Agriculture Sectors
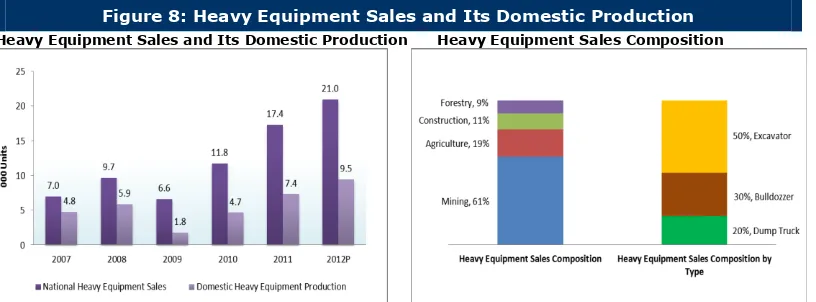
Mining sector dominates the sales of heavy equipment with market share of 61%. Indonesia mining industry has been growing significantly in the recent years, as represented by the growth of coal industry. Coal production grew by 20% CAGR during 2007-2011 periods. Heavy equipment sales also absorbed by agriculture sector by around 19% market share. Agriculture industry, particularly palm oil plantation has been one of the main drivers of economic growth. CPO production has been growing 8% CAGR along 2007-2011 periods. Therefore, in line with remarkable development of mining and agriculture sector, heavy equipment sales have been growing significantly with a growth of 25% CAGR during 2007-2011.
In addition, we believe that SMSM would be benefited from the tidbits in heavy equipment industry i.e. some well-known manufacturer plan to expand or make new investment in this year or in the coming years. We can mention some manufacturer such as Sinotruk, Sumitomo, Sany Group, and Hyundai. SMSM may utilize the opportunities in heavy equipment industry since the company has an extensive range of products supported with quality compliance to international standards.
Figure 8: Heavy Equipment Sales and Its Domestic Production
Heavy Equipment Sales and Its Domestic Production Heavy Equipment Sales Composition
“Disclaimer statement in the last page is an integral part of this report” www.pefindo.com
Selamat Sempurna, Tbk
th
HP’s Products will Strengthen Domestic Sales
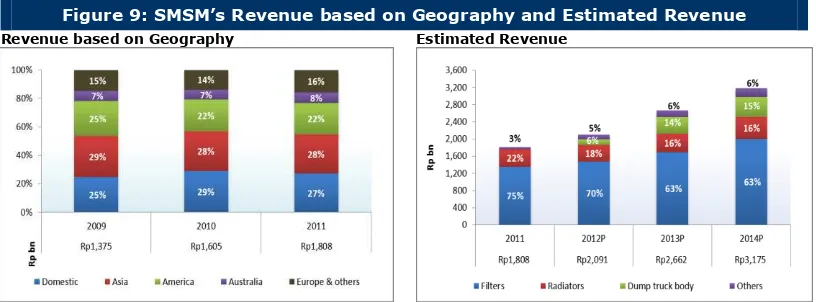
Based on product type, filters products contribute around 75% of revenue, then 22% from radiators, and the rest is from other type of auto parts. On the other hand, based on geography, around 73% revenue is from export market including countries in Asia, America, Australia, and Europe. However, SMSM products have strong presence in domestic market. Domestic market accounted for 28% revenue and has been growing by 21% CAGR for the last five years, above total net revenue growth of only 15% CAGR. In 2012 and the years ahead, revenue contribution structure should change as the effect of HP consolidation.
Considering strong growth of mining, plantation, and construction industry in Indonesia, we project that dump truck body would give contribution of around 15% of
revenue in years ahead, except for 2012 that would only 6% since HP’s revenue starts
consolidated since August 2012. Due to HP’s products remain only for domestic market; its revenues would make domestic sales to escalate to about 37% of total sales in 2012 and about 45%-50% of total sales in the next years.
Figure 9: SMSM’s Revenue based on GeographyandEstimated Revenue
Revenue based on Geography Estimated Revenue
Source: PT Selamat Sempurna Tbk, Pefindo Equity & Index Valuation Division
Positive Outlook of Filters and Radiators Sales
During 1H12, SMSM sales in auto parts products (exclude HP sales) only grew 2% YoY, where radiators sales declined 13% YoY and filters sales growth decelerated to only 5% YoY. Radiator sales decline was related to positive development of U.S. auto industry, therefore auto manufacturers were depleted their inventories to be back at normal level of inventories which then encourage auto parts distributors to lower their inventories levels as well. However, for the next quarters, we put some confident on U.S. auto industry that has showed increment sales to households, and stronger employment growth, and the dropped of auto loan rates. Furthermore, the average
age of U.S. fleet is almost 11 years that would create bright prospects for SMSM’s
products in the auto parts replacement market. Meanwhile, deceleration of filter sales growth mainly occurred in Asia, America, and Australia markets due to the effect of global economic crisis that shrinking the demand of many countries.
Figure 10: SMSM’s Filters and Radiators Sales based on Geography
Filters Sales Radiators Sales
.Source: PT Selamat Sempurna Tbk, Pefindo Equity & Index Valuation Division
Despite of in the midst of decelerating growth issue, SMSM remains having opportunities to deepen and broaden its market in every country particularly by collaborating with proper distributor partners. Underpinned by better global economic expectation and the recovery of auto industry in some countries, like U.S., for the
“Disclaimer statement in the last page is an integral part of this report” www.pefindo.com
Selamat Sempurna, Tbk
years ahead, we are confident to project that SMSM could deliver filters and radiators sales growth of 14% and 8% CAGR for the period of 2011-2014.
Figure 11: SMSM’s Filters and Radiators
Sales Estimate
Source: PT Selamat Sempurna Tbk, Pefindo Equity & Index Valuation Division
SMSM will continue to Deliver Strong Growth of Net Revenue and Profit
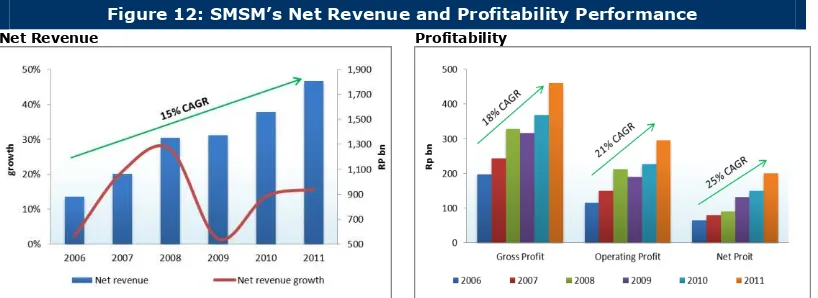
SMSM has proven its capacity to manage strong growth over long periods as well its resilient to the domestic and global economic crisis. SMSM has managed consecutive net revenue growth for almost two decade (1992-2011) with a rate of growth of 33% CAGR and 9 years (2002-2011) of consecutive net income growth with pace of 20% CAGR. For the last five years (2006-2011) SMSM could record 15% CAGR and 20% CAGR in terms of net revenue growth and net income growth, respectively.
Figure 12: SMSM’s Net Revenue and Profitability Performance
Net Revenue Profitability
Source: PT Selamat Sempurna Tbk, Pefindo Equity & Index Valuation Division
We view that SMSM’s commitment in producing high quality products that meet
international standards in quality along with very competitive pricing compared to its competitors’ and even compared to original auto parts, is the key for SMSM
astonishing performance. Going forward, considering HP’s contribution in the future and current business capacity to deliver growth, we are projecting that SMSM’s net
revenue and net profit could grow by about 20% CAGR for the next five years.
Accordingly, the company’s target to achieve net revenue of Rp 4 trillion in 2016 could
be accomplished based on our projection.
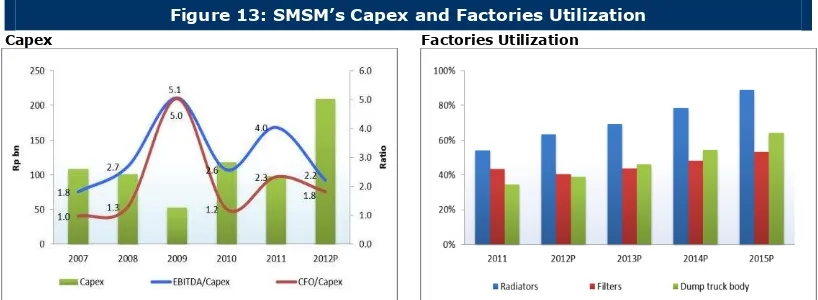
Strong Cash and EBITDA to Finance Capex
Over the last 5 years SMSM spent capex on average of Rp 100 billion per annum. We
argue that the company’s capex is relatively modest compared to its cash flow from
operating activities (CFO) or EBITDA. Therefore, SMSM could manage its capex to finance from its internal cash. Meanwhile, during 1H12, SMSM used the support from bank loan to finance HP acquisition of Rp 123 billion, and its capex already reach Rp
170 billion. However, we argue that the company’s cash flow condition remains strong
although the capex financing is from internal fund as depicted by ratio of CFO/capex and EBITDA/capex of 4.0 and 2.3 in 2011 and estimated of 2.2 and 1.7 in 2012. After HP acquisition, management guide that there would be no more inorganic expansion
“Disclaimer statement in the last page is an integral part of this report” www.pefindo.com
Selamat Sempurna, Tbk
th
Figure 13: SMSM’s Capex and Factories Utilization
Capex FactoriesUtilization
Source: PT Selamat Sempurna Tbk, Pefindo Equity & Index Valuation Division
Outperforms Its Peers
SMSM’s performance is the highest among its peers within automotive and
components industry, particularly in terms of ROE. In 1H12 the company booked annualized ROE of 28.8% compared to average industry of only 14.1%. SMSM profitability is supported by higher asset turnover rate but lower leverage compared to peers. Considering SMSM historical performance, its pour benefits as part of ADR Group and its commitment to quality, we believe that the company would continue to record excellent performance in the future.
Table 5: SMSM Performance among Peers as of 1H12
Company’s
Source: Bloomberg, Pefindo Equity & Index Valuation Division * annualized
Strong Commitment in Dividend Payment with Manageable Debt Level
“Disclaimer statement in the last page is an integral part of this report” www.pefindo.com
Selamat Sempurna, Tbk
Figure 14: SMSM’s Dividend Payment and Debt Position
Dividend Debt Position
S o u r c e :
P T
S e l a m a t
Source: PT Selamat Sempurna Tbk, Pefindo Equity & Index Valuation Division
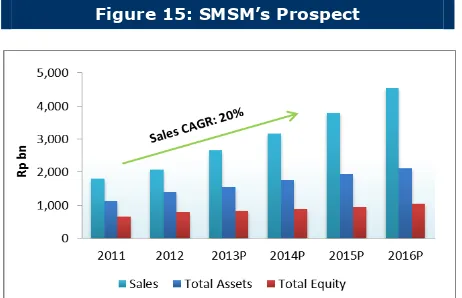
Business Prospects
Currently global economy is shrinking as the impact of Euro crisis. However, looking forward, we are optimist that global economy will gradually improve which then provides fresh breeze for the global market. The good news is despite in the midst of ongoing crisis, global car sales have showed positive development along first semester of this year. Moreover, U.S. auto industry also indicates an encouraging development as well as low interest rates that apply in most countries and the strengthening of global job market may drive the pace of automotive lending. Meanwhile, domestic economy still deliver solid growth as during 1H12 grew 6.4% YoY, and expected to maintain the pace of growth for the next semester. Low interest rate, manageable inflation, and increment of middle class population will support many industries to grow including auto, mining, and agriculture industry which then create wide opportunities for SMSM to expand in the domestic market. We believe that SMSM has sufficient resources and competitiveness to take advantage of those
lucrative opportunities. Accordingly, we are project the company’s net revenue should grow with exciting pace of 20% CAGR for the period of 2011-2016.
Figure 15: SMSM’s Prospect
“Disclaimer statement in the last page is an integral part of this report” www.pefindo.com
Part of ADR Group, that benefit SMSM particularly in production value chain due to integrated business within the group.
The largest filter manufacturer in the country.
Extensive products portfolio reaching 5,000 SKUs.
A very broad markets to over than 100 countries worldwide.
Positive outlook of global economy in the coming years.
The growing of global car sales driven by low interest rates in most nations.
Global economy fail to recover that may cause protracted economy slowdown.
Currency volatility could pose risks to profits fluctuation.
Circulation of counterfeit products that could threaten the company’s brands image.
“Disclaimer statement in the last page is an integral part of this report” www.pefindo.com
Selamat Sempurna, Tbk
Table 7: SMSM and Its Peers Performance Summary as of 1H12
SMSM AUTO INDS LPIN
Net sales [Rp bn] 893 4,162 765 30
Gross profit [Rp bn] 233 676 173 12
Before tax profit [Rp bn] 87 648 105 10
Net profit [Rp bn] 112 528 77 8
Total asset [Rp bn] 1,137 7,923 1,666 162
Total liabilities [Rp bn] 482 2,954 586 36
Total equity [Rp bn] 780 4,968 1,079 126
Growth [YoY]
Net sales [%] 2.1 16.8 32.9 (1.3)
Gross profit [%] 6.4 12.4 29.7 (2.7)
Before tax profit [%] 21.5 10.1 26.7 33.1
Net profit [%] 13.4 9.9 22.1 58.2
Profitability
Gross profit margin [%] 26.1 16.2 22.7 41.6
Operating profit margin [%] 9.7 15.6 13.7 32.4
ROA [%] 9.9 6.7 4.6 5.0
ROE [%] 14.4 10.6 7.1 6.4
Leverage
DER [x] 0.6 0.6 0.5 0.3
Source: Bloomberg, PT Selamat Sempurna Tbk, Pefindo Equity & Index Valuation Division
“Disclaimer statement in the last page is an integral part of this report” www.pefindo.com
Selamat Sempurna, Tbk
th
VALUATION
Methodology
We apply Discounted Cash Flow (DCF) method as the SMSM valuation approach considering the income growth is a value driver instead of the asset growth.
Furthermore, we also apply Guideline Company Method (GCM) as comparison method.
This valuation is based on 100% shares price as of October 5th, 2012, and Financial Report as of June 30th, 2012 as the basis for the fundamental analysis.
Value Estimation
We use the cost of capital and cost of equity of 10.2% and 10.8% based on the following assumptions:
Table 8: Assumption
Risk free rate [%]* 5.9
Risk premium [%]* 6.3
Beta [x]* 0.8
Cost of Equity [%] 10.8
Marginal tax rate [%] 22.0
WACC [%] 10.2
Source: Bloomberg, Pefindo Equity & Index Valuation Division Estimates * as of October 5th, 2012
Target price for 12 months based on valuation as per October 5th, 2012, is as
follows:
Using DCF method with discount rate assumption 10.2%, is Rp 2,678 – Rp 2,978 per share.
Using GCM method (P/E 15.0x and P/BV 3.3x) is Rp 2,086 – Rp 2,222 per share.
In order to obtain a value which represents both value indications, we have weighted both DCF and GCM methods by 70%:30%.
Based on the above calculation, target price of SMSM for 12 month is Rp 2,500 -
Rp 2,750 per share.
Table 9: Summary of DCF Method Valuation
Conservative Moderate Optimist
PV of Free Cash Flows [Rp bn] 1,153 1,214 1,274
PV of Terminal Value [Rp bn] 2,948 3,103 3,258
Non-Operating Assets [Rp bn] 27 27 27
Debt [Rp bn] (272) (272) (272)
Number of Share [mn shares] 1,440 1,440 1,440
Fair Value per Share [Rp] 2,678 2,828 2,978
Source: Pefindo Equity & Index Valuation Division Estimates
“Disclaimer statement in the last page is an integral part of this report” www.pefindo.com
Selamat Sempurna, Tbk
Table 10: GCM Comparison
SMSM AUTO LPIN Average
P/E [x] 16.1 14.2 14.6 15.0
P/BV [x] 5.1 3.2 1.7 3.3
Source: Bloomberg, Pefindo Equity & Index Valuation Division
Table 11: Summary of GCM Method Valuation
Multiple [x] Est. EPS [Rp] Est. BV/share [Rp] Value [Rp]
P/E 15.0 140 - 2,086
P/BV 3.3 - 671 2,222
Source: Bloomberg, Pefindo Equity & Index Valuation Division Estimates
Table 12: Fair Value Reconciliation
Fair Value per Share [Rp]
DCF GCM Average
Upper limit 2,978 2,222 2,750
Bottom limit 2,678 2,086 2,500
Weight 70% 30%
Source: Pefindo Equity & Index Valuation Division Estimates
“Disclaimer statement in the last page is an integral part of this report” www.pefindo.com
Source: PT Selamat Sempurna Tbk, Pefindo Equity & Index Valuation Division Estimates
Source: PT Selamat Sempurna Tbk, Pefindo Equity & Index Valuation Division Estimates
Figure 16: Historical P/E dan P/BV
Source: PT Selamat Sempurna Tbk, Pefindo Equity & Index Valuation Division
Figure 17: Historical ROA, ROE and Total Assets Turnover
Source: PT Selamat Sempurna Tbk, Pefindo Equity & Index Valuation Division
Table 15: Key Ratios
“Disclaimer statement in the last page is an integral part of this report” www.pefindo.com
Selamat Sempurna, Tbk
DISCLAIMER
This report was prepared based on the trusted and reliable sources. Ne vertheless, we do not guarantee its completeness, accuracy and adequacy. Therefore we do not responsible of any investment decision making based on this report. As for any assumptions, opinions and predictions were solely our internal judgments as per reporting date, and those judgments are subject to change without further notice.
We do not responsible for mistake and negligence occurred by using this report. Last performance could not always be used as reference for future outcome. This report is not an offering recommendation, purchase or holds particular shares. This report might not be suitable for some investors. All opinion in this report has been presented fairly as per issuing date with good intentions; however it could be change at any time without further notice. The price, value or income from each share of the Company stated in this report might lower than the investor expectation and investor might obtain lower return than the invested amount. Investment is defined as the probable income that w ill be received in the future; nonetheless such return may possibly fluctuate. As for the Company which its share is denominated other than Rupiah, the foreign exchange fluctuation may reduce the value, price or investor investment return. This report does not contain any information for tax consideration in investment decision making.
The share price target in this report is a fundamental value, not a fair market value nor a transaction price reference required by the regulations.
The share price target issued by Pefindo Equity & Index Valuation Division is not a recommendation to buy, sell or hold particular shares and it could not be considered as an investment advice from Pefindo Equity & Index Valuation Division as its scope of service to, or in r elation to some parties, including listed companies, financial advisor, broker, investment bank, financial institution and intermediary, in correlation with receiving rewards or any other benefits from that parties.
This report is not intended for particular investor and cannot be used as part of investment objective on particular shares and neither an investment recommendation on particular shares or an investment strategy. We strongly recommended investor to consider the suitable situation and condition at first before making decision in relation with the figure in this report. If it is necessary, kindly contact your financial advisor.
PEFINDO keeps the activities of Equity Valuation separate from Ratings to preserve independence and objectivity of its analytical processes and products. PEFINDO has established policies and procedures to SMSMtain the confidentiality of certain non-public information received in connection with each analytical process. The entire process, methodology and the database used in the preparation of the Reference Share Price Target Report as a whole is different from the processes, methodologies and databases used PEFINDO in doing the rating.
This report was prepared and composed by Pefindo Equity & Index Valuation Division with the objective to enhance shares price transparency of listed companies in Indonesia Stock Exchange (IDX). This report is also free of
other party’s influence, pressure or force either from IDX or the listed company which reviewed by Pefindo Equity & Index Valuation Division. Pefindo Equity & Index Valuation Division will earn reward amounting to Rp 20 mn each from IDX and the reviewed company for issuing report twice per year. For further information, please visit our website at http://www.pefindo.com