Summary We examined the physiological response of foli-age in the upper third of the canopy of 125-year-old giant sequoia (Sequoiadendron giganteum Buchholz.) trees to a 61-day exposure to 0.25×, 1×, 2× or 3× ambient ozone concen-tration. Four branch exposure chambers, one per ozone treat-ment, were installed on 1-m long secondary branches of each tree at a height of 34 m.
No visible symptoms of foliar ozone damage were apparent throughout the 61-day exposure period and none of the ozone treatments affected branch growth. Despite the similarity in ozone concentrations in the branch chambers within a treat-ment, the trees exhibited different physiological responses to increasing ozone uptake. Differences in diurnal and seasonal patterns of gs among the trees led to a 2-fold greater ozone uptake in tree No. 2 compared with trees Nos. 1 and 3. Tree No. 3 had significantly higher CER and gs at 0.25× ambient ozone than trees Nos. 1 and 2, and gs and CER of tree No. 3 declined with increasing ozone uptake. The y-intercept of the regression for dark respiration versus ozone uptake was sig-nificantly lower for tree No. 2 than for trees Nos. 1 and 3. In the 0.25× and 1× ozone treatments, the chlorophyll concentra-tion of current-year foliage of trees Nos. 1 and 2 was signifi-cantly higher than that of current-year foliage of tree No. 3. Chlorophyll concentration of current-year foliage on tree No. 1 did not decline with increasing ozone uptake. In all trees, total needle water potential decreased with increasing ozone uptake, but turgor was constant. Although tree No. 2 had the greatest ozone uptake, gs was highest and foliar chlorophyll concentration was lowest in tree No. 3 in the 0.25× and 1× ambient atmospheric ozone treatments.
Keywords: chlorophyll, ozone uptake, Sequoiadendron gigan-teum, stomatal conductance.
Introduction
Photooxidants produced in the San Francisco Bay area and in the San Joaquin Valley of California frequently cause elevated atmospheric ozone concentrations in the central Sierra Nevada (Unger 1978, Blumenthal et al. 1985). Ambient ozone concen-trations (summer average hourly concenconcen-trations of 70 ppb) cause foliar injury to field-grown giant sequoia ( Sequoiaden-dron giganteum Buchholz.) seedlings (Miller 1987), and to
ponderosa pine (Pinus ponderosa Laws.) and Jeffrey pine (Pinus jeffreyi Grev. and Balf.) trees (Miller and Millecan 1971, Pronos et al. 1978, Stolte et al. 1991), and reduce the diameter growth of Jeffrey pine trees (Peterson et al 1987, 1991).
In greenhouse studies, significant foliar injury to 4-month-old giant sequoia seedlings occurred at ozone concentrations of > 200 ppb for 8 h per day for 2 months relative to plants grown in charcoal-filtered air (Miller et al. 1994), whereas no visible foliar injury was observed in 2-year-old seedlings ex-posed to 100 and 200 ppb ozone for 4 h per day, three times per week for 2 months (Temple 1988). Similarly, in a field experiment, no visible injury was detected in the foliage of rooted cuttings from 12-year-old giant sequoia saplings ex-posed to ambient ozone or 1.5× ambient ozone in chambers for 4 months in summer, whereas slight injury was detected on foliage of current-year giant sequoia seedlings in the ambient ozone treatment and injury was prominent on foliage in the 1.5× ambient ozone treatment, and root biomass as a percent of seedling biomass declined with increasing exposure to ozone (Miller et al. 1994). Light compensation point was 60% higher, CER at light saturation was 56% lower and dark respi-ration was 100% higher in seedlings in the 1.5× ambient ozone treatment compared with seedlings grown in charcoal-filtered air (Grulke et al. 1989). The increase in dark respiration of the seedlings accounted for the difference in the light response between ozone treatments (Grulke et al. 1989). Although the foliage of the rooted cuttings was asymptomatic in the 1.5× ambient ozone treatment, CER was 20% lower compared with that of rooted cuttings grown in charcoal-filtered air (Grulke et al. 1989).
To determine whether carbon acquisition is negatively af-fected in asymptomatic foliage of older trees grown in the presence of elevated ozone, we tested the response of foliage at 34 m in the canopy of 125-year-old giant sequoia trees (53 m tall) to a 61-day exposure in branch chambers to subambient, ambient, and elevated (2×, 3× ambient) ozoneconcentrations. Gas exchange characteristics, leaf nitrogen, chlorophyll con-centration, water relations, and growth rates were measured before and during the experimental exposure. Because the trees differed in their diurnal and seasonal responses to ozone,
Response of giant sequoia canopy foliage to elevated concentrations of
atmospheric ozone
N. E. GRULKE, P. R. MILLER and D. SCIOLI
USDA, Forest Service, Pacific Southwest Research Station, 4955 Canyon Crest Drive, Riverside, CA 92507, USA
Received May 11, 1995
the effects of ozone uptake on physiological response are presented for each tree.
Methods
Research site
The study site was located at an elevation of 1,920 m in Giant Forest Grove, Sequoia National Park (118°46′ W 36°31′ N. Three trees (53 m tall, approximately 125 years old) that could be accessed by a single scaffold and were within 100 m of existing electrical power were chosen for study. The study trees were emergent from the canopy of other sequoia (25--88 m), white fir (Abies concolor (Gord. and Glend.) Lindl.), sugar pine (Pinus lambertiana Dougl.), and Jeffrey pine (Pinus jef-freyi), but still retained the conical shape associated with sap-lings of this species (Hartesveldt et al. 1975).
Branch chambers
Scaffolding was constructed to access branches in the upper third of the canopy at 34 m. Branch chambers were placed on a second or third secondary branch back from the primary tip and enclosed approximately 1000 growing branchlets. Four branch chambers were installed on the south--southwest aspect of each tree, one for each ozone treatment (subambient, 1×, 2×, and 3× ambient ozone concentrations), and one unenclosed branch per tree was selected for study.
Branch chambers were in operation from July 23 to Septem-ber 19, 1990. The chamSeptem-bers (design modified from Teskey et al. 1991) were 0.7 m in diameter, 1.2 m long, and constructed with a framework of aluminum strap covered with transluscent Teflon film. A baffle placed 0.3 m from the air entry promoted laminar air flow and gas mixing (Houpis et al. 1991). For each of the four ozone treatments, a blower box and manifold supplied air to the three branch exposure chambers set to the same ozone concentration. Air flow for each blower box was provided by a squirrel cage fan. The chamber exchange rate was 2 min−1. The air supply to all chambers was filtered through fiberglass dust and activated charcoal.
Ambient ozonewas sampled 3 m above the scaffold on the windward side, and measured by UV spectrophotometry (Model 1000 AH ozone monitor, Dasibi, Glendale, CA), with calibrations made every three weeks. Treatment ozone concen-trations were imposed 24 h per day. A signal cable from the ozone monitor to a voltage proportioner and ozonegenerator (Model GTC-0.5B, Griffin Technics, Lodi, NJ) supplied with dry bottled air regulated the amount of ozone to be made and minimized NOx production (Bytnerowicz et al. 1995).
Ozone in each branch chamber was sampled sequentially with a scanning valve (Scanivalve, San Diego, CA with addi-tional custom-made electronics), and analyzed by a second ozone monitor once every 30 min. Signals from both the ambient and branch chamber ozonemonitors were connected to a data acquisition system (System 570, Keithley, Cleveland, OH), and values were processed and used to calculate % values of ambient air. Valves were manually adjusted once or twice per day to approximate 1×, 2×, and 3× ambient ozone concen-trations. Because the ozone monitor and generator were
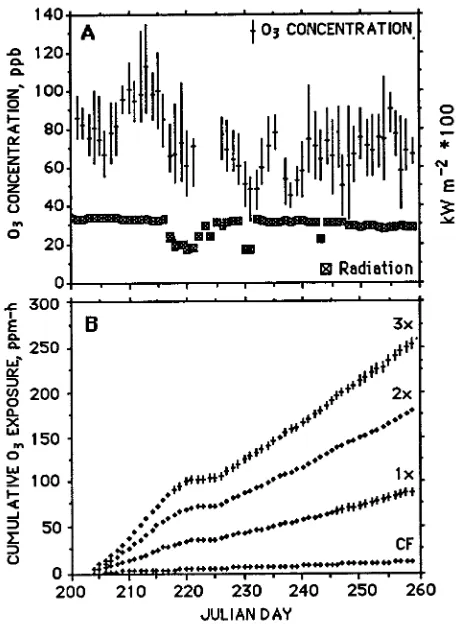
dam-aged by a lightning strike, ozone was not supplied to the branch chambers from August 8 to 12 (Figure 1b).
Ozone uptake
Ozone uptake was calculated independently for the 12 en-closed branches. Individual branch chamber hourly ozone con-centrations were multiplied by hourly gs values (determined from regressions fitted to measured diurnal values of gs) and divided by 1.68 to adjust for the diffusion rate of ozone (assum-ing that the internal ozoneconcentration was zero, Laisk et al. 1989) to obtain cumulative hourly ozone uptake for each branch. Diurnal measures of gs (from 0400 to 2200 h on clear days) were conducted monthly, and the change in maximum gs was interpolated on a daily basis between the monthly diurnal measurements. Reduction of gs due to cloud cover was not incorporated into the calculations of ozone uptake, and would have reduced ozone uptake on 6 days by 50 or 60% (the other 2 days of clouds occurred when all branch chambers were receiving charcoal-filtered air because of a lightning strike.
Gas exchange characteristics
Carbon dioxide exchange rate (CER), stomatal conductance (gs), and dark respiration were measured with an LI-6200 photosynthetic system (Li-Cor Inc., Lincoln, NE) equipped with a 0.25-dm3 cuvette. Dark respiration was measured dur-ing the day, after a 12--15 min equilibration period in darkness to minimize photorespiration. All gas exchange measures were made on 3rd, 4th, or 5th branchlets from the terminal bud of the enclosed secondary branch. A window in the branch cham-ber allowed access to the enclosed branch. Ozone concentra-tions during measurements were similar to those in the branch chambers. Each CER value was matched with a measure of dark respiration.
Gas exchange was expressed on a needle surface area basis. A geometric model of sequoia branchlet surface area was developed to include the surface area of the needles (surface area of a cone using diameter and length of each needle measured to the nearest 0.01 mm), and the photosynthetic surface area of the branchlet (surface area of a cylinder based on the diameter and length of the branchlet). A regression between calculated surface area and branchlet length was de-veloped from 20 branchlets of varying lengths. Other tech-niques for measuring surface area were unsatisfactory because the needle tips either trapped air bubbles or excluded glass beads.
Gas exchange was measured diurnally for all three trees during June 12--16, July 18--22, August 20--22, and September 17--19, 1990. Treatment responses for the first and second half of the ozone exposure period were determined from spot meas-ures of gas exchange made between 1100 and 1300 h during the period of maximum conductance as identified from the diurnal measurements.
Water relations
days. Both current-year and one-year-old tissues were sampled from the 3rd, 4th, and 5th branchlets from the terminal bud of tertiary branches. Three 5-mm long branch segments were placed in each of two psychrometers per treatment per sam-pling period. Needle water potential and osmotic + matric potential were measured in Peltier-type psychrometers (Pal-lardy et al. 1991) with a microvoltmeter (Model 33T, Wescor, Logan, UT) using the psychrometric mode and an equilibra-tion time of 2--3 h at 19 °C. After needle water potential was measured, the bottom of the cuvette containing the needles was wrapped in aluminum foil, frozen in liquid propane for 10 min, and then allowed to warm to 19 °C for 1 h before the osmotic + matric potential measurement was taken. Each psychrometer was cleaned and calibrated with 0.1, 0.3, and 0.7 mM KCl solutions at 19 °C every other run.
Chlorophyll concentration
Foliage was sampled before exposure to ozone and after expo-sure for 30 and 51 days. Chlorophyll concentration, expressed per unit dry weight, was determined on two replicate foliage samples (three 4-mm long segments of branchlets per treat-ment, sampled from the 3rd, 4th, and 5th branchlets from the terminal bud of tertiary branches). An additional sample per branch was oven dried and weighed to determine dry weight. Chlorophyll was extracted with dimethyl sulphoxide (DMSO) as described by Hiscox and Israelstam (1979) and analyzed as described by Arnon (1948).
Needle nitrogen
After gas exchange was measured, foliage enclosed in the cuvette was sampled for needle nitrogen content. Tissue was dried at 65 °C for 24 h, ground to pass a 40-mesh screen, then total nitrogen content was measured with a Carlo-Erba NA1500 Series 2 analyzer (Carlo-Erba, Rodano, Milano, It-aly).
Growth rates
The length of 30, tertiary, current-year branchlets on cham-bered branches and on unchamcham-bered secondary branches were measured before ozoneexposure and after 30 and 60 days of exposure. Differences between treatments were compared by one-way ANOVA.
Results
Ozone exposure and uptake
Maximum hourly ambient ozone concentrations exceeded 100 ppb on 24% of the days during the study (Figure 1a). Through-out the 61 days of exposure, there were no significant differ-ences in ozone concentration between the three chambers within each of the four treatments (P = 0.98, 0.33, 0.99, 0.71) (Figure 1b).
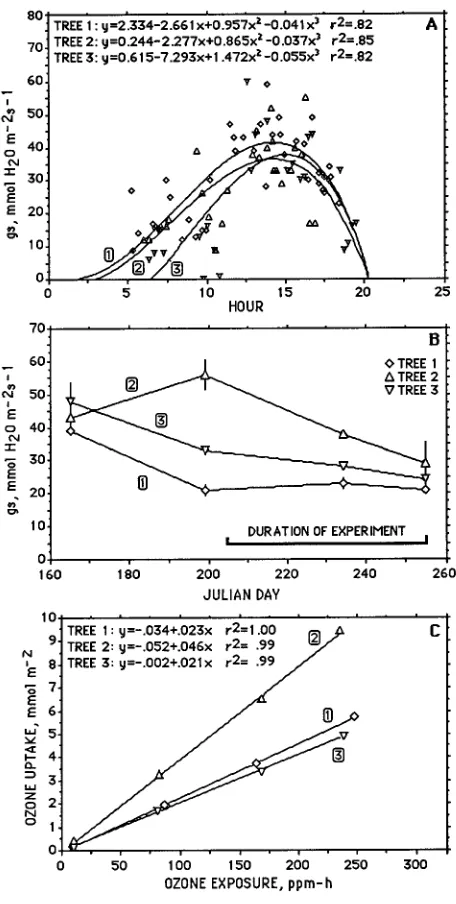
Among the three trees, there were differences in the diurnal pattern of gas exchange (Figures 2a and 2b) and a 2-h differ-ence in the time the canopy of each tree was exposed to full sun in the morning. Differences in diurnal and seasonal patterns of
gs among the trees led to a 2-fold greater ozone uptake for tree No. 2 than for trees Nos. 1 and 3 (Figure 2c).
Effect of branch chambers
The hourly average ambient ozone concentration was 72 ± 2 ppb compared with 93 ± 4 ppb measured over 24 h for the 1× ambient ozone branch chambers. A comparison of uncham-bered branches with chamuncham-bered branches in the ambient ozone treatment indicated that, at the end of the 61-day exposure period, there were no statistical differences in CER (2.41 ± 0.31 versus 2.14 ± 0.05 µmol m−2 s−1), g
s (24.7 ± 2.3 versus 24.7 ± 5.2 mmol m−2 s−1), dark respiration (−0.98 ± 0.02 versus −1.04 ± 0.33 µmol m−2 s−1), chlorophyll concentration (2.29 ± 0.27 versus 2.30 ± 0.40 mg gDW−1), predawn needle water potential (−0.79 ± 0.14 versus −0.36 ± 0.10 MPa) or midday needle water potential (−1.07 ± 0.33 versus −1.22 ± 0.23 MPa) (P < 0.05, 1-way ANOVA). There were no visible differences in foliage appearance among the three trees, between uncham-bered branches and chamuncham-bered branches, or among ozone treatments.
Gas exchange characteristics
significantly, lower during the second half of the ozone expo-sure period than during the first. The regression fit did not improve when hourly averages under 60 ppb or 100 ppb were excluded from the cumulative totals (data not shown). In con-trast, a plot of the relationship between CER and ozone uptake (Figure 3b) showed that there was a significant depression in CER during the second half of the ozone exposure period compared with the first (P < 0.05, significant difference in y-intercept but not slope).
Regressions developed for each tree revealed that the y -in-tercepts of the regression lines for the relationships between CER, gs, and ozone uptake for tree No. 3 were significantly different from those for trees Nos. 1 and 2 (Figures 4a and 4b). The y-intercept of the regression for the relationship between dark respiration and ozone uptake for tree No. 2 was signifi-cantly different from that for trees Nos. 1 and 3 (Figure 4c). Although there were no sigificant differences between the slopes of the regressions, probably because of the small sample size, their trends are presented below because they provide insight into the mechanisms of individual tree response to ozone.
Among the three trees studied, tree No. 2 had the greatest ozone uptake but tree No. 3 appeared to be the most sensitive to ozone. Both CER and gs declined with increasing ozone uptake in tree No. 3, whereas tree No. 2 showed no changes in CER or gs with increasing ozone uptake, and tree No. 1 showed
Figure 2. (a) Diurnal variation in stomatal conductance (gs) in June.
Regressions fitting the relationship between gs and time of day were
used to calculate ozone uptake rates. Each symbol represents the mean ± 1 SE of 2--4 measurements of gas exchange per tree. In most cases, the SE was contained within the symbol. (b) Seasonal variation in gs
during 1990 at 34 m in the canopy. (c) Relationship between ozone uptake and ozone exposure.
slight decreases in CER with increasing ozone uptake (Figures 4a and 4 b). Trees Nos. 1 and 3 had higher dark respiration than tree No. 2 (Figure 4c) and dark respiration of trees Nos. 1 and 3 declined with increasing ozone uptake, whereas dark respira-tion of tree No. 2 increased slightly with increasing ozone uptake.
Water relations
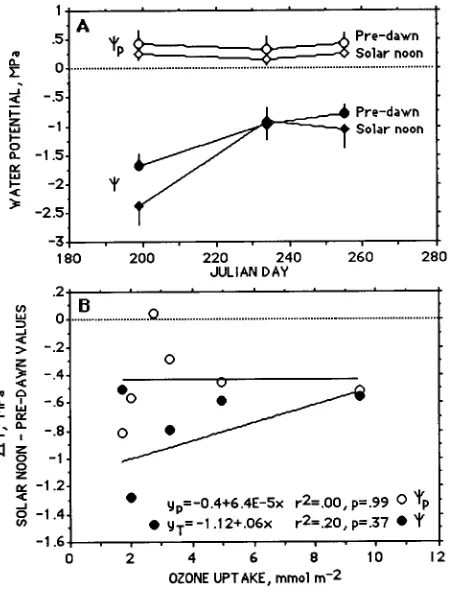
Needle water potential (Ψ) was low early in the summer before branch elongation, and the difference between predawn and midday Ψ was 0.6 MPa. From the time of branch elongation and throughout the rest of the growing season, Ψ was ≈ 1 MPa) and the difference between predawn and midday Ψ was less than 0.6 MPa. Turgor pressure (Ψp) was depressed at midday, but at no time was turgor lost during the growing season.
Plots of the differences between midday and predawn values of Ψ and Ψp versus ozone uptake for the three trees revealed no statistically significant differences between trees (Fig-ure 5b). With increasing ozone uptake, ∆Ψp was constant, whereas ∆Ψ decreased with increasing ozone uptake. The elevated ozone treatments caused a small decrease in Ψ, but because there was no change in turgor with increasing ozone uptake, the data suggest that osmotic adjustment occurred.
Photosynthetic pigments
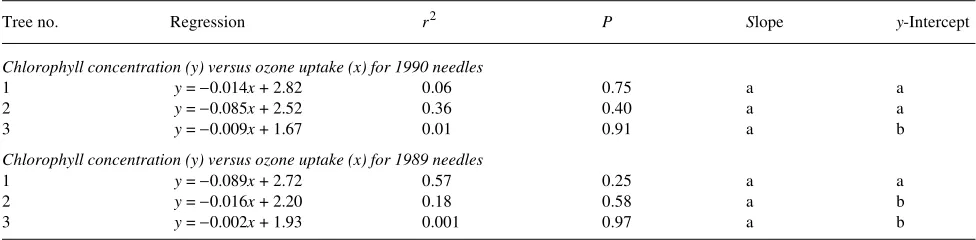
The chlorophyll concentrations of both 1989 and 1990 needles from tree No. 3 were lower than those of 1989 and 1990 needles of the other two trees and showed no change in slope in response to ozone uptake (Table 3). The slope of the regres-sion line declined with increasing ozone uptake only for 1990
Figure 4. Regressions of the relationships between (a) CER, (b) gs, and
(c) dark respiration and ozone uptake for the three experimental trees at the end of the experimental treatment (September 19, 1990). The composite regression for the combined response of the three trees is given at the bottom of each graph. There were no statistically signifi-cant differences between the slopes of the regression. Signifisignifi-cant differences in the y-intercepts at P < 0.05 are indicated by different letters placed in front of the equations for each tree response. Each symbol represents the mean ± 1 SE of 2--4 measurements of gas exchange per tree. In all cases, the SE was contained within the symbol.
needle tissue of tree No. 2 and for 1989 needle tissue of tree No. 1. By the end of the experiment, chlorophyll concentra-tions of 1989 needle tissue was similar for all three trees.
Growth rates
There was no significant effect of ozone on branch growth (June 26: P = 0.47, 0.36 cm; July 23: P = 0.39, 2.10 cm, July 23; September 20: P = 0.83, 3.10 cm).
Discussion
Reich (1987) suggested that differences in leaf conductance between physiognomic groups (crops, hardwoods, conifers) could explain differences in response to atmospheric ozone because ozone uptake is a function of leaf conductance. Within a species, ozone uptake as a function of leaf conductance may also vary at the population level because of genetic differences, aging effects (as from seedling to mature tree), and differences in microenvironment. We observed variability in ozone uptake among three 125-year-old giant sequoia trees exposed to the same ozone concentrations that was caused by differences in both diurnal and seasonal patterns of stomatal conductance.
In giant sequoia, sensitivity to ozone decreases with increas-ing age of the tree (Grulke et al. 1989, Bytnerowicz and Grulke 1992, Grulke and Miller 1994) as does stomatal conductance (gs) of current-year foliage (from 355 mmol m−2 s−1 in current-year seedlings to 200 mmol m−2 s−1 in 2-year-old seedlings to 50 mmol m−2 s−1 in 20-, 125-, and 2,000-year-old trees). In contrast, red oak seedlings have lower gs than older trees (30 years old), and older trees have greater ozone uptake and exhibit greater damage to the photosynthetic system than seed-lings (Samuelson and Edwards, 1993, Hanson et al. 1994).
When the data for the three giant sequoia trees were com-bined, there was no significant effect of ozone on CER (Fig-ure 3a), The regression fit did not improve when hourly averages under 60 ppb or 100 ppb were excluded from the cumulative totals (Weber et al. 1993, Hanson et al. 1994, but see Lee et al. 1988). Although a plot of the relationship be-tween CER and ozone uptake (Figure 3b) demonstrated a significant decrease in CER during the second half of the exposure period compared with the first; the difference in response between the two periods may simply reflect the fact
that the overall gas exchange of the trees declined near the end of the growing season.
Separate analyses of the three trees indicated that each tree had a different response to ozone treatment. In general, if there was a decline in CER in response to ozone uptake, much of the decline occurred at low ozone dose (0--100 ppm-h) or uptake (0--2 mmol m−2). Although the ozone-induced decline in CER of giant sequoia seedlings could be explained on the basis of differences in dark respiration (Grulke et al. 1989), the re-sponse of older foliage, although generally less sensitive to ozone, was more complex. The most sensitive tree (No. 3) had the highest gs and CER at subambient ozone concentrations (Figures 4a and 4b), and gas exchange declined with increas-ing ozone uptake. The two trees (No. 1, resistant, and No. 3, sensitive) that demonstrated decreases in CER with increasing ozone uptake also had higher respiration rates (Figures 4a and 4c). However, the most sensitive tree (No. 3) had an interme-diate respiration rate relative to the two resistant trees (Nos. 1 and 2, Figure 4c). We postulate that several characteristics including high CER and gs and a relatively low photosynthetic pigment concentration predisposed tree No. 3 to ozone sensi-tivity (Figures 4a and 4b).
The greater stomatal conductance and photosynthetic rate of the ozone-sensitive tree (No. 3) compared with trees Nos. 1 and 2 may indicate a different carbon allocation pattern in tree No. 3 compared with the other two trees. In trees Nos. 1 and 2, low photosynthetic rates were coupled with a lack of response to increasing ozone uptake, suggesting that the secondary branches of these trees imported carbon for repair activities and thus were not autonomous with respect to carbon (Sprugel et al. 1991).
We conclude that individual trees of giant sequoia differ in ozone uptake, have different thresholds of response to ozone, and exhibit subtle differences in a variety of physiological responses to ozone. In a study of 19 half-sibling families of ponderosa pine in response to 1.5× ambient ozone, visible damage varied from 0 to 24% needle chlorosis, but sensitivity to ozone was not correlated with mean rate of growth (Temple et al. 1992). In a study of four clones of Norway spruce (Picea abies), all clones had similar photosynthetic capacity in ambi-ent ozone, but only one clone exhited reduced photosynthetic capacity and reduced photosynthetic pigment concentration when exposed to elevated ozone or acidic mist (Fuhrer et al. Table 1. Relationship between chlorophyll concentration (mg gdw−1) and ozone uptake (mmol m−2) for (a) 1990 needles and (b) 1989 needles. The
same letter denotes no significant differences at P = 0.05 within a needle age class.
Tree no. Regression r2 P Slope y-Intercept
Chlorophyll concentration (y) versus ozone uptake (x) for 1990 needles
1 y = −0.014x + 2.82 0.06 0.75 a a
2 y = −0.085x + 2.52 0.36 0.40 a a
3 y = −0.009x + 1.67 0.01 0.91 a b
Chlorophyll concentration (y) versus ozone uptake (x) for 1989 needles
1 y = −0.089x + 2.72 0.57 0.25 a a
2 y = −0.016x + 2.20 0.18 0.58 a b
1990). Our data indicate that, in giant sequoia, highly sensitive individuals will be selected against at a young age (Grulke and Miller 1994), and, if atmospheric ozone concentrations con-tinue to increase, older trees with ozone-sensitive attributes will have reduced net carbon uptake and will become more susceptible to other environmental stresses and pathogens.
Acknowledgments
This project would not have been possible without the support of K. Stolte of the Air Quality Division, National Park Service, the research staff at Sequoia National Park, specifically D. Parsons, D. Ewell, and A. Esperanza, and field assistance by A. Gomez, Pacific Southwest Research Station, USDA Forest Service, Riverside, California. We thank Steve Roberts of Data Designs, Inc. for writing the ozone control program and providing valuable operational assistance. A special thanks to E.N. Grulke for care of NG’s infant son while she was conducting field work.
References
Arnon, D.I. 1949. Copper enzymes in isolated chloroplasts: polyphe-nol-oxidase in Beta vulgaris. Plant Physiol. 24:1--15.
Blumenthal, D.L., T.B. Smith, D.E. Lehrman, R.A. Rasmussen, G.Z. Whitten and R.Z. Baxter. 1985. Southern San Joaquin Valley ozone study. Final Report for Western Oil and Gas Association, Los Angeles, CA. Contract No. 84-8.0.05(2)-07-01 by Sonoma Tech., Inc., and Systems Applications, Inc., STI Report 94100-510-FR, 228 p.
Bytnerowicz, A. and N.E. Grulke. 1992. Physiological effects of air pollutants on western trees. In The Response of Western Forests to Air Pollution. Eds. R.K. Olson, D. Binkley and M. Bohm. Springer-Verlag, New York, pp 183--234.
Bytnerowicz, A, M. Tranh and P. Anderson. 1995. Effects of charcoal air filtration and ozone generation on concentrations of some N and S compounds in open-top field chambers. Atmos. Environ. 29:1355--1358.
Field, C. and H. Mooney. 1986. The photosynthesis--nitrogen relation-ship in wild plants. In On the Economy of Plant Form and Function. Ed. T.J. Givnish. Cambridge University Press, Cambridge, pp 25--55.
Fuhrer G., M.Dunkl, D. Hnoppik, H. Selinger, L.W. Blank, H.D. Payer and O.L Lange. 1990. Effects of low-level long-term ozone fumiga-tion and acid mist on photosynthesis and stomata of clonal Norway spruce (Picea abies (L.) Karst.). Environ. Pollut. 64:279--293. Grulke N.E. and P.R. Miller. 1994. Changes in gas exchange
charac-teristics during the life span of giant sequoia: implications for response to current and future concentrations of atmospheric ozone. Tree Physiol. 14:659--668.
Grulke, N.E., P.R. Miller, R.D. Wilborn and S. Hahn. 1989. Photosyn-thetic response of giant sequoia seedlings and rooted branchlets of mature foliage to ozone fumigation. In Effects of Air Pollution on Western Forests. Eds. R.K. Olson and A.S. Lefohn. Trans. Air and Waste Manage. Assoc., Anaheim, CA, pp 429--441.
Hanson P.J., L.J. Samuelson, S.D. Wullschleger, T.A. Tabberer and G.S. Edwards. 1994. Seasonal patterns of light-saturated photosyn-thesis and leaf conductance for mature and seedling Quercus rubra L. foliage: differential sensitivity to ozone exposure. Tree Physiol. 14:1351--1366.
Hartesveldt, R.J., H.T. Harvey, H.S. Shellhammer, R.E. Stecker. 1975. The giant sequoia of the Sierra Nevada. USDI, National Park Service, Washington, D.C. Govt. Doc. No. 024-005-00618-4, 180 p.
Hiscox, J.D. and G.F. Israelstam. 1979. A method for the extraction of chlorophyll from leaf tissue without maceration. Can. J. Bot. 57:1332--1334.
Houpis, J.L.J., M.P. Costella and S. Cowles. 1991. A branch exposure chamber for fumigating ponderosa pine to atmospheric pollution. J. Env. Qual. 20:467--474.
Laisk A., O.Kull and H. Moldau. 1989. Ozone concentration in leaf intercellular air species is close to zero. Plant Physiol. 90:1163--1167.
Lee, E.H., D.T. Tingey and W.E. Hogsett. 1988. Evaluation of ozone exposure indices in exposure-response modeling. Environ. Pollut. 53:43--62.
Miller, P.R., N.E. Grulke and K.W. Stolte. 1994. Air pollution effects on giant sequoia ecosystems. Proc. Giant Sequoia Symp., General Technical Report, PSW-GTR-151, pp 90--98.
Miller, P.R. and A.A. Millecan. 1971. Extent of oxidant air pollution damage to some pines and other conifers in California. Plant Dis-ease Rep. 55:555--559.
Miller, P.R. 1987. Ozone effects on important tree species of Sequoia and Kings Canyon National Parks, Final Report on 1985 and 1986 Research for the Interagency Agreement No. 0475-4-8007 to the Air Quality Division, National Park Service, Denver, CO, 43 p. Pallardy, S.G., J.S. Pereira and W.C. Parker. 1991. Measuring the state
of water in tree systems. In Techniques and Approaches in Forest Tree Ecophysiology. Eds. J.P. Lassoie and T.M. Hinckley. CRC Press, Boca Raton, FL, pp 37--39.
Peterson, D.L., M.J. Arbaugh, V.A. Wakefield and P.R. Miller. 1987. Evidence of growth reduction in ozone-injured Jeffrey pine (Pinus jeffreyi Grev. and Balf.) in Sequoia and Kings Canyon National Parks. J. Air Pollut. Control Assoc. 37:906.
Peterson, D.L., M.J. Arbaugh and L.J. Robinson. 1991. Regional growth changes in ozone-stressed ponderosa pine (Pinus ponder-osa) in the Sierra Nevada, California, USA. The Holocene 1:50--61. Pronos, J., D.R. Vogler and R.S. Smith, Jr. 1978. An evaluation of ozone injury to pines in the southern Sierra Nevada. Report No. 78-1. FIDM, USDA Forest Service, Regional Office, San Fran-cisco, CA, 17 p.
Reich, P.B. 1987. Quantifying plant response to ozone: a unifying theory. Tree Physiol. 3:63--91.
Samuelson, L.J. and G.S. Edwards. 1993. Tree versus seedling sensi-tivity to ozone in Quercus rubra L. New Phytol. 125:373--379. Sprugel, D.G., T. M. Hinckley and W. Schaap. 1991. Theory and
practice of branch autonomy. Annu. Rev. Ecol. Syst. 22:309--334. Stolte, K.W., M.I. Flores, D.R. Mangis and D.B. Joseph. 1991.
Con-centrations of ozone in National Park Service Class I areas and effects on sensitive biological resources. Paper 91-144.3. Temple, P.J. 1988. Injury and growth of Jeffrey pine and giant sequoia
in response to ozone and acidic mist. Environ. Exp. Bot. 28:323--333.
Temple, P.J., G.H. Riechers and P.R. Miller. 1992. Foliar injury re-sponses of ponderosa pine seedlings to ozone, wet and dry acidic deposition, and drought. Environ. Exp. Bot. 32:101--113.
Teskey, R.O., P.M. Dougherty and A.E. Wiselogel. 1991. Design and performance of branch chambers suitable for long-term ozone fu-migation of foliage in large trees. J. Environ. Qual. 20:591--595. Unger, C.D. 1978. The transport of photochemical smog in the Central
Valley and the Sierra Nevada Mountains of California. In Proc. Conference on Sierra Nevada Meteorology. America Meteorologi-cal Society, Boston, MA, 38 p.