i
THE MALAYSIAN REGISTRY
of
RENAL BIOPSY 2012
Editors :
Rosnawati Yahya Wan Jazilah Wan Ismail
With contributions from:
Wan Shaariah, Sunita B, Yap Y C, Wong H S, Lee DG, Lim J Y, Premaa S, Tassha H A
THE MALAYSIAN REGISTRY
of
RENAL BIOPSY
2012
Sponsors:
Malaysian Society of Nephrology
The National Renal Registry is funded with grants from:
Roche Ain Medicare Baxter Healthcare Fresenius Medical Care
Lucenxia
The Ministry of Health Malaysia
iii ISSN 1985-6989
Published by:
The National Renal Registry Malaysian Society of Nephrology Suite 1604, Plaza Permata No. 6, Jalan Kampar 50400 Kuala Lumpur Malaysia
Telephone. : (603) 4045 8636 Direct Fax : (603) 4042 7694 e-mail : [email protected]
Web site : http://www.msn.org.my
Cover illustration by Dr. Nik Hasimah Nik Yahya HKL
Important information:
This report is copyrighted. However it may be freely reproduced without the permission of the National Renal Registry. Acknowledgment would be appreciated. Suggested citation is:
Rosnawati Yahya, Wan Jazilah W I (Eds) 5th Report of the Malaysian Registry of Renal Biopsy 2012. Kuala Lumpur 2014.
The National Renal Registry would like to thank the following:
All the nephrologists and staff of the participating hospitals
For their hard work and contribution,
The Ministry of Health, Malaysia
for support seen and unseen,
For their generous support: -
Roche Ain Medicare Baxter Healthcare Fresenius Medical Care
Lucenxia
The staff of the Clinical Research Centre
&
v Clinical Registry Manager Lee Day Guat
Clinical Research Assistant Suhazelini Ali Choo Cheh Loo
Statistician Adam bin Bujang
Premaa A/P Supramaniam Tassha Hilda binti. Adnan Nurakmal Baharum
Members: MSN appointment: Facilities
Datuk Dr. Ghazali Ahmad Chairman Hospital Kuala Lumpur
Dr. Abdul Halim Abd Gafor
Dr. Ong Loke Meng CRC representative Hospital Penang
Mr. Tam Chong Chiang ADMAN representative Hospital Tg. Ampuan
Afzan
Dr. Lim Yam Ngo MDTR sub-committee Chairperson Hospital Kuala Lumpur Dr. Wong Hin Seng eMOSS sub-committee Chairperson Hospital Selayang
Dr. Rosnawati Yahya MRRB sub-committee Chairperson Hospital Kuala Lumpur
Dr. Goh Bak Leong MDTR Editor Hospital Serdang
Dr. Rafidah Abdullah Honorary MSN Treasurer Hospital Selayang
Renal biopsy remains the main investigation in the diagnosis of renal diseases. In addition, it plays a major role in determining the management and prognosis of parenchymal renal disease. The collection of demographic, clinical and laboratory data at the time of biopsy and the set up of a database are useful tools for studying renal parenchymal diseases.
The development of a renal biopsy registry in each country promotes many advantages and these include comparison in incidence of renal diseases, identification of different policies and practices in renal biopsy in different areas, linkage with other registries such as dialysis or transplant registry and identification of rare renal diseases. Thus, the registry is a source of epidemiological data and would provide useful information in the planning of health care and in organizing prospective clinical studies. The incidence of glomerular disease varies according to population, demographic characteristics, environmental factors, socio-economic status and the prevalence of infectious diseases. At present, there is limited information on the prevalence and incidence of glomerular disease, its potential disease burden and the temporal trend in Malaysia. Hence, the Malaysian Registry of Renal Biopsy (MRRB) was set up in 2005 to address this deficiency.
The MRRB collects information about patients who undergo renal biopsy in Malaysia. The MRRB is a new component of National Renal Registry (NRR), which has been operating the Malaysian Dialysis and Transplant Registry (MDTR) since 1993.
Objectives
The objectives of the MRRB registry are to:
1. Determine the disease burden attributable to glomerular disease (GD) by quantifying its incidence and prevalence, and its geographic and temporal trends in Malaysia.
2. Identify subgroups in the population at high risk of GD to whom preventive efforts should be targeted.
3. Identify potential causal and risk factors involved in GD. 4. Describe the clinical presentation and spectrum of GD.
5. Stimulate and facilitate basic, clinical and epidemiological research on GD. 6. Identify causes of allograft failure in our renal transplant population.
vii
Source Data Providers Target groups or Users
Owner
The Malaysian Society of Nephrology (MSN) is the owner of this registry.
Sponsors
The MRRB is sponsored by the Malaysian Society of Nephrology (MSN) and the Ministry of Health, Malaysia.
NRR Advisory Committee
This is the committee established by the sponsors. The NRR Advisory Committee’s role is to ensure that the MRRB stay focused on its objectives and to assure its continuing relevance and justification.
MRRB Steering Committee
The MRRB Working Committee supervises its operations.
National Renal Registry office
The NRR coordinating office is the designated coordinating center. It coordinates the data collection among the Source Data Providers (SDPs). It collaborates with Clinical Research Centre of Hospital Kuala Lumpur that provides epidemiological and statistical support for MRRB.
The following documents need to be completed and returned to facilitate participation.
• Centre Participation Self Reply Form • Authorization Form
• Information Security Policy/User Agreement . One form per nominee as listed in the Authorization
form. Users must have a personal mobile phone to received SMS authentication.
Upon receiving these documents, the centre shall be registered and each of the users of the MRRB shall be notified via their e-mail address.
Methodology
All patients from participating centres who undergo any kidney biopsy (native or graft) are to be enrolled into the registry.
ix Report Report Report Report Report
CONTRIBUTING EDITORS
Chapter Title Authors Institutions
1 Overview of Renal Biopsy in
Malaysia Wan Sha’ariah Md Yusuf Tuanku Ja’afar Hospital Lee Ming Lee Tuanku Ja’afar Hospital
Lee Day Guat National Renal Registry
2 Primary Glomerulonephritis Sunita Bavanandan Kuala Lumpur Hospital
Lim Soo Kun University Malaya Medical
Centre
3 Secondary Glomerulonephritis Rosnawati Yahya Kuala Lumpur Hospital
Kok Lai Sun Pulau Pinang Hospital
4 Paediatric Renal Biopsy Lee Ming Lee Tuanku Ja’afar Hospital
Lim Yam Ngo Kuala Lumpur Hospital
Lynster Liaw Pulau Pinang Hospital
Susan Pee Sultan Ismail Hospital
Wan Jazilah Wan Ismail Selayang Hospital Yap Yoke Chin Kuala Lumpur Hospital Mirunalini A/P Appadurai Likas Hospital
Selvakumar Sivapunniam Tengku Ampuan Afzan Hospital
5 Renal Allograft Biopsy Wong Hin Seng Selayang Hospital
Leong Chong Meng Sultanah Bahiyah Hospital
xi 1
1.1 Introduction 2
1.2 Renal biopsies from the participating centres 2
1.2.1 Ascertainment rate of total biopsy performed 2
1.2.2 Type of renal biopsy performed 2
1.2.3 Number of renal biopsy done on each individual patient 2 1.2.4 Demographic distribution of renal biopsy (Native and Graft) 5
1.2.4.1 Age distribution 5
1.2.4.2 Gender distribution 6
1.2.4.3 Racial distribution 7
1.2.5 Renal biopsy report analysis 7
1.2.6 Histopathology specimen distribution to histopathology laboratories 8
1.3 Native kidney biopsy 11
1.3.1 Clinical Indications of renal biopsy 11
1.3.2 Histopathological diagnosis 12
1.3.3 Histopathology findings in common clinical presentation 14 1.3.3.1 Histopathological diagnosis in patients with nephrotic syndrome 14 1.3.3.2 Histopathological diagnosis in patients with urinary abnormalities 15 1.3.3.3 Histopathological diagnosis in patients with nephritic-nephrotic
syndrome 16
1.3.3.4 Histopathological diagnosis in patients with nephritic syndrome 17
1.3.3.5 Primary GN according to various age group 18
2.2.2 Patient population and characteristics 20
2.2.3 Clinical presentation 22
2.2.3.1 Clinical presentation by age 23
2.2.3.2 Clinical presentation by gender 26
2.2.4 Outcome of Minimal Change Disease 27
2.3 Focal Segmental Glomerulosclerosis (FSGS) 28
2.3.1 Introduction 28
2.3.2 Patient population and characteristics 28
2.3.3 Clinical Presentation 29
2.3.3.1 Clinical presentation by age 32
2.3.3.2 Clinical presentation by gender 34
2.3.4 Outcome of Focal Segmental Glomerulosclerosis 35
2.4 IgA Nephropathy (IgAN) 36
2.4.1 Introduction 36
2.4.2 Patient population and characteristics 36
2.4.3 Clinical presentation 37
2.4.3.1 Clinical Presentation by age 39
2.4.3.2 Clinical presentation by gender 42
2.5 Idiopathic Membranous Nephropathy 45
2.5.1 Introduction 45
2.5.2 Patient population and characteristics 45
2.5.3 Clinical presentation 46
2.5.3.1 Clinical presentation by age 48
2.5.3.2 Clinical presentation by gender 50
2.5.4 Outcome of Idiopathic Membranous Nephropathy 51
CHAPTER 3 SECONDARY GLOMERULONEPHRITIS 53
3.1 Introduction 54
3.2.3.3 Clinical Presentations by histopathology 61
3.2.4 Renal function at presentation 63
3.2.4.1 Renal function at presentation by age group 63
3.2.4.2 Renal function at presentation by gender 64
3.2.4.3 Renal function at presentation by histopathology 65
3.2.5 Histopathological diagnosis 67
3.2.5.1 Histopathological diagnosis by age 67
3.2.5.2 Histopathological diagnosis by gender 68
3.2.5.3 Histopathological diagnosis by clinical presentation 68
3.2.6 Extra-renal involvement 69
3.2.6.1 American Rheumatological Association (ARA) criteria in lupus
nephritis 69
3.2.6.2 ARA criteria in lupus nephritis by age 70
3.2.6.3 ARA criteria in lupus nephritis by gender 70
3.2.6.4 ARA criteria in lupus nephritis by histopathological findings 71
3.2.6.5 Extra-renal involvement 71
3.2.7 Survival in lupus nephritis 73
3.2.7.1 Death in patient with lupus nephritis 73
3.2.7.2 Patient survival in lupus nephritis 74
3.2.7.3 Renal survival in lupus nephritis 74
CHAPTER 4 PAEDIATRIC RENAL BIOBSY 77
4.1 Introduction 78
4.2 Number of patients and renal biopsies 78
4.2.1 Total number of patients and native renal biopsies 78
4.2.2 Number of patients from various hospitals 78
4.2.3 Number of native renal biopsies 78
4.2.4 Number of renal biopsy done on each individual patient 79
4.3 79
4.3.1 Adequacy of renal biopsy for diagnosis 79
4.3.2 Number of glomeruli obtained at each biopsy 79
xiii
4.6 Diagnosis of paediatric renal biopsies 82
4.7 Nephrotic syndrome 83
4.7.1 Renal histopathology diagnosis of children presenting with nephrotic
syndrome 83
4.7.2 The histopathological profile in different steroid response categories 83 4.8 Renal histopathology diagnosis of children presenting with nephritic syndrome 84 4.9 Causes of severe renal failure (needed dialysis therapy) 84 4.10 Paediatric focal segmental glomerulosclerosis and minimal change disease 85
4.10.1 Characteristics of paediatric focal segmental glomerulosclerosis and minimal change disease among children with steroid resistant nephrotic syndrome 85 4.10.2 Patient survival in focal segmental glomerulosclerosis and minimal change
disease 86
4.10.3 Renal survival of patient with focal segmental glomerulosclerosis and minimal
change disease 87
4.11 Paediatric lupus nephritis 88
4.11 Biopsy failure and complications 88
4.11.1 Total number of patients and renal biopsies 88
4.11.2 Number of renal biopsy done on each individual patient with lupus 88 4.11.3 Patient characteristics of paediatric lupus nephritis 89
4.11.4 Extra renal manifestations of paediatric SLE 90
4.11.5 Classification of paediatric lupus nephritis 90
4.11.6 Patient survival in lupus nephritis 91
4.11.7 Renal survival of patients with lupus nephritis 91
4.12 Renal outcome 91
4.13 Biopsy failure and complication 92
4.13.1 Risk factors for biopsy failure 92
4.13.2 Risk factors for complications 93
References 94
CHAPTER 5 RENAL ALLOGRAFT BIOPSY 95
5.1 Introduction
96
5.2 Number of renal allograft biopsy
96
5.2.1 Number of renal allograft biopsy by year 96
5.2.2 Number of renal allograft biopsy by year and site 97
5.2.3 Number of renal allograft biopsy by year and age group 97
5.3 Clinical presentation at biopsy 97
5.4 Timing of renal allograft biopsy
97
5.5 Renal allograft biopsy Procedure 102
5.5.1 Renal allograft biopsy method 102
5.5.2 Number of passes 102
5.5.3 Number of glomeruli obtained on biopsy 102
5.5.4 Type of complications 102
5.6 Histological diagnosis 106
Appendix I xxiv
Appendix II xxvi
Appendix III xxix
Page Table 1.2.1 Total number of renal biopsies performed by centres, 2005-2012 3 Table 1.2.2 Distribution of reported native and graft renal biopsies by centres,
2005-2012
4 Table 1.2.3 (a) Distribution of native renal biopsy in patients by number of episodes,
2005-2012
5 Table 1.2.3 (b) Distribution of renal allograft biopsy in patients by number of episodes,
2005-2012
5 Table 1.2.4.1 (a) Age distribution of native renal biopsy, 2005-2012 5 Table 1.2.4.1 (b) Age distribution of renal allograft biopsy, 2005-2012 6 Table 1.2.4.1 (c) Age group distribution of reported renal biopsies by state, 2005-2012 6 Table 1.2.4.2 (a) Gender distribution of native renal biopsy, 2005-2012 7 Table 1.2.4.2 (b) Gender distribution of renal allograft biopsy, 2005-2012 7 Table 1.2.4.3 (a) Racial distribution of native renal biopsy, 2005-2012 7 Table 1.2.4.3 (b) Racial distribution of renal allograft biopsy, 2005-2012 7 Table 1.2.5 Number of glomeruli obtained at each biopsy by centres, 2005-2012 8 Table 1.2.6 (a) Distribution of biopsy specimens to histopathology laboratories by
participating centres, 2005-2012
9 Table 1.2.6 (c) Summary of biopsies received by in house and external laboratories,
2007-2012
10 Table 1.2.6 (d) Histopathology laboratories receiving renal biopsy specimens,
2005-2012
11 Table 1.3.1 (a) Indications for native renal biopsies, 2005-2012 12
Table 1.3.1 (b) Renal function at time of biopsy, 2005-2012 12
Table 1.3.2 Histopathology of all native renal biopsies, 2005-2012 13 Table 1.3.3.1 HPE diagnosis in patients presenting with nephrotic syndrome,
2005-2012
14 Table 1.3.3.2 HPE diagnosis in patients presenting with asymptomatic urine
abnormalities, 2005-2012
15 Table 1.3.3.3 HPE diagnosis in patients presenting with nephritic-nephrotic syndrome,
2005-2012
16 Table 1.3.3.4 HPE diagnosis in patients presenting with nephritic syndrome,
2005-2012
17 Table 1.3.3.5 Primary GN according to the various age group, 2005-2012 18
Table 2.1 Primary Glomerulonephritis, 2005-2012 20
Table 2.2.2 (a) Demographic characteristics for MCD, 2005-2012 21 Table 2.2.2 (b) Age group at time of biopsy (years) for MCD, 2005-2012 21
Table 2.2.3 (a) Clinical presentation for MCD, 2005-2012 22
Table 2.2.3 (b) Presence of hypertension in MCD, 2005-2012 22
Table 2.2.3 (c) Renal function in MCD by year, 2005-2012 23
Table 2.2.3.1 (a) Clinical presentation by age group for MCD, 2005-2012 24 Table 2.2.3.1 (b) Hypertension by age group for MCD, 2005-2012 24 Table 2.2.3.1 (c) Renal function at presentation by age group for MCD, 2005-2012 25 Table 2.2.3.2(a) Clinical presentation by gender for MCD, 2005-2012 26
Table 2.2.3.2(b) Hypertension by gender for MCD, 2005-2012 26
xv
Table 2.3.3 (b) Presence of hypertension for FSGS, 2005-2012 30
Table 2.3.3 (c) Renal function in FSGS by year, 2005-2012 31
Table 2.3.3.1 (a) Clinical presentation by age group for FSGS, 2005-2012 32 Table 2.3.3.1 (b) Hypertension by age group for FSGS, 2005-2012 32 Table 2.3.3.1 (c) Renal function at presentation by age group for FSGS, 2005-2012 33 Table 2.3.3.2 (a) Clinical presentation by gender for FSGS, 2005-2012 34
Table 2.3.3.2 (b) Hypertension by gender in FSGS, 2005-2012 34
Table 2.3.3.2 (c) Renal function by gender for FSGS, 2005-2012 35 Table 2.3.4 (a) Patients survival estimates for death for FSGS, 2005 2012 35 Table 2.3.4 (b) Renal survival estimates for death for FSGS, 2005 2012 36 Table 2.4.2 (a) Demographic characteristics for IgAN, 2005-2012 36 Table 2.4.2 (b) Age group at time of biopsy (years) for IgAN, 2005-2012 37
Table 2.4.3 (a) Clinical presentation for IgAN, 2005-2012 38
Table 2.4.3 (b) Presence of hypertension in IgAN, 2005-2012 38
Table 2.4.3 (c) Renal function in IgAN by year, 2005-2012 39
Table 2.4.3.1 (a) Clinical presentation by age group for IgAN, 2005-2012 40 Table 2.4.3.1 (b) Hypertension by age group for IgAN, 2005-2012 40 Table 2.4.3.1 (c) Renal function at presentation by age group for IgAN, 2005-2012 41 Table 2.4.3.2 (a) Clinical presentation by gender for IgAN, 2005-2012 42
Table 2.4.3.2 (b) Hypertension by gender for IgAN, 2005-2012 42
Table 2.4.3.1 (c) Renal function by gender for IgAN, 2005-2012 43 Table 2.4.4 (a) Patients survival estimates for death in IgAN, 2005 2012 44 Table 2.4.4 (b) Renal survival estimates for death in IgAN, 2005 2012 44 Table 2.5.2 (a) Demographic characteristics for IMN, 2005-2012 45 Table 2.5.2 (b) Age group at time of biopsy (years) for IMN, 2005-2012 45
Table 2.5.3 (a) Clinical presentation for IMN, 2005-2012 46
Table 2.5.3 (b) Presence of hypertension in IMN, 2005-2012 47
Table 2.5.3 (c) Renal function in IMN, 2005-2012 47
Table 2.5.3.1 (a) Clinical presentation by age group for IMN, 2005-2012 48 Table 2.5.3.1 (b) Hypertension by age group for IMN, 2005-2012 48 Table 2.5.3.1 (c) Renal function at presentation by age group for IMN, 2005-2012 49 Table 2.5.3.2 (a) Clinical presentation by gender for IMN, 2005-2012 50
Table 2.5.3.2 (b) Hypertension by gender for IMN, 2005-2012 50
Table 2.5.3.2 (c) Renal function by gender for IMN, 2005-2012 51 Table 2.5.4 (a) Patients survival estimates for death in IMN, 2005 2012 51 Table 2.5.4 (b) Renal survival estimates for death in IMN, 2005 2012 51 Table 3.1 Causes of secondary glomerulonephritis in adult, 2005-2012 54 Table 3.2.2.1(a) Age group at time of biopsy (years), 2005-2012 55 Table 3.2.2.1(b) Age group at time of biopsy (years), 2005-2012 55
Table 3.2.2.2 Gender distribution, 2005-2012 56
Table 3.2.2.3 Ethnic distribution, 2005-2012 56
Table 3.2.3 Clinical presentation by year, 2005-2012 57
Table 3.2.3(a) Hypertension by year, 2005-2012 57
Table 3.2.3(b) Renal function by year, 2005-2012 58
Table 3.2.3.1(a) Clinical presentation by age group, 2005-2012 59
Table 3.2.3.1(b) Hypertension by age group, 2005-2012 59
Table 3.2.3.1(c) Renal function by age group, 2005-2012 60
Table 3.2.3.2(a) Clinical presentation by gender, 2005-2012 60
Table 3.2.3.2(b) Hypertension by gender, 2005-2012 61
Table 3.2.3.3 (a) Clinical presentations by histopathology in lupus nephritis, 2005-2012 62 Table 3.2.3.3 (b) Hypertension by histopathology in lupus nephritis, 2005-2012 62
Table 3.2.3.3(c) Renal function by histopathology, 2005-2012 63
Table 3.2.4.1 Renal function by age group in lupus nephritis, 2005-2012 64 Table 3.2.4.2 Renal function at presentation by gender, 2005-2012 65 Table 3.2.4.3 Renal function at presentation by histopathology, 2005-2012 66 Table 3.2.5 Histopathological diagnosis in lupus nephritis by year, 2005-2012 67 Table 3.2.5.1 Histopathological diagnosis by age group in lupus nephritis, 2005-2012 67 Table 3.2.5.2 Histopathological diagnosis by gender in lupus nephritis, 2005-2012 68 Table 3.2.5.3 Histopathological diagnosis by clinical presentation, 2005-2012 69
Table 3.2.6.1 ARA criteria in lupus nephritis, 2005-2012 69
Table 3.2.6.2 ARA criteria by age group, 2005-2012 70
Table 3.2.6.3 ARA criteria by gender, 2005-2012 70
Table 3.2.6.4 ARA criteria by histopathology, 2005-2012 71
Table 3.2.6.5 (a) Extra-renal involvement by gender, 2005-2012 71 Table 3.2.6.5 (b) Mucocutaneous involvement by gender in lupus nephritis, 2005-2012 72 Table 3.2.7.1 Death in patients with biopsy proven lupus nephritis, 2005-2012 73 Table 3.2.7.2 Patients survival estimates for death in lupus nephritis, 2005-2012 74 Table 3.2.7.3 Death censored renal survival estimates for lupus nephritis, 2005-2012 74
Table 4.2.2 Number of patients from various hospitals 78
Table 4.2.3 Number of renal biopsies 78
Table 4.2.4 Distribution of native renal biopsy in patients by number of attempts 79
Table 4.3.1 Conclusive report 79
Table 4.3.2 Number of glomeruli obtained at each biopsy 79
Table 4.4.1 Gender and racial distribution 80
Table 4.4.2 Age distribution 80
Table 4.5.1 Clinical presentation at biopsy 80
Table 4.5.2 Renal function at biopsy 81
Table 4.5.3(a) Hypertension at biopsy 81
Table 4.5.3(b) Type of antihypertensive drugs 81
Table 4.6 Diagnosis of paediatric renal biopsies 82
Table 4.7.1 Renal histopathology diagnosis of children presenting with nephrotic
syndrome 83
Table 4.7.2 The histopathological profile in different steroid response categories 83 Table 4.8 Renal histopathology diagnosis of children presenting with nephritic
syndrome 84
Table 4.9 Histology finding of children who had severe renal failure (needed
dialysis therapy) who underwent renal biopsy 84
Table 4.10.1 Clinical characteristics of children with steroid resistant nephrotic
syndrome, 2005-2012 85
Table 4.10.2 Patient survival for focal segmental glomerulosclerosis and minimal
change disease, 2005-2012 86
Table 4.10.3 Death-censored renal survival of patient with focal segmental
glomerulosclerosis and minimal change disease, 2005-2012 87
Table 4.11.1 Total number of patient and biopsies (SLE) 88
Table 4.11.2 Distribution of renal biopsy in patients with lupus by numbers of
episodes, 2005-2012 88
xvii Table 4.11.3.4 Dialysis therapy for paediatric lupus nephritis at the time of biopsy 89
Table 4.11.3.5 Patient with hypertension (SLE) 89
Table 4.11.3.6 Clinical presentation at biopsy (SLE) 89
Table 4.11.4(a) Clinical presentation of paediatric lupus 89
Table 4.11.4(b) ARA criteria at presentation 89
Table 4.11.5 Classification of paediatric lupus nephritis 90
Table 4.11.6 Patients survival in lupus nephritis 90
Table 4.11.7 Death-censored renal survival of patients with lupus nephritis,
2005-2012 91
Table 4.12 Causes of end stage renal disease in children who underwent renal
biopsy 92
Table 4.13.1 Frequency of complications 92
Table 4.13.2 Risk factors for complication 93
Table 5.2.1 Number of renal allograft biopsy, 2005-2012 96
Table 5.2.2 Number of renal allograft biopsy by centre, 2005-2012 98 Table 5.2.3 Renal allograft biopsy by year and age group, rate (per million
population), 2005-2012 99
Table 5.3 Indications for renal allograft biopsy, 2005-2012 100
Table 5.4 Timing of renal allograft biopsy, 2005-2012 101
Table 5.5.1 Biopsy method, 2005-2012 103
Table 5.5.2 Number of passes, 2005-2012 103
Table 5.5.3 Number of glomeruli obtained on biopsy, 2005-2012 104
Table 5.5.4 Type of complications, 2005-2012 105
Table 5.6 Histological diagnosis, 2005-2012 105
LIST OF
FIGURES
Page
Figure 1.2.6(a) Distribution of biopsy specimens to in house histopathology laboratories
by participating centres, 2005-2012 10
Figure 1.2.6(b) Distribution of biopsy specimens to external histopathology laboratories
by participating centres, 2005-2012 10
Figure 1.3.3.5 Primary GN according to the various age group, 2005-2012 18 Figure 2.2.2 (a) Demographic characteristics for MCD, 2005-2012 21 Figure 2.2.2 (b) Age at time of biopsy (years) for MCD, 2005-2012 21
Figure 2.2.3 (a) Clinical presentation for MCD, 2005-2012 22
Figure 2.2.3 (c) Impaired renal function in MCD by year, 2005-2012 23 Figure 2.2.3.1 (a) Clinical presentation by age group for MCD, 2005-2012 24 Figure 2.2.3.1 (b) Hypertension by age group for MCD, 2005-2012 25 Figure 2.2.3.1 (c) Renal function at presentation by age group for MCD, 2005-2012 25 Figure 2.2.3.2 (a) Clinical presentation by gender for MCD, 2005-2012 26
Figure 2.2.3.2 (b) Hypertension by gender for MCD, 2005-2012 26
Page Figure 2.3.2(a) Demographic characteristics for FSGS, 2005-2012 29 Figure 2.3.2 (b) Age at time of biopsy (years) for FSGS, 2005-2012 29
Figure 2.3.3 (a) Clinical presentation for FSGS, 2005-2012 30
Figure 2.3.3 (b) Presence of hypertension in FSGS, 2005-2012 30
Figure 2.3.3 (c) Impaired renal function in FSGS by year, 2005-2012 31 Figure 2.3.3.1 (a) Clinical presentation by age group for FSGS, 2005-2012 32 Figure 2.3.3.1 (b) Hypertension by age group for FSGS, 2005-2012 33 Figure 2.3.3.1 (c) Renal function at presentation by age group for FSGS, 2005-2012 33 Figure 2.3.3.2 (a) Clinical presentation by gender for FSGS, 2005-2012 34 Figure 2.3.3.2 (b) Hypertension by gender for FSGS, 2005-2012 34 Figure 2.3.3.2 (c) Renal function at presentation by gender in FSGS, 2005-2012 35 Figure 2.3.4 (a) Patients survival estimates for death in FSGS, 2005 2012 35 Figure 2.3.4 (b) Renal survival estimates for death in FSGS, 2005 2012 36 Figure 2.4.2 (a) Demographic characteristics for IgAN, 2005-2012 37 Figure 2.4.2 (b) Age at time of biopsy (years) for IgAN, 2005-2012 37
Figure 2.4.3 (a) Clinical presentation for IgAN, 2005-2012 38
Figure 2.4.3 (b) Presence of hypertension in IgAN, 2005-2012 38
Figure 2.4.3 (c) Renal function in IgAN by year, 2005-2012 39
Figure 2.4.3.1 (a) Clinical presentation by age group for IgAN, 2005-2012 40 Figure 2.4.3.1 (b) Hypertension by age group for IgAN, 2005-2012 41 Figure 2.4.3.1 (c) Renal function by age group for IgAN, 2005-2012 41 Figure 2.4.3.2 (a) Clinical presentation by gender for IgAN, 2005-2012 42 Figure 2.4.3.2 (b) Hypertension by gender for IgAN, 2005-2012 43 Figure 2.4.3.2 (c) Renal function by gender for IgAN, 2005-2012 43 Figure 2.4.4 (a) Patients survival estimates for death in IgAN, 2005 2012 44 Figure 2.4.4 (b) Renal survival estimates for death in IgAN, 2005 2012 44 Figure 2.5.2 (a) Demographic characteristics for IMN, 2005-2012 46 Figure 2.5.2 (b) Age at time of biopsy (years) for IMN, 2005-2012 46
Figure 2.5.3 (a) Clinical presentation for IMN, 2005-2012 47
Figure 2.5.3 (b) Presence of hypertension in IMN, 2005-2012 47
Figure 2.5.3.1 (a) Clinical presentation by age group for IMN, 2005-2012 48 Figure 2.5.3.1 (b) Hypertension by age group for IMN, 2005-2012 49 Figure 2.5.3.1 (c) Renal function at presentation by age group for IMN, 2005-2012 49 Figure 2.5.3.2 (a) Clinical presentation by gender for IMN, 2005-2012 50
Figure 2.5.3.2 (b) Hypertension by gender for IMN, 2005-2012 50
Figure 2.5.3.2 (c) Renal function by gender, 2005-2012 51
Figure 2.5.4 (a) Patients survival estimates for death in IMN, 2005 2012 51
Figure 2.5.4 (b) Renal survival estimates for death in IMN, 2005 2012 51 Figure 3.2.2.1 Age group at time of biopsy (years), 2005-2012 55 Figure 3.2.2.2 Gender distribution in lupus nephritis, 2005-2012 56 Figure 3.2.2.3 Ethic distribution in lupus nephritis, 2005-2012 56
Figure 3.2.3 Clinical presentation by year, 2005-2012 57
xix Figure 3.2.3.1 (a) Clinical presentation by age group in lupus nephritis, 2005-2012 58
Figure 3.2.3.3 (a) Clinical presentations by histopathology in lupus nephritis, 2005-2012 62 Figure 3.2.3.3 (b) Hypertension by histopathology in lupus nephritis, 2005-2012 62 Figure 3.2.4.1 Renal function by age group in lupus nephritis, 2005-2012 64 Figure 3.2.4.2 Renal function at presentation by gender, 2005-2012 65 Figure 3.2.4.3 Renal function at presentation by histopathology, 2005-2012 66 Figure 3.2.5.3 Histopathological diagnosis by clinical presentation, 2005-2012 68
Figure 3.2.6.1 ARA criteria in lupus nephritis, 2005-2012 69
Figure 3.2.6.2 ARA criteria in lupus nephritis by age group, 2005-2012 69 Figure 3.2.6.3 ARA criteria in lupus nephritis by gender, 2005-2012 70
Figure 5.4 Timing of renal allograft biopsy, 2005-2012 101
Figure 5.5.1 Biopsy method (censored for missing data), 2005-2012 102
Figure 5.5.2 Number of passes, 2005-2012 104
Figure 5.5.3 Number of glomeruli obtained on biopsy, 2005-2012 104
Figure 5.5.6 Histological diagnosis, 2005-2012 106
Figure 3.2.3.1 (b) Hypertension by age group in lupus nephritis, 2005-2012 59 Figure 3.2.3.1 (c) Impaired renal function by age group in lupus nephritis, 2005-2012 59 Figure 3.2.3.2 (a) Clinical presentation by gender in lupus nephritis, 2005-2012 60 Figure 3.2.3.2 (b) Hypertension by gender in lupus nephritis, 2005-2012 61 Figure 3.2.3.2 (c) Impaired renal function by gender in lupus nephritis, 2005-2012 61
Figure 3.2.6.4 ARA criteria in lupus nephritis by histopathology, 2005-2012 70 Figure 3.2.6.5 (a) Extra-renal involvement by gender in lupus nephritis, 2005-2012 72 Figure 3.2.6.5 (b) Mucocutaneous involvement by gender in lupus nephritis, 2005-2012 72
Figure 3.2.7.1 Death from lupus nephritis 73
Figure 3.2.7.2 Patients survival estimates for death in lupus nephritis 74 Figure 3.2.7.3 Death censored renal survival estimates in lupus nephritis 75 Figure 4.10.2 Patient survival by focal segmental glomerulosclerosis and minimal
change disease, 2005-2012 86
Figure 4.10.3 Renal survival by focal segmental glomerulosclerosis and minimal change
disease, 2005-2012 87
Figure 4.11.6 Patients survival in lupus nephritis 90
Figure 4.11.7 Death-censored renal survival of patients with lupus nephritis 91
Figure 5.2.1 Number of renal allograft biopsy, 2005-2012 96
Figure 5.2.3 Renal allograft biopsy by year and age group, rate per million population
2005-2012 99
CHAPTER 1: OVERVIEW OF RENAL BIOPSY IN MALAYSIA
This 5th report of Malaysian Registry of Renal Biopsy 2012 reports on renal biopsies performed from 1st January 2005 to 31st December 2012.
• There were 45 participating centres from the years 2005-2012.
• In 2012, there were 15 adult and 8 paediatric Ministry of Health centres, 3 universities, 1 army
hospital and 18 private centres.
• There were no new participating centres since 2010.
• There ascertainment rate has improved from 84.5% in 2010 to 95% in 2012.
• 9952 of 11219 renal biopsies that were performed from 2005-2012, were available for analysis. • 8657(87%) of renal biopsies were done on native kidneys and 1295(13 %) were on renal allograft. • There appeared to be more repeat graft biopsies in 2011-2012(52%) compared to the 2005-2010
period (42%).
• 66% of native kidney biopsies and 86 % of graft biopsies were done in the 15-45 years age group. • 14 % of native kidney biopsies were done in paediatric age group less than 15 years.
• As in previous reports, native kidney biopsies were performed in more females (59.5%) compared
to males (40.5%). This ratio remains unchanged since 2005.This was attributed to the higher number of females amongst patients diagnosed with SLE.
• The opposite was true for renal allograft biopsies where there were 63.5% males compared to
36.5% females.
• There were more Malays (58.1%) followed by Chinese (24.8%) in the native biopsy group. Chinese
(55%) predominates in the renal allograft group.
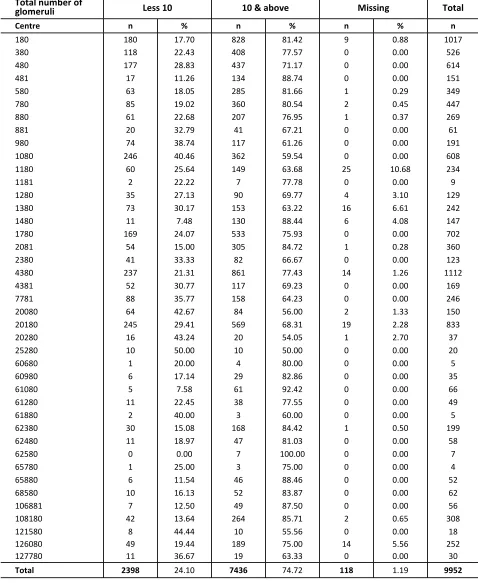
• Seventy-five percent of biopsies received were conclusive. 24% had less than 10 glomeruli. 1.2
percent was classified as missing because the full HPE reports were not submitted to the registry.
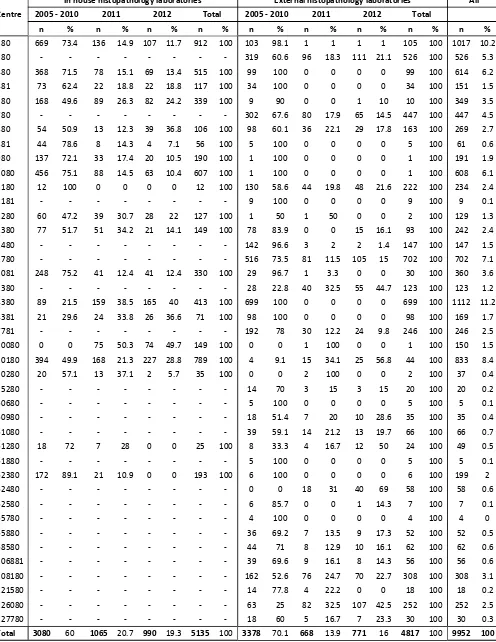
• Fifty one percent of HPE slides were read locally and 48.4 % were sent to another centre. There is
a gradual increase for biopsies to be read in the hospitals where biopsies were performed.
• Nephrotic syndrome was the leading indication for renal biopsy (40.9%) followed by
asymptomatic urinary abnormalities (28.6%) and nephrotic-nephritic syndrome (9.6%).
• The commonest primary glomerulonephritis in adults were minimal change disease (32%) FSGS
(29%) and IgA nephropathy (22%).
• Membranous glomerulonephritis constituted 9% of total primary glomerulonephritis.
• Lupus nephritis was the commonest secondary glomerulonephritis accounting for 80% followed
by diabetic nephropathy at 11%.
• FSGS was the commonest primary glomerulonephritis in children less than 15 years age group
(39.4%) followed by minimal change disease (34.7%)
CHAPTER 2: PRIMARY GLOMERULONEPHRITIS
The commonest primary glomerulonephritis found on adult kidney biopsies 2005-2012 were as follows: minimal change disease (32%), focal segmental glomerulosclerosis (29%) Ig A nephropathy (22%) and idiopathic membranous nephropathy (9%).
xxi Minimal Change Disease
• Accounted for 32% of total primary glomerulonephritis.
• 70% of patients present in the 15 to < 25 and 25 to < 35 age groups.
• There was a higher incidence of minimal change disease in males (65%) compared to females but
there were no racial predilection.
• Nephrotic syndrome was the commonest clinical presentation at 78%.
• Most patients have normal BP (74%) and preserved renal function ( 73%) at presentation. • The 5 year patient and renal survival was 94% and 98% respectively.
Focal Segmental Glomerulosclerosis
• Accounted for 29% of total primary glomerulonephritis. • The mean age at presentation was 34.4 + 14.6 years. • Fifty- nine percent presented with nephrotic syndrome.
• The prevalence of hypertension and impaired renal function increased with age. • The 5 year patient and renal survival was 86% and 87 % respectively.
IgA nephropathy
• This constituted 22% of primary glomerulonephritis • 31.3% are between the ages of 15 to 45 years
• There is slight female preponderance (54% vs. 43%) which is contrary to what is reported in
literature
• Asymptomatic urine abnormality remains the most common presentation. (51%)
• Hypertension is seen in 44 .4% and eGFR < 60ml/min/1.73m2 is observed in 47.1% at
presentation.
• 5 year patient and renal survival were 93% and 78% respectively.
Idiopathic membranous nephropathy
• This constituted 9% of primary glomerulonephritis. • The mean age at presentation is 45.30 + 14.97.
• There were no gender differences but there is a predilection for Chinese race. • Sixty-seven percent presented with nephrotic syndrome.
• Hypertension was observed in 24.8% and renal impairment was seen increasingly as age
advances.
• 5 year patient and renal survival were 85% and 92% respectively.
CHAPTER 3: SECONDARY GLOMERULONEPHRITIS
The commonest secondary GN reported was lupus nephritis. Diabetic nephropathy was the second commonest glomerular disease reported.
Lupus nephritis
• Accounted for 81% of total secondary GN.
• Mean age at the time of biopsy in adult lupus nephritis was 30.3 ± 10.7 years. • Male to female ratio was 1 to 6.6
• Urine abnormality (35%) was the commonest clinical presentation followed by nephrotic
syndrome (27.5%).
• The commonest histopathological finding was WHO or ISN/RPS class IV or IV+V (61.3 %).
• There was no clear correlation between histopathological findings and clinical presentation.
• The prevalence of hypertension was higher in class IV or class IV +V.
• The prevalence of impaired kidney function correlated with histopathological findings. Class IV
was more likely to have impaired renal function.
• About 60% of cases with lupus nephritis fulfilled 4 or more American Rheumatological Association
(ARA) criteria at presentation.
• Fulfilling the ARA criteria does not predict the severity of renal lesion
CHAPTER 4: PAEDIATRIC RENAL BIOPSY
• 1224 renal biopsies were performed in 1113 children over a span of 13 years from 1999 until
2012.
• 95.6% of paediatric kidney biopsies were assessed to be adequate. This success is comparable to
reports from Thailand, United Kingdom and Japan.
• There were slightly more girls (50.8 %) and this was attributed to the higher number of girls
biopsied in the SLE group.
• The mean age at biopsy was 9.8+ 4 years.
• The racial distribution was as follows: Malays (64%) Chinese (19 %) and Indians (7.1%)
• 37.2% were hypertensive at presentation. Calcium channel blockers and ACE inhibitors were the
commonest anti-hypertensives prescribed.
• Nephrotic syndrome (50%) was the most frequent clinical diagnosis at presentation. Lupus
nephritis contributed the largest group at 25 % followed by FSGS (21.4%) and minimal change disease (20.5%).
• When comparing FSGS and minimal change disease, FSGS had lower renal survival at 5 years. The
renal survival for this group was 88% and 80% at 3 and 5 years respectively, whereas in the minimal change group the 3 and 5 years survival was 95% and 92% respectively.
• Patient survival was 91% and 87% at 3 and 5 years for FSGS group and was 96% and 91% at 3 and
5 years for minimal change group.
• In the paediatric lupus group that were dialysed at the time of biopsy the commonest HPE on
biopsy was class IV or class V+IV.
• Renal survival for patients with lupus nephritis was 95.5% and 93.3% at 3 and 5 years respectively. • 116 children were reported to the Malaysian Dialysis and Transplant Registry. The commonest
causes of ESRD were FSGS (31.9%) advanced glomerulosclerosis (18.1%) lupus nephritis (11.2%) and IgA nephropathy. (9.5%)
CHAPTER 5: RENAL ALLOGRAFT BIOPSY
• The number of renal allograft biopsy reported has increased despite a decreasing number of new
and existing renal transplant recipients for the past 8 years.
• Seventy-three percents of all renal allograft biopsies were performeds in the four main transplant
centres which are Hospital Kuala Lumpur, Hospital Selayang, Universitity Malaya Medical cente and Prince court Medical Centre.
• Seventy-one percent of renal allograft biopsies were performed in the age group 25 to < 55 years. • Gradual graft dysfunction as an indication for biopsy has increased 34.7 % in 2005 to 66.1% in
2012 (2 fold increase)
• About 40% of renal allograft biopsies were performed one year post renal transplantation. • Rejection (acute and borderline) has remained the most common histological diagnosis and
accounted for more than half of all allograft biopsies that were reported in 2012.
• The increasing trend of allograft biopsies with histological diagnosis of acute rejection appeared to
CHAPTER 1
Overview Of Renal Biopsy In Malaysia
Lee Ming Lee
Lily Mushahar
1.1: Introduction
The Malaysian Renal Registry of Renal Biopsy (MRRB) was introduced in 2005 to provide information on the incidence and prevalence of glomerular disease in Malaysia. Data submission includes both paediatric and adult renal biopsies performed from participating centres.
In the 1st MRRB Report 2007, the participating centres were only from the Ministry of Health (MOH) hospitals. The private, army and university hospitals participated in data submission from year 2008 onwards.
This 5th MRRB Report shows data for renal biopsies done in year 2011-2012. Data for year 2005-2010 were included for comparison in the report.
1.2: Type of renal biopsy performed
1.2.1: Ascertainment rate of total biopsy performed
A total of 45 centres participated in this MRRB report; 23 (15 adult and 8 paediatric) Ministry of Health (MOH) hospitals, 3 Universities, 1 army hospital and 18 private hospitals. All participating centres were identified by their individual source document provider (SDP) number. Although there were no new centres reporting to MRRB since 2010 the total number of biopsies performed had increased from 1538 in 2010 to 1733 in 2011 and 1761 in 2012 (Table 1.2.1).
It is encouraging to note that there appeared to be also a progressive improvement in the ascertainment rate. The average ascertainment rate for 2005-2010 was 72.1% while the ascertainment rate for 2011 was up to 90% and further increased to 95% in 2012.
1.2.2: Type of renal biopsy performed
The majority of biopsies reported were from native kidneys; 88% (from 2005-2010), 86.2% in 2011 and 83.5% in 2012 (Table 1.2.2). There was also a slight increase in trend of the total number of graft biopsies being done over the last 3 years.
1.2.3: Number of native renal biopsy performed on each individual patient (by number of
episodes) 2005-2012
Table 1.2.3(a): Distribution of native renal biopsy in patients by number of episodes, 2005-2012
Table 1.2.3(b): Distribution of renal allograft biopsy in patients by number of episodes, 2005-2012
Graft 2005-2010 2011 2012 Total
1.2.4: Demographic distribution of renal biopsy (Native and Graft)
1.2.4.1: Age distribution
About two thirds, (66%) of the native renal biopsies were done in the age group 15-45 years. Paediatric patients less than 15 years contributed to about 14% of the native biopsies. Very few biopsies (8.6%) were done in patients older than 55 years of age (Table 1.2.4.1(a)).
In graft biopsies, majority (86%) of the biopsies were done in the age group 15-55 years of age. Very few graft biopsies were from the extreme age groups; 4.2% in the <15 years and 11.4% in those above 55 years of age (Table 1.2.4.1(b)).
For adult patients (age > 15 years) the highest number of renal biopsy were reported in WP KL (26.7%), followed by Selangor (22.4%) and Penang (9.9%). In the paediatric age group (<15 years), the highest number of renal biopsy were reported in Wilayah Persekutuan KL (27.2%) followed by Johor (19.9%) and Selangor (16.4%) (Table 1.2.4.1(c)).
Table 1.2.4.1(a): Age distribution of native renal biopsy, 2005-2012
Table 1.2.4.1(b): Age distribution of renal allograft biopsy, 2005-2012
Table 1.2.4.1(c): Age group distribution of reported renal biopsies by state, 2005-2012
Year of
Total 916 100 5542 100 193 100 1540 100 166 100 1595 100 1275 100 8677 100
1.2.4.2: Gender distribution
Gender 2005-2010 2011 2012
n n n n %
Male 2176 589 599 3364 40.5
Female 3252 847 835 4934 59.5
Total 5428 1436 1434 8298 100
Total
Table 1.2.4.2(a): Gender distribution of native renal biopsy, 2005-2012
Gender 2005-2010 2011 2012
Table 1.2.4.2(b): Gender distribution of renal allograft biopsy, 2005-2012
1.2.4.3: Racial distribution
Amongst patients who had native renal biopsy, majority were Malays (58.1%), followed by Chinese (24.8%) (Table 1.2.4.3(a)). In the allograft renal biopsy group, majority were Chinese (52.7%) followed by Malay (31.5%) (Table 1.2.4.3(b)).
Table 1.2.4.3(a): Racial distribution of native renal biopsy, 2005-2012
Table 1.2.4.3(b): Racial distribution of renal allograft biopsy, 2005-2012
Table 1.2.6(a): Distribution of biopsy specimens to histopathology laboratories by participating centres, 2005-2012
Centre
In house histopathology laboratories External histopathology laboratories All 2005 - 2010 2011 2012 Total 2005 - 2010 2011 2012 Total
n % n % n % n % n % n % n % n % n %
Figure 1.2.6(a): Distribution of biopsy specimens to in house histopathology laboratories by participating centres, 2005-2012
Figure 1.2.6(b): Distribution of biopsy specimens to external histopathology laboratories by participating centres, 2005-2012
Table 1.2.6(c): Summary of biopsies received by in-house and external laboratories, 2007-2012
2007 2008 2009 2010 2012
n % n % n % n % n %
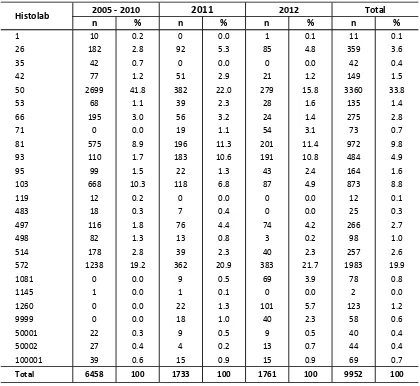
Table 1.2.6(d): Histopathology laboratories receiving renal biopsy specimens, 2005-2012
1.3.1: Clinical Indications of renal biopsy
Table 1.3.1(a) shows the main indications for native renal biopsies in 2005-2012 were nephrotic syndrome (40.9%), asymptomatic urine abnormality (28.6%), nephrotic-nephritic syndrome (9.6%) and nephritic syndrome (8.1%). This trend had remained the same over the last 8 years.
Table 1.3.1(a): Indications for native renal biopsies, 2005-2012
Clinical Presentations 2005-2010 2011 2012 Total
n % n % n % n %
Asymptomatic urine abnormality 1624 28.5 409 27.4 443 30.1 2476 28.6
Nephritic syndrome 480 8.4 124 8.3 96 6.5 700 8.1
Nephrotic syndrome 2492 43.8 558 37.3 490 33.3 3540 40.9
Nephrotic-Nephritic syndrome 505 8.9 187 12.5 136 9.2 828 9.6
Not available/Missing 591 10.4 216 14.5 306 20.8 1113 12.9
Total 5692 100 1494 100 1471 100 8657 100
Table 1.3.1(b): Renal function at time of biopsy, 2005-2012
Clinical Presentations 2005-2010 2011 2012 Total
n % n % n % n %
Normal 2936 51.6 729 48.8 670 45.5 4335 50.1
Impaired 2106 37.0 551 36.9 541 36.8 3198 36.9
Not available/Missing 650 11.4 214 14.3 260 17.7 1124 13.0
Total 5692 100 1494 100 1471 100 8657 100
1.3.2: Histopathological Diagnosis
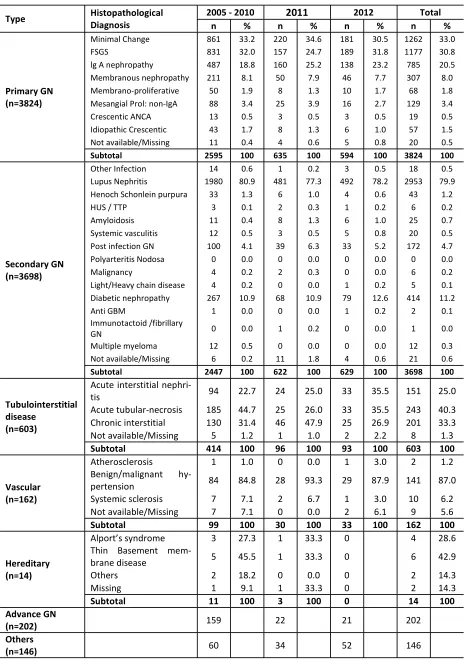
In the native kidney biopsy group; 3 most common primary glomerulonephritis (GN) reported were minimal change disease (33%), focal segmental glomerulosclerosis (FSGS) (30.8%) and IgA nephropathy (20.5%). Membranous nephropathy contributed 8% of the total primary GN subgroup (Table 1.3.2)
Table 1.3.2: Histopathology of all native renal biopsies, 2005-2012
Acute tubular-necrosis 185 44.7 25 26.0 33 35.5 243 40.3 Chronic interstitial 130 31.4 46 47.9 25 26.9 201 33.3 Not available/Missing 5 1.2 1 1.0 2 2.2 8 1.3
Subtotal 414 100 96 100 93 100 603 100
Vascular (n=162)
Atherosclerosis 1 1.0 0 0.0 1 3.0 2 1.2
Benign/malignant
hy-pertension 84 84.8 28 93.3 29 87.9 141 87.0 Systemic sclerosis 7 7.1 2 6.7 1 3.0 10 6.2 Not available/Missing 7 7.1 0 0.0 2 6.1 9 5.6
Subtotal 99 100 30 100 33 100 162 100
Alport’s syndrome 3 27.3 1 33.3 0 4 28.6
mem-Table 1.3.3.1: HPE diagnosis in patients presenting with Nephrotic Syndrome, 2005-2012
Type Histopathological Diagnosis n %
Primary GN
Minimal Change 969 26.9
FSGS 751 20.9
lg A nephropathy 182 5.1
Membranous nephropathy 207 5.8
Membrano-proliferative 33 0.9
Mesangial Proliferative GN-non IgA 51 1.4
Crescentic 0 0.0
Idiopathic crescentic 8 0.2
Not available/Missing 7 0.2
Sub total 2208 61.3
Secondary GN
Other infection 9 0.3
Lupus Nephritis 815 22.6
Henoch Schonlein Purpura 4 0.1
HUS/TTP 1 0.0
Amyloidosis 12 0.3
Systemic vasculitis 1 0.0
Post infection GN 29 0.8
Polyarteritis nodosa 0 0.0
Malignancy 1 0.0
Light/ heavy chain disease 1 0.0
Diabetic nephropathy 181 5.0
Anti GBM 0 0.0
Immunotactoid / fibrillary GN 0 0.0
Multiple myeloma 1 0.0
Not available/Missing 10 0.3
Sub total 1065 29.6
Others 327 9.1
Total 3600 100.0
1.3.3: Histopathology findings in common clinical presentation
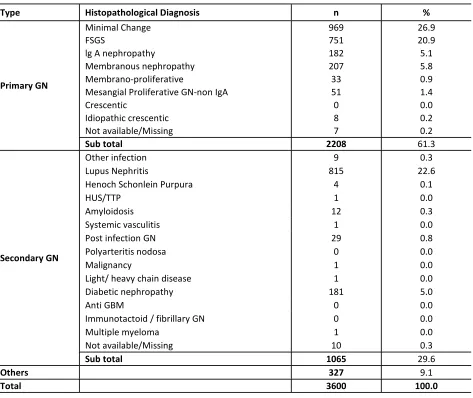
1.3.3.1: Histopathological diagnosis in patients with nephrotic syndrome
Table 1.3.3.1 showed that in patients presenting with nephrotic syndrome, the commonest histopathology reported was minimal change disease (26.9%) followed by lupus nephritis (22.6%) and FSGS (20.9%).
Table 1.3.3.2: HPE diagnosis in Patients presenting with Asymptomatic Urine Abnormalities, 2005-2012
Type Histopathological Diagnosis n %
Primary GN
Minimal Change 151 6.2
FSGS 232 9.6
lg A nephropathy 376 15.5
Membranous nephropathy 66 2.7
Membrano-proliferative 8 0.3
Mesangial Proliferative GN-non IgA 42 1.7
Crescentic 8 0.3
Idiopathic crescentic 13 0.5
Not available/Missing 6 0.2
Sub total 902 37.3
Secondary GN
Other infection 3 0.1
Lupus Nephritis 1031 42.6
Henoch Schonlein Purpura 22 0.9
HUS/TTP 0 0.0
Amyloidosis 8 0.3
Systemic vasculitis 5 0.2
Post infection GN 24 1.0
Polyarteritis nodosa 0 0.0
Malignancy 0 0.0
Light/ heavy chain disease 1 0.0
Diabetic nephropathy 90 3.7
Anti GBM 0 0.0
Immunotactoid / fibrillary GN 0 0.0
Multiple myeloma 7 0.3
Missing 5 0.2
Sub total 1196 49.4
Others 321 13.3
Total 2419 100.0
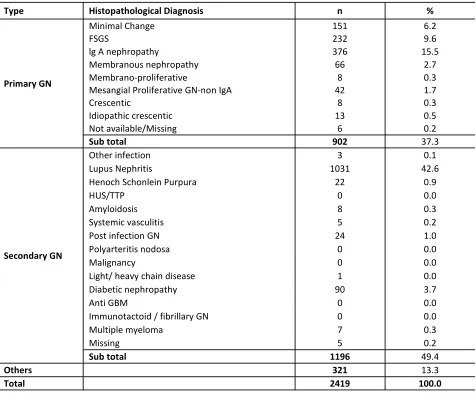
1.3.3.2: Histopathological diagnosis in patients with urinary abnormalities
In patients presenting with asymptomatic urinary abnormalities; lupus nephritis was the commonest histopathology (42.6%) followed by IgA nephropathy (15.5%) and FSGS (9.6%) (Table 1.3.3.2).
Table 1.3.3.3: HPE diagnosis in patients presenting with Nephritic-Nephrotic, 2005-2012
Type Histopathological Diagnosis n %
Primary GN
Minimal Change 49 5.7
FSGS 62 7.2
lg A nephropathy 78 9.0
Membranous nephropathy 13 1.5
Membrano-proliferative 11 1.3
Mesangial Proliferative GN-non IgA 15 1.7
Crescentic 2 0.2
Idiopathic cresentic 8 0.9
Not available/Missing 1 0.1
Sub total 239 27.7
Secondary GN
Other infection 5 0.6
Lupus Nephritis 427 49.5
Henoch Schonlein Purpura 8 0.9
HUS/TTP 1 0.1
Amyloidosis 0 0.0
Systemic vasculitis 2 0.2
Post infection GN 44 5.1
Polyarteritis nodosa 0 0.0
Malignancy 2 0.2
Light/ heavy chain disease 0 0.0
Diabetic nephropathy 24 2.8
Anti GBM 0 0.0
Immunotactoid / fibrillary GN 0 0.0
Multiple myeloma 1 0.1
Not available/Missing 2 0.2
Sub total 516 59.8
Others 108 12.5
Total 863 100.0
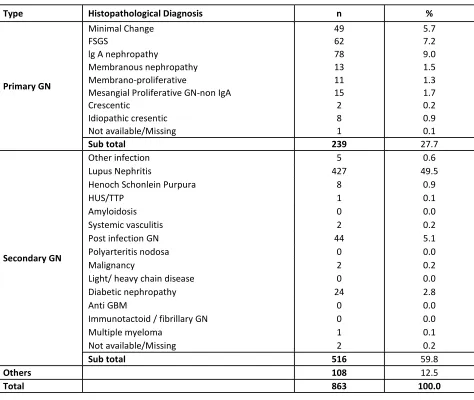
1.3.3.3: Histopathological diagnosis in patients with nephritic-nephrotic syndrome
In patients presenting with nephritic-nephrotic syndrome, the commonest histopathology diagnosis was lupus nephritis (49.5%) followed by IgA nephropathy (9%) and FSGS (7.2%).
Table 1.3.3.4: HPE diagnosis in Patients presenting with Nephritic syndrome, 2005-2012
Type Histopathological Diagnosis n %
Primary GN
Minimal Change 43 6.2
FSGS 55 7.9
lg A nephropathy 64 9.2
Membranous nephropathy 4 0.6
Membrano-proliferative 12 1.7
Mesangial Proliferative GN-non IgA 14 2.0
Crescentic 7 1.0
Idiopathic crescentic 13 1.9
Not available/Missing 5 0.7
Sub total 217 31.0
Secondary GN
Other infection 0 0.0
Lupus Nephritis 288 41.2
Henoch Schonlein Purpura 7 1.0
HUS/TTP 0 0.0
Amyloidosis 1 0.1
Systemic vasculitis 7 1.0
Post infectious GN 53 7.6
Polyarteritis nodosa 0 0.0
Malignancy 0 0.0
Light/ heavy chain disease 0 0.0
Diabetic nephropathy 22 3.1
Anti GBM 1 0.1
Immunotactoid / fibrillary GN 0 0.0
Multiple myeloma 0 0.0
Not available/Missing 1 0.1
Sub total 380 54.4
Others 102 14.6
Total 699 100
1.3.3.4: Histopathological diagnosis in patients with nephritic syndrome
In patients presenting with acute nephritic syndrome, the commonest GN was lupus nephritis (41.2%) followed by IgA nephropathy (9.2%) and FSGS (7.9%). Post infectious GN contributed 7.6% of this group.
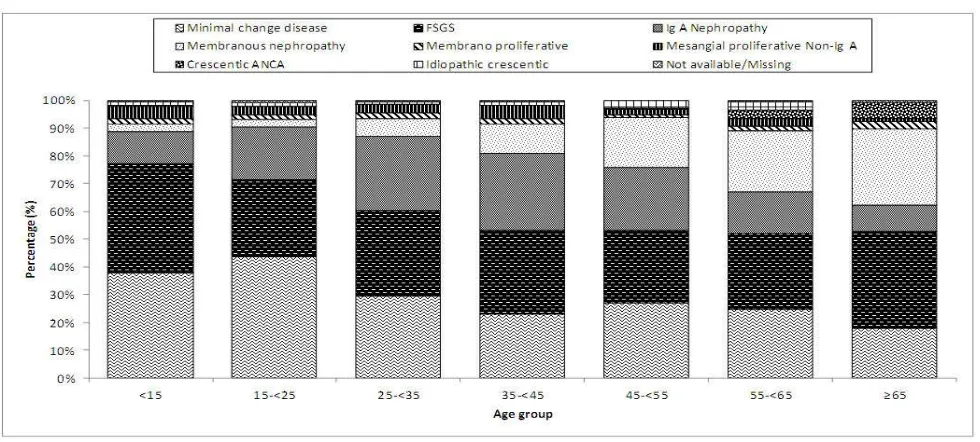
1.3.3.5: Primary GN according to various age group
FSGS (39.4%) was the commonest GN in the <15 years age group followed by minimal change disease (37.7%). This may be attributed to steroid resistant nephrotic syndrome as the main indication for biopsy in children. . Meanwhile, the commonest GN in the age group 15-<25 years were minimal change disease (43.5%) followed by FSGS (27.9%).
Among adults age 25-55 years old, FSGS (29%), minimal change disease (26.4%) and IgA nephropathy (25.8%) were the 3 commonest GN. In patients >55 years of age, the commonest GN was FSGS (31%) followed by membranous nephropathy (24.6%) (Table & Figure 1.3.3.5).
Figure 1.3.3.5: Primary gromerulonephritis according to the various age group, 2005-2012
Table 1.3.3.5: Primary gromerulonephritis according to the various age group, 2005-2012
Age <15 15-<25 25-<35 35-<45 45-<55 55-<65 ≥65 Total
n % n % n % n % n % n % n % n %
Minimal change
disease 247 37.7 468 43.5 241 29.4 126 23.0 105 26.9 56 24.6 19 17.9 1262 33.0 FSGS 258 39.4 300 27.9 252 30.7 164 30.0 103 26.3 63 27.6 37 34.9 1177 30.8
IgA Nephropathy 76 11.6 203 18.9 222 27.0 152 27.8 88 22.5 34 14.9 10 9.4 785 20.5
Membranous
nephropathy 17 2.6 29 2.7 53 6.5 58 10.6 71 18.2 50 21.9 29 27.4 307 8.0
Membrano-proliferative 13 2.0 18 1.7 16 1.9 10 1.8 4 1.0 4 1.8 3 2.8 68 1.8 Histopathological
Malaysian Registry of Renal Biopsy 2012
PRIMARY GLOMERULONEPHRITIS
CHAPTER 2
PRIMARY GLOMERULONEPHRITIS
PRIMARY GLOMERULONEPHRITIS
5th Report of the Malaysian Registry of Renal Biopsy 2012
2.1: Introduction
This chapter covers the main primary glomerulonephritis that were reported to the MRRB from the years 2005-2012.
Minimal change disease is the commonest glomerulonephritis in adults, contributing to 32% of all primary glomerulonephritis in Malaysia. This was followed by focal segmental glomerulosclerosis (29%) and Ig A nephropathy (22%). Idiopathic membranous nephropathy contributed only 9% of all biopsy-proven primary glomerulonephritis. The other types of primary glomerulonephritis were relatively uncommon (Table 2.1).
Table 2.1: Primary Glomerulonephritis, 2005-2012
2.2: Minimal Change Disease (MCD)
2.2.1: Introduction
Minimal change disease (MCD) is typically characterized by normal appearing glomeruli by light microscopy and absence of complement or immunoglobulin deposits by immunofluorescence microscopy. Glomerular size is usually normal by standard methods of light microscopy, although enlarged glomeruli may be observed. On electron microscopy, there is diffuse effacement ("fusion") of the epithelial foot processes. Minimal change disease is a major cause of nephrotic syndrome in both children and adults.
2.2.2: Patient Population and Characteristics
A total of 1015 cases of minimal change disease were reported in 2005-2012. The mean age of patients at the time of biopsy was 30.9 ± 13.6. Majority of patients (70%) belonged to age groups 15 to <25 and 25 to <35. The observed trend can be explained partly by the fact that most children with steroid
Malaysian Registry of Renal Biopsy 2012
PRIMARY GLOMERULONEPHRITIS
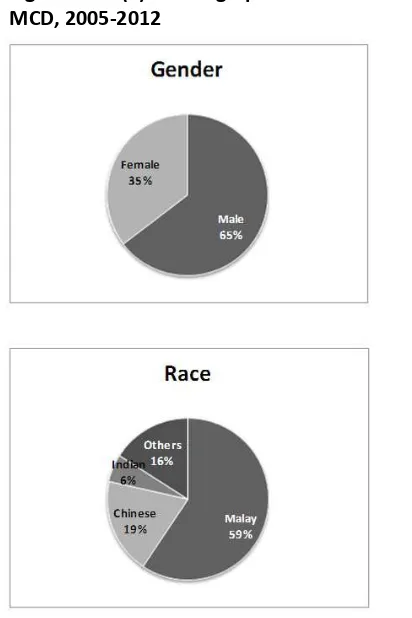
Table 2.2.2(a): Demographic characteristics for MCD, 2005-2012
Demographic Characteristics n %
Age (year)
There has been a consistently higher incidence of minimal change disease in male (65%) but there was no predilection of any particular eth-nic group. The pattern of racial distribution reflects the ethnic composition of patients ad-mitted to public hospitals (Table 2.2.2 (a)).
Table 2.2.2(b): Age group at time of biopsy (years) for MCD, 2005-2012
Age group
Figure 2.2.2(a): Demographic characteristics for MCD, 2005-2012
PRIMARY GLOMERULONEPHRITIS
5th Report of the Malaysian Registry of Renal Biopsy 2012
2.2.3: Clinical presentation
The most common clinical presentation remained nephrotic syndrome (75%), followed by asympto-matic urine abnormality (13%), nephritic-nephrotic syndrome (4%) and nephritic syndrome (4%) (Table & Figure 2.2.3(a)). As expected, most patients have normal blood pressures (74%) and preserved eGFR (73%) at presentation (Table 2.2.3(b) & (c)).
Table 2.2.3(a): Clinical presentation for MCD, 2005-2012
Figure 2.2.3(a): Clinical presentation for MCD, 2005-2012
Table 2.2.3(b): Presence of hypertension in MCD, 2005-2012
Clinical Presentation 2005-2010 2011 2012
n % n % n % n %
Asymptomatic urine abnormality 82 11.9 28 16.0 21 13.7 131 12.9
Nephritic syndrome 24 3.5 10 5.7 2 1.3 36 3.5
Nephrotic syndrome 536 78.0 116 66.3 109 71.2 761 75.0
Nephritic-Nephrotic syndrome 28 4.1 5 2.9 6 3.9 39 3.8
Not available/Missing 17 2.5 16 9.1 15 9.8 48 4.7
Total 687 100.0 175 100.0 153 100 1015 100.0
Total
Hypertension 2005-2010 2011 2012 Total
n % n % n % n %
Present 117 17.0 29 16.6 31 20.3 177 17.4
Malaysian Registry of Renal Biopsy 2012
PRIMARY GLOMERULONEPHRITIS
GFR
(ml/min/1.73m2)
2005-2010 2011 Total
n % n % n % n
<15 14 2.0 2 1.1 2 1.3 18
15 to <30 27 3.9 8 4.6 6 3.9 41
30 to <60 98 14.3 13 7.4 20 13.1 131
60 to <90 139 20.2 34 19.4 27 17.6 200
>90 362 52.7 101 57.7 78 51.0 541
Missing 47 6.8 17 9.7 20 13.1 84
Total 687 100 175 100 153 100 1015
2012
Table 2.2.3(c): Renal function in MCD by year, 2005-2012
*84 cases are missing on GFR, including 29 cases with GFR>200 (GFR range between 201 to 3349)
Figure 2.2.3(c): Renal function in MCD by year, 2005-2012
2.2.3.1: Clinical presentation by age
PRIMARY GLOMERULONEPHRITIS
5th Report of the Malaysian Registry of Renal Biopsy 2012
Clinical Presenta-tions
15-<25 25-<35 35-<45 45-<55 55-<65 ≥≥≥≥65 Total
n % n % n % n % n % n % n %
Asymptomatic urine
abnormality 44 9.4 39 16.2 15 11.9 16 15.2 14 25.0 3 15.8 131 12.9 Nephritic syndrome 15 3.2 11 4.6 3 2.4 4 3.8 2 3.6 1 5.3 36 3.5
Not available 19 4.1 13 5.4 8 6.3 4 3.8 3 5.4 1 5.3 48 4.7
Total 468 100 241 100 126 100 105 100 56 100 19 100 1015 100
Nephrotic syndrome 365 78.0 172 71.4 97 77.0 78 74.3 36 64.3 13 68.4 761 75.0
Nephritic-Nephrotic
syndrome 25 5.3 6 2.5 3 2.4 3 2.9 1 1.8 1 5.3 39 3.8
Table 2.2.3.1 (a): Clinical presentation by age group for MCD, 2005-2012
Figure 2.2.3.1(a): Clinical presentation by age group for MCD, 2005-2012
Hypertension
15-<25 25-<35 35-<45 45-<55 55-<65 ≥≥≥≥65 Total
n % n % n % n % n % n % n %
Present 61 13.0 30 12.4 30 23.8 37 35.2 15 26.8 4 21.1 177 17.4
Absent 370 79.1 185 76.8 83 65.9 58 55.2 39 69.6 11 57.9 746 73.5
Not available/
Missing 37 7.9 26 10.8 13 10.3 10 9.5 2 3.6 4 21.1 92 9.1
Malaysian Registry of Renal Biopsy 2012
PRIMARY GLOMERULONEPHRITIS
Figure 2.2.3.1 (b): Hypertension by age group for MCD, 2005-2012
eGFR (ml/min/1.73m2)
15-<25 25-<35 35-<45 45-<55 55-<65 ≥≥≥≥65 Total
n % n % n % n % n % n % n %
<15 6 1.3 3 1.2 4 3.2 0 0.0 2 3.6 3 15.8 18 1.8 15-29 12 2.6 4 1.7 8 6.3 6 5.7 9 16.1 2 10.5 41 4.0
Missing* 44 9.4 21 8.7 10 7.9 5 4.8 3 5.4 1 5.3 84 8.3
Total 468 100 241 100 126 100 105 100 56 100 19 100 101
5 100
30-59 38 8.1 23 9.5 19 15.1 35 33.3 9 16.1 7 36.8 131 12.9
≥90 298 63.7 147 61.0 50 39.7 33 31.4 12 21.4 1 5.3 541 53.3 60-89 70 15.0 43 17.8 35 27.8 26 24.8 21 37.5 5 26.3 200 19.7
Table 2.2.3.1 (c): Renal function at presentation by age group for MCD, 2005-2012
Figure 2.2.3.1 (c): Renal function at presentation by age group for MCD, 2005-2012
PRIMARY GLOMERULONEPHRITIS
5th Report of the Malaysian Registry of Renal Biopsy 2012
2.2.3.2: Clinical presentation by gender
There was no difference between genders in terms of clinical presentation, presence of hypertension and renal function at presentation (Table 2.2.3.2 (a, b & c)). Both genders have relatively well preserved renal function with less than a quarter having eGFR <60 ml/min/1.72 m2 (Figure 2.2.3.2 (c)).
Table 2.2.3.2(a): Clinical presentation by gender for MCD, 2005-2012
Figure 2.2.3.2(a): Clinical presentation by gender for MCD, 2005-2012
Table 2.2.3.2(b): Hypertension by gender for MCD, 2005-2012
Clinical Presentation Male Female
n % n %
Asymptomatic urine abnormality 65 9.9 66 18.4
Nephritic syndrome 24 3.7 12 3.3
Nephrotic syndrome 502 76.5 259 72.1
Nephritic-Nephrotic syndrome 36 5.5 3 0.8
Not available 29 4.4 19 5.3
Total 656 100 359 100
Hypertension Male Female
n % n %
Present 112 17.1 65 18.1
Malaysian Registry of Renal Biopsy 2012
PRIMARY GLOMERULONEPHRITIS
Table 2.2.3.2(c): Renal function by gender for MCD, 2005-2012
*Total of 84 cases are missing on GFR, including 29 cases with GFR>200 (GFR range between 201 to 3349)
Figure 2.2.3.2(c): Renal function by gender for MCD, 2005-2012
2.2.4: Outcome of Minimal Change Disease
In general, the outcome for minimal change disease was excellent, with 5-year patient and renal survival of 94% and 98% respectively (Figure 2.2.5 (a) & (b)).
Table 2.2.4(a): Patients survival estimates for death in MCD, 2005 2012
Event = death; Status as at 31st Dec 2012 or last follow-up *Missing of 2 censored cases where the outcome date < date of 1st biopsy
PRIMARY GLOMERULONEPHRITIS
5th Report of the Malaysian Registry of Renal Biopsy 2012
Demographic n %
Table 2.2.4 (b): Renal survival estimates for death in MCD, 2005 2012
*Missing of 1 censored and 1 event cases where the outcome date < date of 1st biopsy
Event = ESRF; Status as at 31st Dec 2012 or died or last follow-up
2.3: Focal Segmental Glomerulosclerosis (FSGS)
2.3.1: Introduction
Focal segmental glomerulosclerosis is defined on histological criteria by segmental capillary obliteration with increased mesangial matrix deposition, intra-capillary hyaline deposits and focal adhesions of the capillary tuft to Bowman’s capsule. The diagnosis of FSGS can be challenging in term of differentiating the idiopathic FSGS from secondary FSGS changes
.
2.3.2: Patient Population and Characteristics
A total of 919 cases of FSGS were reported in our eight-year registry data. FSGS was mainly diagnosed in young patients, with mean age at the time of biopsy of 34.4 ± 14.6. Similar to minimal change disease, FSGS was slightly more common in males (59%) with no obvious preponderance in racial distribution (Table 2.3.2 (a)).
Table 2.3.2(a): Demographic characteristics for FSGS, 2005-2012
Figure 2.2.4 (b): Renal Survival estimates for death
Malaysian Registry of Renal Biopsy 2012
PRIMARY GLOMERULONEPHRITIS
Table 2.3.2(b): Age group at time of biopsy (years) for FSGS, 2005-2012
Figure 2.3.2(a): Demographic characteristics for FSGS, 2005-2012
Age group (years)
2005-2010 2011 2012 Total
n % n % n % n %
15-<25 215 34.3 44 32.6 41 26.1 300 32.6
25-<35 164 26.2 47 34.8 41 26.1 252 27.4
35-<45 118 18.8 16 11.9 30 19.1 164 17.8
45-<55 66 10.5 13 9.6 24 15.3 103 11.2
55-<65 38 6.1 12 8.9 13 8.3 63 6.9
≥65 26 4.1 3 2.2 8 5.1 37 4.0
Total 627 100 135 100 157 100 919 100
Figure 2.3.2(b): Age at time of biopsy (years) FSGS, 2005-201
2.3.3: Clinical presentation
Nephrotic syndrome was the most common clinical presentation (57%), followed by asymptomatic urine abnormality (25%), nephritic-nephrotic syndrome (6%) and nephritic syndrome (5%) (Table & Fig-ure 2.3.3(a)).
PRIMARY GLOMERULONEPHRITIS
5th Report of the Malaysian Registry of Renal Biopsy 2012
Hypertension 2005-2010 2011 2012 Total
n % n % n % n %
Present 190 30.3 54 40.0 65 41.4 309 33.6
Absent 386 61.6 61 45.2 66 42.0 513 55.8
Not available/Missing 51 8.1 20 14.8 26 16.6 97 10.6
Total 627 100 135 100 157 100 919 100
Clinical Presentations 2005-2010 2011 2012 Total
n % n % n % n %
Asymptomatic urine abnormality 150 23.9 28 20.7 48 30.6 226 24.6
Nephritic syndrome 33 5.3 6 4.4 4 2.5 43 4.7
Nephrotic syndrome 380 60.6 78 57.8 69 43.9 527 57.3
Nephrotic-Nephritic syndrome 34 5.4 9 6.7 9 5.7 52 5.7 Not available/Missing 30 4.8 14 10.4 27 17.2 71 7.7
Total 627 100 135 100 157 100 919 100
Table 2.3.3(a): Clinical presentation for FSGS, 2005-2012
Figure 2.3.3(a): Clinical presentation for FSGS, 2005-2012
Table 2.3.3(b): Presence of hypertension in FSGS, 2005-2012
Malaysian Registry of Renal Biopsy 2012
PRIMARY GLOMERULONEPHRITIS
GFR
(ml/min/1.73m2)
2005-2010 2011 2012 Total
n % n % n % n %
<15 33 5.3 4 3.0 10 6.4 47 5.1
15 to < 30 90 14.4 12 8.9 16 10.2 118 12.8
60 to < 90 130 20.7 35 25.9 23 14.6 188 20.5
> 90 187 29.8 43 31.9 40 25.5 270 29.4
Missing 39 6.2 15 11.1 22 14.0 76 8.3
Total 627 100 135 100 157 100 919 100
30 to < 60 148 23.6 26 19.3 46 29.3 220 23.9
Table 2.3.3 (c): Renal function in FSGS by year, 2005-2012
*76 cases are missing on GFR, including 14 cases with GFR>200 (GFR range between 205 to 1350)