• Tidak ada hasil yang ditemukan

Tesis dan Disertasi Tentang Pendekatan Pendidikan Matematika Realistik - TIPS BELAJAR MATEMATIKA

N/A
N/A
Protected

Academic year: 2017

Membagikan "Tesis dan Disertasi Tentang Pendekatan Pendidikan Matematika Realistik - TIPS BELAJAR MATEMATIKA"

Copied!
189
0
0

Teks penuh

(1)

PROPORTIONAL REASONING

A THESIS

Submitted in Partial Fulfilment of the Requirements for the Degree of Master of Science (M.Sc)

in

International Master Program on Mathematics Education (IMPoME) Faculty of Teacher Training and Education Sriwijaya University (In Collaboration between Sriwijaya University and Utrecht University)

By:

SYLVANA NOVILIA SUMARTO NIM. 20112812012

FACULTY OF TEACHER TRAINING AND EDUCATION

SRIWIJAYA UNIVERSITY

(2)

Research Title : Design Research on Mathematics Education: Ratio Table in Developing the Students’ Proportional Reasoning

Student Name : Sylvana Novilia Sumarto

Student Number : 20112812012

Study Program : Mathematics Education

Approved by:

Prof. Dr. Zulkardi, M.I.Komp., M.Sc. Dr. Darmawijoyo

Supervisor I Supervisor II

Dean of Faculty of Teacher Training Head of

and Education Mathematics Education Department

Sofendi, M.A., Ph.D. Prof. Dr. Zulkardi, M.I.Komp., M.Sc. NIP 19600907 198703 1 002 NIP 19610420 198603 1 002

(3)

A THESIS

Submitted in Partial Fulfillment of the Requirements for the Degree of Master of Science (M.Sc)

in

International Master Program on Mathematics Education (IMPoME) Faculty of Teacher Training and Education Sriwijaya University (In Collaboration between Sriwijaya University and Utrecht University)

By:

Sylvana Novilia Sumarto NIM 20112812012

Approved by Examination Committee Signature

Prof. Dr. Zulkardi, M.I.Komp., M.Sc.

Sriwijaya University

---Dr. Darmawijoyo

Sriwijaya University

---Dr. Maarten Dolk

Freudenthal Institute for Science and Mathematics Education, Utrecht University

---Dr. Yusuf Hartono, M.Sc.

Sriwijaya University

---Dr. Ratu Ilma Indra Putri, M.Si.

Sriwijaya University

---FACULTY OF TEACHER TRAINING AND EDUCATION SRIWIJAYA UNIVERSITY

(4)

Name : Sylvana Novilia Sumarto

Place of birth : Pasuruan

Date of birth : November 22, 1987

Academic Major : Mathematics Education

State that:

1. All the data, information, analyses, and the statements in analyses and

conclusions that presented in this thesis, except from reference sources are the

results of my observations, researches, analyses, and views with the guidance

of my supervisors.

2. The thesis that I had made is original of my mind and has never been presented

and proposed to get any other degree from Sriwijaya University or other

Universities.

This statement was truly made and if in other time that found any fouls in my

statement above, I am ready to get any academic sanctions such as, cancelation of

my degree that I have got through this thesis.

Palembang, June 2013

The one with the statement

Sylvana Novilia Sumarto

(5)

v

for the students. They may just memorize the procedure of cross multiplication without understand about the insight of proportionality itself. Thus, we need a learning design which is not only emphasizing the ability to solve the proportional problem but also can develop the students’ proportional reasoning. Within a learning trajectory, five activities were designed based on the principle of Pendidikan Matematika Realistik Indonesia (PMRI)- the Indonesian version of Realistic Mathematics Education (RME). In this study, design research was carried out to investigate how the ratio table can support the students to develop their proportional reasoning as well as to contribute to the development of the local instructional theory. Thirty five students Grade 4 from SDN 179 Palembang were involved in this study. The analysis of students’ works and the video of the learning process in the classroom show that wrapped in the real contextual problem, the ratio table may develop the students’ proportional reasoning as well as the strategy to solve proportional problem.

(6)

vi

Mengajarkan materi perbandingan dengan memberikan rumus-siap pakai membuat proses pembelajaran menjadi tidak bermakna bagi siswa. Siswa mungkin hanya akan menghapalkan prosedur perkalian silang tanpa memahami inti dari konsep perbandingan. Oleh karena itu, kita membutuhkan suatu desain pembelajaran yang tidak hanya menekankan pada kemampuan siswa dalam menyelesaikan masalah perbandingan tetapi juga dapat mengembangkan kemampuan bernalar siswa tentang konsep perbandingan (proportional reasoning). Terintegrasi dalam suatu lintasan belajar, lima aktivitas didesain berdasarkan prinsip dalam Pendidikan Matematika Realistik Indonesia (PMRI). Dalam penelitian ini, design research diterapkan untuk menginvestigasi bagaimana tabel perbandingan (ratio table) dapat mendukung perkembangan nalar siswa tentang perbandingan sekaligus untuk berkontribusi pada perkembangan teori instruksi lokal (local instructional theory). Sebanyak tiga puluh lima siswa kelas 4 dari SDN 179 Palembang terlibat dalam penelitian ini. Hasil analisis dari hasil kerja siswa dan video rekaman proses pembelajaran di kelas menunjukkan bahwa bersama dengan masalah kontekstual, ratio table dapat mengembangkan kemampuan bernalar siswa sekaligus mengembangkan strategi untuk menyelesaikan masalah perbandingan.

(7)

vii

Sylvana Novilia Sumarto. Design Research on Mathematics Education: Ratio Table in Developing the Students’ Proportional Reasoning.

In Indonesia, the proportion was taught since Grade 5 elementary school which was integrated in the lesson about fraction. However, the teacher taught by giving the ready-used formula. By using the algebra notation and the cross multiplication, the students may solve the proportional problem but it is not a guarantee that they understand about the concept of proportion itself. In line with this, van Galen &van Eerde (2013) stated that if the procedures were not understood well by the students then they will become vulnerable tricks, meanwhile the proportional reasoning is a “capstone” of elementary school mathematics (Kilpatrick, Swafford & Findell; Lamon; Lesh, Post & Behr as cited in Parish, 2010). Therefore, we need a learning design which supports the development of students’ proportional reasoning.

Within a design research, we developed a learning trajectory of proportion which may facilitate the students to develop of students’ proportional reasoning. We tested the Hypothetical learning trajectory (HLT) to the 35 students Grade 4 of SDN 179 Palembang, Indonesia in two cycles. There were six students involved in the first cycle. Here, the researcher had a role as the teacher. The result from the first cycle was used to adjust the initial HLT. Meanwhile, the other 29 students were participated on cycle 2. The students were taught by their own teacher based on the refined HLT.

Five activities were designed based on the principle of Pendidikan Matematika Realistik Indonesia (PMRI)- the Indonesian version of Realistic Mathematics Education. As the characteristics of PMRI, we started the lesson by proposing contextual problems which were familiar for the students and used the ratio table as the model here.

During the first cycle, we found that we need to change some sentence in the problems in order to make it more understandable for the students. We also change the order of some activities; the activity of exploring the ratio table would be given before the students worked on the simple missing value problem on the cycle 2. Thus, after be refined the order of the activities became as follow.

(8)

viii

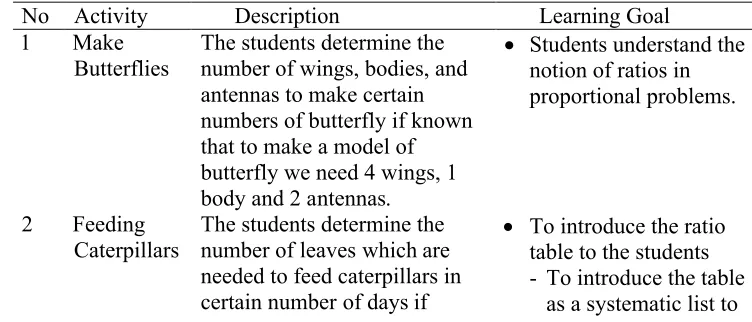
of leaves which are needed to feed caterpillars in 64 days if known that we need 5 leaves to feed the caterpillars in two days. The fourth activity was “What do you think?” In this activity, we proposed some different contextual problems in order to strengthen the students’ ability in using the techniques in solving simple proportional problem as well as to improve the students’ proportional reasoning. The last activity was Best Price. The problem which was posed in this activity was a comparison problem. Here, we want to build up the students’ idea about proportionality in comparison situation.

In line with the aforementioned background of this research, the present study aims to facilitate the development of students’ proportional reasoning as well as to contribute to the development of local instructional theory. Accordingly, we proposed a research question as: “How can the ratio table supports pupils to develop proportional reasoning?”

To address the main research question in this study, first we answered sub questions, based on the findings on cycle 2 of this study, as follow.

How do the students in Grade 4 use their intuitive understanding to solve proportional problem?”

On the pretest and the interview in the beginning of cycle 2, we see that some students were able to gain the idea of unit 1 method to solve the simple missing value problem while the others multiplied with the wrong number. The others came up with the idea of doubling and repeated addition to look for the fourth number in missing value problem. However, some students still need guidance to deal with this problem. By proposing a similar question with smaller numbers, the lower achievement students, who have no proficient multiplication, may be able to think about the repeated addition as the way to solve the original problem.

Instead of using the proportionality, some students used the absolute value to solve the comparison problem. They may not have idea about the relation between two factors which influence the comparison situation, such as the price and the weight. Basically, the context which used in problem and the questions which were posed during the interviews may influence the students’ reaction. When the context which used in the problems was experienced by the students, they may be able to give the right answer based on what happened in their daily life. Proposing the similar problems and change the number may lead the students to get the idea to solve the problem.

(9)

ix comparison problem?”

Through the data analysis on the activity 5, we can say that the students may use the table to look for the proportions which give a good comparison situation. They find that the table helps them to find the number of items that they got for the same price or to find the price for the same number of items and then compare the price. Of course, it can be happened after the students master the use of ratio table in simple proportional problem. It is in line with what stated in Tourniere & Pulos (1985), “Comparing strategy is an advanced method, and the ability to choose the arithmetically easier comparison is acquired long after the proportional techniques mastered.”

Based on the answer to the sub research question, we may formulate the answer for the main research question as follow.

(10)

x

Sylvana Novilia Sumarto. Design Research on Mathematics Education: Ratio Table in Developing the Students’ Proportional Reasoning.

Di Indonesia, materi tentang perbandingan diajarkan sejak kelas 5 SD, terintegrasi dengan bab tentang pecahan. Namun dalam mengajarkannya, Guru langsung memberikan rumus jadi, yaitu dengan menggunakan notasi aljabar dan perkalian silang. Melalui metode pembelajaran semacam ini, siswa mungkin dapat mengerjakan soal-soal perbandingan dengan menggunakan rumus yang telah diajarkan di sekolah, tetapi ini bukanlah jaminan bahwa siswa memahami benar tentang konsep perbandingan itu sendiri. Sejalan dengan ini, van Galen dan van Eerde (2013) menyatakan bahwa suatu prosedur atau cara yang tidak dipahami secara benar oleh siswa hanya akan menjadi suatu trik. Hal ini menyebabkan kemampuan bernalar siswa tentang perbandingan (proportional reasoning) menjadi tidak berkembang, padahal proportional reasoningmerupakan “capstone” (batu penjuru) dari matematika di sekolah dasar (Kilpatrick, Swafford & Findell; Lamon; Lesh, Post & Behr seperti dikutip dalam Parish, 2010). Oleh karena itu, kita membutuhkan suatu desain pembelajaran yang dapat mendukung perkembangan kemampuan bernalar siswa dalam masalah perbandingan.

Dengan menggunakan metode design research, kami mengembangkan sutau lintasan belajar yang dapat memfasilitasi siswa dalam mengembangkan penalaran tentang konsep perbandingan. Kami mencobakan suatu hipotesis lintasan belajar-Hypothetical learning trajectory (HLT) kepada 35 siswa kelas 4 SDN 179 Palembang, Indonesia dalam dua siklus. Enam orang siswa dilibatkan dalam siklus pertama. Disini, peneliti berperan sebagai guru pengajar. Hasil dari siklus yang pertama ini digunakan untuk merevisi HLT versi awal. Untuk 29 siswa lainnya berpartisipasi dalam siklus yang kedua. Pada siklus kedua ini, siswa diajar oleh guru mereka sendiri berdasarkan HLT yang telah direvisi.

Terdapat lima aktivitas dalam desain pembelajaran ini. Kelima aktivitas tersebut didesain berdasarkan prinsip-prinsip dalam Pendidikan Matematika Realistik Indonesia (PMRI). Sesuai karakteristik dalam PMRI, kita memulai pembelajaran dengan masalah kontekstual yang familiar bagi siswa dan menggunakan tabel perbandingan (ratio table) sebagai modelnya.

Selama mejalankan siklus pertama, kami menemukan bahwa kita perlu mengubah beberapa kalimat dalam soal agar lebih mudah dimengerti oleh para siswa. Kami juga mengganti urutan aktivitas pada siklus kedua; aktivitas mengeksplorasi tabel diberikan sebelum siswa mengerjakan masalah missing value (tipe soal yang mencari salah satu nilai yang belum diketahui). Setelah diperbaiki, maka urutan aktivitas dalam desain pembelajaran ini sebagai berikut.

(11)

xi

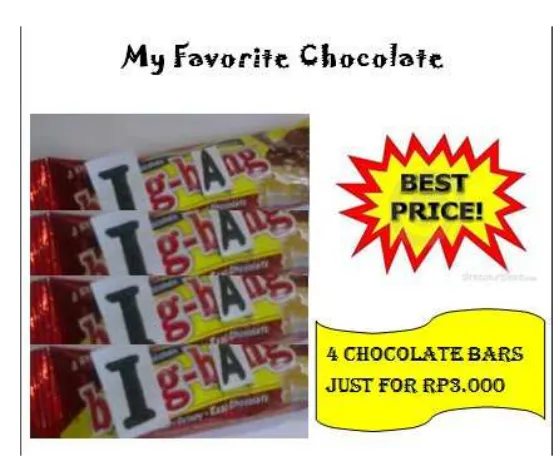
perbandingan. Aktivitas yang kedua adalah Cokelatku. Pada aktivitas ini, siswa mengeksplorasi tabel perbandingan dengan cara membuat daftar harga cokelat. Siswa menentukan sendiri banyak cokelatnya kemudian siswa menentukan harganya. Aktivitas ini bertujuan untuk membantu siswa mengembangkan beberapa strategi yang dapat dilakukan dengan mengggunakan tabel perbandingan dan memnugkinkan mereka untuk menemukan kembali aturan mencari nilai 1. Strategi-strategi ini nantinya dapat membantu mereka dalam menyelesaikan masalah perbandingan. Aktivitas yang ketiga adalah Memberi Makan Ulat. Pertanyaan dalam aktivitas ini merupakan missing value. Siswa diminta untuk menentukan banyak daun yang dibutuhkan untuk memberi makan ulat selama 64 hari jika diketahui kita membutuhkan 5 daun untuk memberi makan ulat selama 2 hari. Aktivitas keempat adalah “Bagaimana menurutmu?” Dalam aktivitas ini, siswa diberi beberapa masalah kontekstual yang berbeda dengan tujuan untuk memperkuat kemampuan siswa dalam menggunakan teknik-teknik untuk menyelesaikan masalah perbandingan sederhana sekaligus untuk mengembangkan kemampuan bernalar siswa. Aktivitas yang terakhir adalah Harga Terbaik. Masalah yang diberikan kepada siswa dalam aktivitas ini merupakan masalah comparison(tipe soal yang membandingkan dua atau lebih situasi perbandingan). Disini, kamu ingin membangun ide siswa tentang adanya konsep perbandingan dalam membandingkan sesuatu.

Berangkat dari latar belakang penelitian, maka tujuan dari penelitian ini adalah untuk memfasilitasi perkembangan kemampuan bernalar siswa dalam konsep perbandingan sekaligus berkontribusi dalam perkembangan teori instruksi lokal (local instructional theory). Sejalan dengan hal ini, maka rumusan masalah dalam penelitian ini adalah “Bagaimana tabel perbandingan dapat mendukung perkembangan kemampuan bernalar siswa dalam perbandingan?”

Untuk menjawab masalah utama dalam penelitian ini, pertama kami akan menjawab sub pertanyaan, berdasarkan temuan pada siklus kedua, sebagai berikut. “Bagaimana siswa kelas 4 menggunakan pemahaman intuisi mereka untuk menyelesaikan masalah perbandingan?”

(12)

xii

menggunakan nilai mutlak untuk menyelesaikan masalah comparison. Mungkin mereka tidak memiliki pemahaman tentang relasi antara dua factor yang memepengaruhi situasi perbandingan, misalnya harga dan berat. Pada dasarnya, konteks yang digunakan dalam soal dan pertanyaan yang diajukan selama wawancara mempengaruhi respon siswa. Ketika konteks yang digunakan pernah dialami sendiri oleh siswa, mereka dapat memberikan jawaban yang benar berdasarkan apa yang terjadi dalam kehidupan mereka sehari-hari. Dengan mengajukan soal yang serupa dan mengganti bilangan yang digunakan dalam soal mampu membawa siswa untuk mendapatkan ide pemecahan masalah.

“Bagaimana tabel perbandingan dapat mendukung perkembangan nalar perbandingan siswa dalam masalah missing value?”

Berdasarkan analisis data dari akivitas 1 hingga aktivitas 4, kita dapat menyimpulkan bahwa dengan menggunakan tabel perbandingan siswa dapat mengorganisasi informasi dari soal yang diberikan karena tabel menggolongkan masing-masing benda dalam cara yang sistematis. Terkadang siswa tidak memperhatikan sebenarnya bilangan yang ada di dalam soal itu merepresentasikan apa; siswa hanya mengalikan atau membagi bilangan-bilangan tersebut tanpa pertimbangan apapun. Hal ini dapat dicegah dengan menggunakan tabel perbandingan. Tabel perbandingan juga memungkinkan siswa untuk menuliskan proses penghitungan langkah demi langkah. Pertama, ini bermanfaat untuk memfasilitasi siswa yang tidak terlalu bisa berhitung dengan baik. Kedua, dengan menuliskan proses penghitungan langkah demi langkah membuat para siswa dapat melihat relasi diantara bilangan-bilangan yang ada. Disini, siswa dapat mengkonstruk penalaran perbandingan mereka.

Bagaimana tabel perbandingan dapat mendukung perkembangan nalar perbandingan siswa dalam masalah comparison?

(13)

xiii

mengembangkan penalaran perbandingan sekaligus strategi pemecahan masalah perbandingan; baik dalam masalah missing value maupun comparison. Dengan menggunakan tabel perbandingan, siswa dimungkinkan untuk mengorganisasi informasi dari pertanyaan yang diberikan. Tabel membantu mereka dalam mengidentifikasi apa yang direpresentasikan oleh bilangan-bilangan tersebut. Langkah per langkah yang ditunjukkan oleh tabel perbandingan memungkinkan siswa untuk melihat relasi diantara bilangan-bilangan yang ada. Dari sini mereka dapat mengembangkan hubungan proporsional diantara bilangan-bilangan tersebut. Pada saat mereka menyadari hubungan ini, mereka dapat menggunakannya untuk bernalar secara proporsional. Lebih lanjut, ketika siswa telah menguasai teknik pemecahan masalah perbandingan yang sederhana, mereka dapat menggunakan tabel perbandingan sebagai alat untuk menghitung sekaligus bernalar dalam situasi proporsional. Tabel perbandingan memunculkan perbandingan yang menunjukkan situasi proporsional.

(14)

xiv

By the gracious of God, I could finish writing this thesis; thank you Lord, for all your blessings to me.

This thesis was written to fulfill the requirements for the degree of Master of Science (M.Sc) in International Master Program on Mathematics Education (IMPoME), Sriwijaya University, Palembang- Indonesia in collaboration with Utrecht University, Utrecht- the Netherlands. I hope the results from this thesis may contribute to the development of the mathematics education, especially the implementation of Pendidikan Matematika Realistik Indonesia (PMRI) in Indonesia.

First, in this opportunity I would like to express my deepest gratitude to my wonderful supervisors, Frans van Galen, Prof. Zulkardi and Dr. Darmowijoyo, for their never ending support, helpful advice, sincere help, serious guidance, great motivation and encouragement during writing this thesis. The idea of this research was developed through my discussion with Marteen Dolk and Dolly van Eerde. Thank you very much to both of you. Special thanks also for Mieke Abels, Marteen Kindt, Paul Drijvers, Dirk Jan, Arthur Bakker, Steven Wepster, Barbara van Amerom, Elwin Savelsbergh, Henk van der Kooij, Betty Heijman, Mark Uwland, and all staffs in Freudhental Institute, Utrecht Univesity for all your help and guidance during my study in Utrecht. In memoriam, Jaap den Hertog. Thank you for assisting me during the preparation to go to the Netherlands.

I would never become myself now if Prof. Robert Sembiring, Marteen Dolk and the PMRI Team did not launch the IMPoME program in 2009. Thus, I would like to say thank you for giving me the opportunity to feel the great experience within this program. And I would never go to Utrecht University without support from Dikti Depdikbud Indonesia. Thanks to Mbak Martha and all Dikti staffs for arranging scholarship for us.

I would like to say thank you for Dr. Ratu Ilma, Dr. Yusuf Hartono, Dr. Somakim and all lecturers, Mbak Tessi, Kak Abe and staffs in Mathematics Education Department of Unsri Postgraduate Program who gave a lot of supports during my study in Palembang. The great gratitude also for Dr. Ipung Yuwono, Dr. Toto Nusantara, Dr. Tjang Daniel Chandra, my lecturers in Universitas Negeri Malang who introduced me to PMRI and who gave me recommendations to the PMRI Team as one of the candidates of the IMPoME 2011 scholarship awardees.

I also would like to extend my appreciation to Bu Intan and Bu Lisa, the homeroom teacher of class 4D and 4A in SDN 179 Palembang; Bu Maulina, the headmaster of SDN 179 Palembang and all the teachers and staff in SDN 179. Thank you for the good coordination for the time being.

(15)

xv

support, motivation and prayer. Thus, I dedicated this thesis for you. Love you always.

Palembang, June 2013

(16)

xvi

2.4 Pendidikan Matematika Realistik Indonesia(PMRI) ··· 10

2.5 Ratio Table ··· 13

2.6 Socio Norms and socio- mathematical norms··· 15

2.7 Proportion in Indonesian Curriculum ··· 16

CHAPTER III: METHODOLOGY ··· 19

3.1 Participants ··· 19

3.2 Research Approach··· 19

3.3 Data Collection ··· 21

3.3.1 Preparation phase ··· 21

3.3.2 Preliminary teaching experiment (the first cycle) ··· 23

3.3.3 Teaching experiment (the second cycle)··· 23

3.3.4 Posttest··· 24

3.3.5 Validity and reliability ··· 25

3.4 Data Analysis ··· 25

3.4.1 Pretest··· 26

3.4.2 Preliminary teaching experiment (the first cycle) ··· 26

(17)

xvii

CHAPTER IV: HYPOTHETICAL LEARNING TRAJECTORY ··· 29

4.1 Activity 1: Make Butterflies ··· 30

4.2 Activity 2: Feeding Caterpillars ··· 34

4.3 Activity 3: My Chocolate ··· 37

4.4 Activity 4: What do you think?··· 40

4.5 Activity 5: Which is the cheaper one?··· 42

CHAPTER V: TESTING HYPOTETICAL LERNING TRAJECTORY ··· 46

5.1 Design Experiment ··· 46

5.1.1 Preliminary Teaching Experiment (First Cycle)··· 46

5.1.2 Teaching Experiment (Second Cycle) ··· 48

5.2 Retrospective Analysis ··· 49

5.2.1 Preliminary Teaching Experiment (First Cycle)··· 49

5.2.2 Classroom Observation and Teacher Interview ··· 67

5.2.3 The Refined Hypothetical Learning Trajectory (HLT)··· 68

5.2.4 Teaching Experiment (Second Cycle) ··· 70

CHAPTER VI: CONCLUSION AND SUGGESTION ··· 111

6.1 Conclusion··· 111

6.2 Reflection··· 115

6.3 Suggestion ··· 116

REFERENCES ··· 119

(18)

xviii

Table 2.1 The Strategies on the Ratio Table ··· 14

Table 2.2 The Curriculum Grade 5 on Second Semester ··· 16

Table 2.3 The Curriculum Grade 4 on Second Semester ··· 18

(19)

xix

Figure 5.1 Problem 1 on Pretest Cycle 1 ··· 51

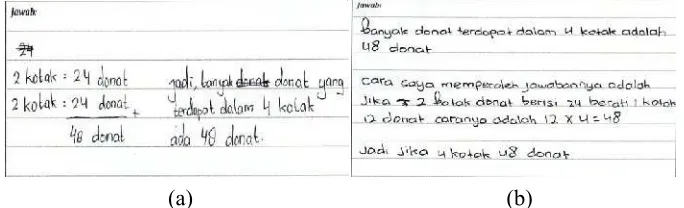
Figure 5.2 Lani’s Written Work (left) and Nurul’s Written Work (right) ··· 51

Figure 5.3 Ferdy’s Answer ··· 52

Figure 5.4 Ando’s Answer··· 53

Figure 5.5 Lani’s Anwer ··· 53

Figure 5.6 Problem 1 on Pretest Cycle 2 ··· 71

Figure 5.7 Lailatul’s Answer (left) and Livina’s Answer (right)··· 72

Figure 5.8 Imanah’s Answer ··· 73

Figure 5.9 Lulut’s Answer (left) and Aqila’s Answer (right) ··· 74

Figure 5.10 Lulut’s Answer on Problem 3 ··· 75

Figure 5.11 Ghafar’s Answer on Problem 3 ··· 77

Figure 5.12 Students’ Work ··· 82

Figure 5.13 Problem 4 from the Second Worksheet on Activity 1 ··· 85

Figure 5.14 The Answer from the Group of Salwa and Adilla··· 87

Figure 5.15 The Answer from the Group of Livia and Hudhi··· 92

Figure 5.16 The Answer from the Group of Ghafar and Nasywa··· 93

Figure 5.17 Ghafar’s and Nasywa’s Ratio Table··· 94

Figure 5.18 The Answer from the Group of Lailatul and Mulia ··· 96

Figure 5.19 The Answer from the Group of Faiq, Lulut and Altih ··· 97

Figure 5.20 The Answer from the Group of Ghafar and Nasywa (2) ··· 98

Figure 5.21 The Answer from the Group of Livia and Hudhi (2) ··· 99

Figure 5.22 The Answer from the Group of Livia and Hudhi (3) ··· 102

(20)

xx

APPENDIX 1: THE CLASSROOM OBSERVATION SCHEME··· 122

APPENDIX 2: THE TEACHER INTERVIEW SCHEME··· 123

APPENDIX 3: PRETEST AND POSTTEST ··· 125

APPENDIX 4: TEACHER GUIDE ··· 132

APPENDIX 5: RENCANA PELAKSANAAN PEMBELAJARAN··· 143

APPENDIX 6: POWER POINT SLIDE ··· 155

(21)

1

CHAPTER I INTRODUCTION 1.1 Background

Proportion can be found everywhere. For instance, we use the concept of

proportion in rate problems. If we need 6 litres to drive 15 km then we need 12

litres to drive 30 km. We also use the concept of proportion in a shopping context

to compare prices. If there are two kinds of peanut butter, one costing 2 euro for a

150 ml bottle and the other costing 3 euro for a 250 ml bottle, we can use the

concept of proportion to determine that the second bottle is cheaper. In addition,

we also find the concept of proportion in scale. Most mathematicians defined a

proportion as the equality of two ratios, for example = (Tourniaire & Pulos, 1985; Langrall & Swafford, 2000) but in a certain sense, a proportion can be

defined as a more general concept, which is specifically reflected in fractions,

percentages and decimals (Galen et al, 2008). In this sense, we can expand the list

of the use of proportion in our everyday life. However, in this study we will use

the sense of proportion as in the first definition. Regarding the usefulness of the

concept of proportion in our daily life, we may say that proportion is one of

important concepts in mathematics. Therefore, it is necessary to learn about this

topic.

In Indonesia, the students learn about proportion on the 5th until 8th grade (Depdiknas, 2006). During 5thgrade they will learn about direct proportion and in the higher level they will learn about indirect proportion as well. According to

Zulkardi (2002), most of textbook that used in Indonesia contain mainly the set of

(22)

needed by the students in order to make the concept be real for them. The lesson

of proportion in grade 5 started by giving the fixed procedures to solve the

problems (e.g. Soenaryo, 2007; Sumanto et al, 2008). In line with that, the

teachers teach the cross multiplication to solve the problem. Although the students

are able to solve the proportional problem by applying this method, they may just

memorize the procedure and not develop their proportional reasoning. In addition,

van Galen & van Eerde (2013) also stated that if the procedures were not

understood well by the students then they will become vulnerable tricks.

“Proportional reasoning is defined as a term that denotes reasoning in a

system of two variables between which there exists a linear functional

relationship...” (Karplus et al, 1983, p.219). The proportional reasoning is a

“capstone” of elementary school mathematics (Kilpatrick, Swafford & Findell;

Lamon; Lesh, Post & Behr as cited In Parish, 2010). Many studies have been

conducted to observe the development of children’ proportional reasoning (e.g.

Karplus et al, 1983; Tourniaire & Pulos, 1985; Tourniaire, 1986; Langrall &

Swafford, 2000; Silvestre & da Ponte, 2012). These studies observe the students’

informal knowledge about proportion, what kind of strategies they used to solve

proportional problems and what factors from the problems that influence their

performance. Based on the studies, there are three difficulty factors of a

proportional problem which influence students’ performance: presence of an

integer ratio, numerical complexity, and the order of the number that the students

have been looking for. The problems with small, integer ratios and questions

about what is the biggest number to be found are easier for the students (Rupley,

(23)

theory about the students’ proportional thinking and reasoning. However, these

theories are not applicable in the practical situation. The teachers in the school

may not have any idea about the real application in the teaching practice in their

classroom. Therefore, it still need more research to improve the theory

development at the level of the instructional activities, the course (local

instruction theories) and at the level of the domain-specific instruction theory.

With regard to this, in this study we proposed a learning trajectory and the

instructional learning activities which can be used and implemented by the

teachers.

As mentioned above, the students in Indonesia learn about proportion formally

in Grade 5. However, the sense of proportion has been learned since the earlier

grade although it is not listed clearly in the curriculum. It is developed gradually

since that. For instance, the children in kindergarten knew that the giant’s chair is

bigger than the normal human’s chair or the students in the second grade knew

that the number of steps from a man is smaller than the number of steps a 5 years

old-girl for the same distance. The students in 4thgrade learned about pattern and relationship which are also related with the proportional thinking. It means that

they have some prior knowledge about the concept of proportion in some extent.

Accordingly, we initiate to try out our design for students Grade 4 with the

consideration that through this design they may able to prepare themselves before

they learn proportion more formally in Grade 5. Moreover, it may help them to

lay the groundwork for future work in the higher level.

Regarding the purpose of this study which is to facilitate the students in

(24)

principle of Pendidikan Matematika Realistik Indonesia (PMRI) - which is

adapted from the Realistic Mathematics Education (RME). In line with the

statement by Langrall & Swafford (2000, p. 260), “Instruction with proportional

reasoning should begin with situations that can be visualized or modelled”, the

activities in this study also were initialized by the contextual problems which can

be visualized by the students. The problems used their daily activities as the

context, so they may be able to imagine the real situation as described on the

questions. In this design, we also proposed a ratio table as the model that may

facilitate them to develop their proportional reasoning.

The ratio table was choosen as the model in this design because it shows the

proportions clearly. We can expand the number of columns to suit our needs. It is

an ideal aid for making handy calculations, gaining insight, and students reason

with proportion because the table invites the students to write down intermediate

steps. For instance, to find how many km which can be reached in 80 minutes if

we can go for 15 km in 60 minutes, the students may use 5 in 20 as intermediate

step or 30 in 120 then 10 in 40 to get 20 km in 80 minutes. The strength of a ratio

table is that the students can reason with a number relationship which they already

know (van Galen et al, 2008). Accordingly, in this study a learning sequence was

designed with focus on the developing of students’ proportional reasoning by

(25)

1.2 Research Aims

According to the background of this study, the purposes of this study were:

1. To develop the learning design which was not only emphasized the students’

ability in solving the proportional problem but also may develop the students’

proportional reasoning.

2. To contribute to the development of local instructional theory in proportion.

1.3 Research Questions

Regarding to the aforementioned background of this study, we proposed the main

research question for this study as follow.

How can the ratio table support pupils to develop proportional reasoning?

To address the main research question, we proposed three sub research

questions as:

1. How do the students in Grade 4 use their intuitive understanding to solve

proportional problem?

Before we investigated how the ratio table may help the students to develop

their proportional reasoning, we should know how they may solve the

proportional problem by using their intuitive understanding and what the students’

earlier idea about proportion. This information also may help us to improve the

designed learning trajectory.

2. How can the ratio table supports pupils to develop proportional reasoning

in missing value problem?

3.How can the ratio table supports pupils to develop proportional reasoning

(26)

As stated by Karplus et al (1983), Tournaire & Pulos (1985) and Silvestre & da

Ponte (2012), in general the proportional problems were categorized as missing

value problem and comparison problem. Thus, the second and the third sub

research questions were addressed in order to investigate how the ratio table may

facilitate the students to develop their proportional reasoning in both types of

(27)

CHAPTER II

THEORETICAL BACKGROUND 2. 1 Proportion

Proportion is an important concept in mathematics. We encounter this concept

everywhere, for example in enlarging and reducing photos, price comparisons, the

recipes, comparing probabilities, graphs and diagrams (van Galen et al, 2008).

However, Tourniaire and Pulos (1985) stated that this concept is difficult. The

concept is acquired late and many adults do not master the concept. In formal

mathematics, a proportion is defined as the equality of two ratios, for example =

(Tourniaire & Pulos, 1985; Langrall & Swafford, 2000).

In general proportional problems are categorized in two types, namely missing

value problem and comparison problem (Karplus et al, 1983; Tournaire & Pulos,

1985; Silvestre & da Ponte, 2012). Missing value problems present three numbers

and ask for the fourth one, such as how many candies that we get for 3 euro if we

know that 6 candies costing 2 euro. Meanwhile, the comparison problems present

two or more pairs of numbers and ask about their comparison. For instance, if

there are two kinds of peanut butter, one costing 2 euro for a 150 ml bottle and the

other costing 3 euro for a 250 ml bottle, we can determine the second butter as the

cheaper one by comparing the price for 1 euro for each of them. Basically, the

comparison problem is more difficult than the missing value problem. It requires

the students to be able to solve the simple proportional problem before they can

work on the comparison situation. As stated in Tourniere & Pulos (1985),

“Comparing strategy is an advanced method, and the ability to choose the

arithmetically easier comparison is acquired long after the proportional techniques

(28)

mastered.” In line with that, the activities which proposed the missing value

problems were presented before the activities about the comparison were given.

According to a literature review by Tournaire & Pulos (1985), the factors from

the problems that may influence students’ performance are

1. Structural variables of the proportional problem

 The number structure of the proportion problems influences the subjects’

performance. There are three main difficulty factors: presence of an

integer ratio, numerical complexity, and order of number that have been

looking for. The presence of integer ratios makes a problem easier. The

difficulty introduced by non-integer ratios is widely recognized. The

problems with small, integer ratios and ask the biggest number to be found

are easier for the students

 The presence of a unit

 The presence of unequal ratios, for comparison problem

2. Context variables of the proportional problem

 The familiarity of the context. The familiar problem is easier than

unfamiliar ones.

 The mixture problems is more difficult than non-mixture problems  People can more easily visualize discrete content than continuous content.  The mode of delivery of the problem.

2. 2 Proportional Reasoning

Karplus et al (1983) defined the proportional reasoning as a term that denotes

reasoning in a system of two variables between which there exists a linear

(29)

foundation for high school mathematics and algebraic reasoning (Langrall &

Swafford, 2000). Furthermore, as cited in Parish (2010), Kilpatrick, Swafford &

Findell; Lamon; Lesh, Post & Behr consider the proportional reasoning as a

“capstone” of elementary school mathematics. It is needed to learn the important

topics in mathematics such as fraction equivalence, place value, long division,

percentage calculation, measurement conversions, and derivation of rates which

are troublesome for the students.

According to Boyer & Levine (2012), considering the value and the

effectiveness of intuitive capacities, the development of mathematical

understanding is characterized not as ‘‘all or none’’ but it is mowing from partial

to more complete and become less contextually dependent. The intuitive

understandings influence the people’s mathematical skills even after they emerge

the formal mathematics. In line with that, giving the instruction that builds on the

students’ intuitive understanding of proportional relations may support the

development of their proportional thinking.

2. 3 Knowledge Gap

Many studies have been conducted to observe the development of children’s’

proportional reasoning (e.g. Karplus et al, 1983; Tourniaire & Pulos, 1985;

Tourniaire, 1986; Langrall & Swafford, 2000). These studies observe the

students’ informal knowledge about proportion, what kind of strategies they used

to solve proportional problems and what factors that influence their performance.

These studies give contribution to the developmental of theory about the students’

proportional thinking and reasoning. However, those studies are more in

(30)

more research to develop learning sequences which can be implemented directly

by the teacher at school and also can be used to improve the theory development

at the level of the instructional activities, the course (local instruction theories)

and at the level of the domain-specific instruction theory as well. Therefore,

within a design research, a learning trajectory and the instructional design were

developed in this study. The designed activities were implemented and analysed

based on the hypotethical learning trajectory.

2. 4Pendidikan Matematika Realistik Indonesia (PMRI)

In the past, teachers always taught their students in traditional way, gave

explanation about the concepts and procedures to solve the given problem.

Because of that, most students in mathematics classroom did not see mathematics

as creative instead as something to be explained by their teacher, then practiced

and applied. It made mathematics as a dead language (Fosnot & Dolk, 2001). In

order to make the learning process become more meaningful for the students, we

should not give them the ready-made product; they should reinvent the idea of

mathematical concept by themselves (Gravemeijer &Terwel, 2000; Grevemeijer,

1994). Mathematics should be understood as a human activity (Freudenthal,

1973), which is creative and alive. Accordingly, about 1970s the Realistic

Mathematics Education (RME) was developed in the Netherlands.

RME then was adapted as Pendidikan Matematika Realistik Indonesia(PMRI)

in Indonesia. The PMRI was implemented in Indonesia since 2001(Zulkardi,

2002). These both approaches are the same in principle but may be different in the

context which was chosen for the problem. The context in PMRI was adapted so

(31)

There are five characteristics of RME that should be considered as a guideline

to make a learning sequence (Gravemeijer, 1994). The following explanation will

describe about how the characteristics of RME fits the design in this study.

1. The use of contexts

The starting point of mathematics instruction should be real to the student.

This process will allow them to investigate the situation. Through the process of

finding and identifying the relevant mathematical elements, schematizing and

visualizing, they can discover the patterns and develop a model in a mathematical

concept. Then by reflecting and generalizing, the students will develop a more

complete concept. While they apply mathematical concepts to other aspects on

their daily life, they reinforce and strengthen the concept (Zulkardi, 2002). With

regards to this, the activities in this study used the contextual problem as the

starting point of the lesson, such as the money context. The students are familiar

with the money context. They find it in their daily life. They buy things with

money.They also familiar with situation which requires them to compare the price

to have the best buying. This context allows them to use their experience to gain

the “elementary” strategies to solve the given problems.

2. The use of models

Models are important for the students to bridge them from informal into

formal mathematic. In this study, the ratio table will be the model to develop the

students’ proportional reasoning. At the first, the students just will see the ratio

table as a usual table which is used to make a systematic list of certain items. Then

they will realize that the ratio table can be used to do the calculation in

(32)

to use the ratio table as a tool to thinking and reasoning in more formal level. The

intermediate steps which are showed by the ratio table let the students to see the

proportional relation among the numbers. Together with the context, the ratio

table may develop the students’ proportional reasoning.

3. The pupils' creations and contributions

In this study, the teacher will give the students time to think and explore the

rules on ratio table by their selves. Their finding of the rules will help them to

reach the formal algorithm for the higher grade. The role of the teacher is very

important here. The teacher should encourage the students to involve in the

discussion. Related with this, the teacher also should consider the social norm in

the class.

4. The interactivity

The interaction between pupils and between pupils and teachers is an essential

part in RME instructional processes. Explicit negotiation, intervention, discussion,

cooperation and evaluation are essential elements in a constructive learning

process. In this interactive instruction, pupils are engaged in explaining,

justifying, agreeing and disagreeing, questioning alternatives and reflecting

(Zulkardi, 2002). Regarding to this, on each lesson, the teacher will conduct the

discussion in the classroom. The teacher should give chance to the students in

developing their understanding as a taken-as-shared- pedagogy (Yackel & Cobb,

1996). Oce again, the teacher has the big role here. The teacher should create the

(33)

5. The intertwining

The integration of mathematical strands or units is essential. The intertwining

of learning strands is exploited in solving real life problems (Zulkardi, 2002).This

characteristic is implied in this study. The topic of proportion is also related with

the notion of other mathematical operation, such as linear function, fraction, and

numbers operation.

2. 5 Ratio Table

Ratio table is an appropriate model to facilitate students in learning about

proportion. It is an ideal aid for making handy calculations, gaining insight, and

students reason with proportions because the table invites the students to write

down intermediate steps. For instance, to find how many km which can be

reached in 80 minutes if we can go for 15 km in 60 minutes, the students may use

5 in 20 as intermediate step or 30 in 120 then 10 in 40 to get 20 km in 80 minutes.

The ratio table shows the proportion clearly because we can expand the number of

columns to suit our needs. The strength of ratio table is that the students can

reason with number relationship which they already know.

It is important for the teacher to discuss what can be done in ratio table.

Context makes the students realize about what kind of operation that you can do,

such as price and weight, you can multiply with same number but cannot add with

the same number. It is important to state units are used and arrows to help the

students see the operation. But it doesn’t mean to introduce the ratio table from

above without any discussion- the students may reinvent by themselves. Reinvent

here is not about the notation but the choice of systematic notation method and

(34)

transition is from systematic list (the items under each category) to a ratio table.

“The advantage of ratio table is that all numbers have their own place and that the

unit of measurement must stay the same.” (van Galen et al, 2008)

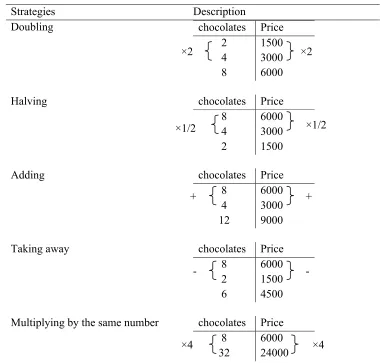
Some rules in calculating with a ratio table that should be reinvented by the

student were doubling, halving, adding, taking away, multiplying by the same

number, dividing by the same number. Doubling, adding and multiplying by the

same number were used to find the bigger number as the answer while halving,

taking away and dividing by the same number were used to find the smaller

number as the answer.

Table 2.1 The Strategies on the Ratio Table

Strategies Description

Multiplying by the same number chocolates Price

(35)

Dividing by the same number chocolates Price

24 18000

4 3000

Beside these the strategies, the students may be able to use repeated addition

and the unit strategy as the way to solve proportional problem. The unit strategy

involved the division and multiplication. The students should find the unit which

was used as the multiplication factor to find the answer, such as the price per kg to

find the price of 15 kg of rice, the number of books per box to find the total

number of books in 5 boxes, and the distance that can be driven for 1 liter of fuel

to find the distance that can be driven for 6 liters of fuel.

2. 6 Social norms and socio-mathematical norms

“Social norms refer to expected ways of acting and explaining that become

instantiated through a process of mutual negotiation between the teacher and

students” (Gravemeijer& Cobb, 2006). In specific way, Yackel & Cobb (1996)

defined the socio-mathematical norms as classroom norms which emphasize the

mathematical aspects of student’s activity, such as the understanding of what

counts as a mathematical difference, a mathematical sophistication, an acceptable

mathematical explanation and justification in classroom.Both of them have an

important role to reach the learning goal of this research. By considering these

factors, the teacher may establish the environmental in the classroom which is

conducive to improve students’ mathematical conceptual development (Yackel &

Cobb, 1996). For instance, by discussing what can be count as different solution

or give the students time to think about the other possible strategy may lead the : 6

(36)

students to reinvent the rules on the ratio table, such as halving or doubling

besides using the repeated addition.

In line with that, the aims of this study are not only to give a contribution to

the development of the theoretical instruction, but also to improve the quality of

the learning situation in the class. Through the teacher guide which developed in

this study, we may guide the teacher to more concern in the learning process in

the class. The teacher should realize that the social norms are important to make

the class be conducive. The social norms is formed through a long process, it

cannot be changed instantly. Thus, the teacher should be consistent in enforcing

the “rules” in the class.

2. 7 Proportion in Indonesian Curriculum

Based on the Indonesian curriculum, the students learn about proportion on the 5th until 8th grade. During 5th grade they will learn about direct proportion and indirect proportion in the higher level. The following table shows how the

proportions are taught as a part of fraction during the second semester in grade 5.

Table 2.2The Curriculum Grade 5 on Second Semester (Depdiknas, 2006)

Standard Competence Basic Competence Numbers

5. Using the fractions to solve problems

5.1 Converting the fractions into the decimals and vice versa.

5.2 Adding and subtracting fractions and decimals.

5.3 Multiplying and dividing fractions and decimals.

(37)

According to Zulkardi (2002), most of textbook that used in Indonesia contain

mainly the set of rules and algorithm which is already formal and they lack of

application which is needed by the students in order to make the concept be real

for them. In line with that, the lesson of proportion in grade 5 started by giving the

fixed procedures to solve the problems (e.g. Soenarjo, 2007; Sumanto et al,

2008), less attention is given to students’ understanding of the concept itself. As

cited by Silvestre and Ponte (2012), Stanley, McGowan, and Hull stated that the

usual teaching method in which teacher asked the students to solve proportion by

using representations, equalities between ratios, and linear function should be

replaced by other methods in which pupils engage in activities that help them to

discover that proportion is the variation of two quantities related to each other.

Thus, we need to propose a learning sequence that starts from the informal level

and rich of contexts that may lead them to develop the proportional thinking.

Although proportional reasoning is not stated explicitly in the curriculum for

the students under fifth grade, the sense of proportion itself has been learned since

that. For instance, the children in kindergarten knew that the giant’s chair is bigger

than the normal human’s chair or the students in the second grade knew that the

number of steps from a man is smaller than the number of steps a 5 years old girl

for the same distance. The students in 4th grade learned about pattern and relationship which are also related with the proportional thinking. It means that

they have some prior knowledge about the concept of proportion. Thus, the

(38)

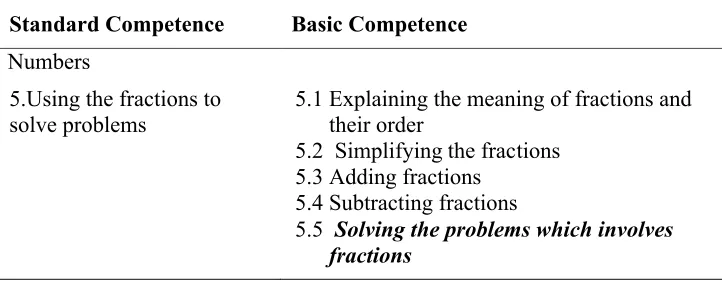
Considering the mathematics curriculum, we can see that the topic of fraction

also given in grade 4 (see Table 2.2). Although the problems in basic competence

of “solving the problems which involves fraction” usually only involved the

operations in the fraction, we can expand it to the simple proportional problem. It

means that we can teach the topic of proportion integrated with the fraction as in

grade 5. Accordingly, teaching proportion in grade 4 is reasonable and reliable.

Table 2.3The Curriculum Grade 4 on Second Semester(Depdiknas, 2006)

Standard Competence Basic Competence Numbers

5.Using the fractions to solve problems

5.1 Explaining the meaning of fractions and their order

5.2 Simplifying the fractions 5.3 Adding fractions

5.4 Subtracting fractions

(39)

CHAPTER III METHODOLOGY 3.1 Participants

The present study was a part of nternational Master Program on Mathematics

Education (IMPoME) project in Indonesia. This program is a collabartion between

Sriwijaya University, Surabaya State University and Utrecht University which

aims to develop the implementation of PMRI in Indonesia. In line with the goals

of the IMPoME program, the present study was conducted in SDN 179

Palembang, Indonesia, which is one of the partner schools of PMRI in Palembang,

Indonesia.

There were thirty five students grade 4 participated in this study. Six students

from class 4 A were involved in the first cycle on this study while the remains, 29

students from class 4D, participated in the second cycle. The six students from

class 4A were chosen based on their achievement in mathematics, namely low,

middle and high. The information about the level of students’ ability was gathered

through the informal interview with their homeroom teacher, Bu Lisa.

3.2 Research Approach

The general aim of this study is to facilitate the pupils in developing their

proportional reasoning. Within a design research, a learning trajectory was

developed and tested. The result of this study also contributes to the development

of local instruction theory. Design research is chosen in this study because it is an

approach which can bridge between the practical side and the theoretical side

(Bakker & van Eerde, 2012). Furthermore, according to Bakker (2004),

(40)

“Design research is evaluated against the metrics of innovation and

usefulness, and its strength comes from its explanatory power and grounding

in experience. Moreover, it often leads to products that are useful in

educational practice because they have been developed in practice.”

Gravemeijer and Cobb (2006) defined three phases in a design research

experiment. The description of each phase and how the different roles of a

Hypothetical Learning Trajectory (HLT) in each phase are given as follows.

1. Preparing for the experiment

From the design point of view, the purpose of this phase is to formulate a local

instruction theory which can be elaborated during conducting the intended design

experiment. Meanwhile from the research point of view, the aim of this phase is to

clarify the theoretical intent. Regarding this, we started the preliminary phase by

developing the sequence of instructional activities. There were 5 activities that

were conducted in 4 meetings, each 70 minutes. The conjectures of students’

thinking and reaction were also included. We elaborated all of these in a

Hypothetical Learning Trajectory (HLT). As mentioned in Bakker (2004), the use

of HLT in this phase is as a guide in designing and developing the instructional

activities. As the preparation for the class observation and the interview with the

teacher, we also provided a classroom observation scheme and an interview

scheme (see appendix 1 and 2). These schemes were used as the remainder so we

did not miss the important aspect during the interview or the observation.

2. The design experiment

The design experiment phase aims to test and improve the conjectures in our

(41)

implemented in two cycles. The first cycle was done as the pilot study. A small

group consists of 6 students from class 4A were participated in the first cycle. The

findings from the first cycle were used to adjust and to improve the first version of

HLT. Then the revised HLT was implemented in the experimental class during the

second cycle. Twenty nine students Grade 4 were involved in this teaching

experiment. In this phase, the HLT has a role as a guideline to conduct the

teaching and learning process (Bakker, 2004).

3. Retrospective analysis

The retrospective analysis phase is important to do in design research. The

goal of this phase is to contribute in the development of a local instructional

theory. The analysis was done by focusing on the conjectures in HLT. In line with

this, Bakker (2004) stated that the third function of HLT in design research is as a

guideline to do the analysis.

3.3 Data Collection

In this study, there were some data that we used to answer the research question.

The data were collected in different way and for different purpose. The more

explanation is described in the following statements.

3.3.1 Preparation phase

Before the researcher conduct the teaching experiment, the researcher need to gain

some information as the starting point for the research. During the preparation

phase, the researcher did classroom observations in the experimental class, an

(42)

1. Classroom observation

The classroom observation was conducted as a preparation before the teaching

experiment on the second cycle. We need to do classroom observation in the

experimental class due to know how the teacher teaches the students, the

classroom’ culture and the socio-mathematics norms in the classroom, the

practical thing about the classroom setting, and more or less the behaviour and

characteristics of the students in the class. During the classroom observation, the

researcher recorded the whole learning process in video/ camera and also made

some field notes based on the observation scheme.

2. Interview with the teacher

The semi-structured interview with the teacher is also important to support or

compare the findings during the classroom observation. The researcher asked the

questions to the homeroom teacher from class 4D, Bu Intan based on the

interview scheme (see appendix 2) and also some follow up questions. The whole

interview was recorded by recorder. During the interview, the researcher also

made some notes for the important points.

3. Pretest

The pretest was conducted twice. The first written test held in the beginning of

the first cycle. The participants of the first pretest are 6 students from 4A. The aim

of the first pretest is to see whether the problems are clear and understandable for

the pupils or not. Besides, it also used to check whether the problems on the

pretest can measure the students’ prior knowledge like we want or not. The other

advantage of doing the small pretest with the small group is that we can ask

(43)

thinking, how they solve the problem, why they solve like that, what is the idea

behind their strategy. Then we can use this to improve our problems for the

second pretest.

The second pretest was conducted in the beginning of second cycle, before the

teaching experiment. The participants were all students from the experimental

class. The teacher gave the test and the students work individually for the given

time. The aim to do the second pretest is to know the prior knowledge of the

students. We used these findings to determine the starting point for the experiment

and to do the first adjustment of the revised HLT after conducting the first cycle.

3.3.2 Preliminary teaching experiment (the first cycle)

The first cycle was conducted in a small group of 6 students from class 4A. The

students were chosen based on the information from the teacher about their

achievement in mathematics. They are Ferdy as the representation of higher

achievement, 4 middle ones namely: Rati, Lani, Ando, and Falah, and 1 lower

achiever namely Nurul.

During the first cycle, the researcher taught the lesson based on the initial

HLT as in chapter 4. We recorded each lesson by video/ camera. We did small

interview with the students during the lesson to investigate their understanding

about the topic. We also made field notes and collect all students’ written work.

This cycle is an important step because the results of the first cycle were used to

improve and revise the HLT for the second cycle.

3.3.3 Teaching experiment (the second cycle)

The participant of the second cycle was all students from the experimental class.

(44)

by their own teacher based on the revised HLT. Instead of teaching, the researcher

was observing the learning process and making some field notes. The whole

learning process was recorded by video/ camera. The students’ written works also

were used as the data collection.

During the second cycle, we also have a small group of 2 as the focus group.

We recorded the discussion in that group. The data from the focus group was used

to get more detail picture about what happened during the learning process.

3.3.4 Posttest

To know the development of the students’ understanding about proportion, the

researcher should conduct a pretest before the teaching experiment and a posttest

after the teaching experiment. As the pretest, the posttest also were conducted

twice. First, in the end of the pilot experiment and the second one was held in the

end of the second cycle. The other aim of conducting the first posttest is to check

the structure of the problems whether it is understandable for the students or not

and then use the result to improve the problems on the second posttest.

During the posttest, the teacher gave some proportional problems (see

appendix 3) and the students worked individually for the given time. The

problems on the posttest were different with the problems on pretest but still with

the same indicators. We compared the students’ answer and reason from the

pretest and the post test. Although the main goal of this study is not to evaluate

the teaching method, the comparison between the students’ result from the pretest

(45)

The participants of the first posttest were the 6 students on the first cycle.

Meanwhile the participants of the second posttest were all students from the

experimental class.

3.3.5 Validity and reliability

The methods which are used to collect the data during this study are not limited in

one method. The data from the interview are collected by using an audio device

while the data from the classroom observation are collected by using video

recorder and also by making some field notes. The variation of how we collect all

the data makes the methods triangulation possible. It contributes to the validity of

data collection.

The clear description on how the data collected may let the reader to follow

the process of data collection. It improves the external reliability of the data

collection because of the traceability. In addition, the reliability also refers to the

reasonableness and the power of arguments for the inferences. To improve that,

we also did the peer examination by discussing the critical issue with the teacher

and the colleagues.

3.4 Data Analysis

This study involves different kind of data. We have data from the classroom

observation, interview with the teacher, the written test before and after the

teaching experiment, and also the students’ written work during the lessons. We

analyzed them by using HLT as the guideline to derive a conclusion and answer

(46)

3.4.1 Pretest

The analysis data of the pretest involved a quantitative and a qualitative analysis.

We examined the students’ work and count the number of correct answer to

determine the level of students’ understanding. Indeed, we also looked in the

students’ scratch and their strategy to get more details picture about the student’s

thinking. We used these findings to determine the starting point for the

experiment.

3.4.2 Preliminary teaching experiment (the first cycle)

The data from the first cycle are the video from the whole lessons, field notes and

the pupils’ written work. The data analyses of the first cycle were started by

watching the video-registration and choose some fragments of them. We should

consider the fragments in where the videos show that the learning process is

success and reach the goal as we expected or otherwise, it is not happened like our

expectation. Then the selected fragments were transcribed and were used to test

the conjectures in the first version of HLT. To support the result of video analysis,

we used the data from pupils’ written work and the field notes as well. We used

these findings to revise and improve the initial version of HLT for the second

cycle.

3.4.3 Teaching experiment (the second cycle)

The data from the classroom observation and teacher interview during the

preparation phase were analysed to get the basic information about the context in

which the teaching experiment was conducted. The information can be used when

(47)

The data of the second cycle are the video of the whole lessons, the video of

the focus group and the pupils’ written work. The analysis of the video

observation was started by watching the video registration. Some interesting

fragments of the video were transcribed and used to test the conjectures on HLT.

The analysis from the video of the whole lessons in the classroom was used to get

an overview of the lesson, how the learning process happened in the classroom,

what is missing during the teaching process or the discussion part. Meanwhile the

analysis from the video of focus group was used to get more detail picture about

the development of students’ understanding. In addition, the students’ written

work was used as additional data. Overall, the results of the analysis were used to

derive conclusions, to answer the research question and to improve the original

HLT as well.

3.4.4 Posttest

As in the analysis data of the pretest, in the analysis data of posttest also involved

a quantitative and a qualitative analysis. We examine the students’ work, to count

the number of correct answer and to see their strategy. We use these result and

compare it with the result of pretest to see what students have learned. Thus, we

get the impression of how the learning sequences work, how the ratio table may

help the pupils in developing their proportional understanding.

3.4.5 Validity and reliability

The data collection of this study is varying, namely the videos, the field notes, and

the students’ written works. The analysis of more than one type of data makes

Gambar

Table 2.1 The Strategies on the Ratio Table
Table 2.3 The Curriculum Grade 4 on Second Semester (Depdiknas, 2006)
table to the students
table on the blackboard.
+7

Referensi

Dokumen terkait

Students’ learning process in extending their understanding was started from developing sense of fullness of percentage, which afterwards continued to constructing

5.3 Solving problems related to perimeter and area of square and rectangle.. However, it is common that the focus in teaching area measurement in Indonesia is placed

Knowledge: (i) Students define angle, (ii) Students recognize angle measures, (iii) Students define right angle, (iv) Students construct geometric properties of triangle

difference of students’ strategies before and after the learning process in the table.. There are some strategies that focus group students used in the pre-test and

Guru meminta siwa untuk menjelaskan lebih jauh alasan mereka tentang jawaban tersebut karena gambar pada LKS 1 dan LKS 2 sama-sama dari kondisi yang sama namun

The learning activities that can be used to develop the understanding on those concepts are: (1) comparing area activity by using hands or books as the measurement tools could

The researcher analyzes the result of the teaching experiment in the second and third cycle by selecting particular data which can be used to answer the research

 Guru mendorong siswa untuk menggunakan cara informal dalam menentukan banyaknya rumput yang diperlukan untuk menutupi taman lingkaran di dalam lahan yang berbentuk