MASTER THESIS
Veronika Fitri Rianasari NIM 09715014
SURABAYA STATE UNIVERSITY
POSTGRADUATE PROGRAM
MATHEMATICS EDUCATION STUDY PROGRAM
SUPPORTING STUDENTS’ UNDERSTANDING OF
PERCENTAGE
MASTER THESIS
A Thesis Submitted to Surabaya State University Postgraduate Program
as a Partial Fulfillment of the Requirements
for the Degree of Master of Science
in Mathematics Education Program
Veronika Fitri Rianasari NIM 09715014
SURABAYA STATE UNIVERSITY
POSTGRADUATE PROGRAM
MATHEMATICS EDUCATION STUDY PROGRAM
iii
DEDICATION
This thesis is dedicated to my parents, my sisters and my
brothers who give me never ending love and supports.
It is also dedicated to my fiancé who has been a great source of
my motivation and inspiration.
iv ABSTRACT
Rianasari, Veronika Fitri. 2011. Supporting Students’ Understanding of
Percentage. Master Thesis, Mathematics Education Study Program, Master Program of Surabaya State University. Supervisor: (I) Prof. I Ketut Budayasa, Ph.D., and (II) Sitti Maesuri Patahuddin, Ph.D.
Keywords: design research, percentage, understanding, pre knowledge,
contextual situations, bar models
Many researches revealed that pupils often find difficulties to understand percentage although they are able to recite percent as per hundred and carry out the computations correctly. This might happen due to the way in which the learning percentage has been taught that tends to focus on procedures and recall instead of getting a real understanding of percentage. Considering this facts, this research aimed to develop a local instructional theory to support students to extend their understanding of percentage. This research used design research method as an appropriate means to achieve the research aim.
In Realistic Mathematics Education approach, in which the basic concept is rooted from Freudenthals’ idea, mathematics is the activity of organizing matter from reality. Therefore, mathematics should be experientially real for the students. Consequently, in this research the instructional activities were designed through exploring some contextual situations in which percentages play role.
This research involved students and mathematics teachers of grade 5 in SD Laboratorium UNESA and SD BOPKRI III Demangan Baru Yogyakarta. The research conducted in SD Laboratorium UNESA was conducted in two cycles and it aimed at trying out the initial hypothetical learning trajectory. The research in SD Laboratorium UNESA became the preliminary researches of the research in SD BOPKRI III. In this research, the students involved were the students who have learned about percentage. Therefore they had pre knowledge about percentage. Most of the students were get used to work in formal level in solving percentage problems.
v ABSTRAK
Rianasari, Veronika Fitri. 2011. Upaya-Upaya yang Mendukung Pemahaman
Siswa Mengenai Persentase. Tesis, Program Studi Pendidikan Matematika, Program Pascasarjana Universitas Negeri Surabaya. Pembimbing: (I) Prof. I Ketut Budayasa, Ph.D., dan (II) Sitti Maesuri Patahuddin, Ph.D.
Kata-kata Kunci: penelitian desain, persentase, pemahaman, pemahaman awal,
situaasi kontekstual, model bar
Banyak penelitian menunjukkan bahwa siswa sering menemukan kesulitan untuk memahami persentase meskipun mereka bisa mengungkapkan bahwa persen adalah per seratus dan dapat melakukan perhitungan dengan benar. Hal ini mungkin terjadi karena pembelajaran persentase cenderung berfokus pada prosedur dan ingatan dan bukan pada pemahaman mengenai persentase. Menyadari fakta-fakta ini, penelitian ini bertujuan untuk mengembangkan teori instruksional lokal untuk mendukung siswa untuk memperluas pemahaman mereka mengenai persentase. Penelitian ini menggunakan metode penelitian desain sebagai metode yang tepat utnuk mencapai tujuan penelitian.
Dalam pendekatan Pendidikan Matematika Realistik, yang konsep dasarnya berakar dari ide Freudenthal, matematika harus berdasarkan pengalaman yang nyata bagi siswa. Sehingga, dalam penelitian ini kegiatan instruksional dirancang melalui eksplorasi situasi-situasi kontekstual yang melibatkan persentase.
Penelitian ini melibatkan siswa-siswa dan guru-guru matematika kelas 5 di SD Laboratorium Unesa dan SD Bopkri III Demangan Baru Yogyakarta. Penelitian di SD Laboratorium Unesa dilakukan dalam dua siklus dan bertujuan untuk mengujicobakan desain pembelajaran awal. Penelitian di SD Laboratorium Unesa menjadi penelitian awal bagi penelitian di SD Bopkri III. Dalam penelitian ini, siswa yang terlibat adalah siswa yang telah belajar persentase. Oleh karena itu, mereka memiliki pengetahuan awal mengenai persentase. Sebagian besar siswa terbiasa memecahkan masalah persentase dengan cara yang formal.
Hasil eksperimen menunjukkan bahwa pengetahuan awal siswa berpengaruh pada proses belajar mereka. Pada beberapa kasus, sebagian besar siswa cenderung melakukan perhitungan prosedural, yang mungkin tidak masuk akal bagi mereka, daripada menggunakan penalaran. Hasil eksperimen juga menunjukkan bahwa investigasi situasi kontekstual yang melibatkan persentase dapat menstimulasi siswa untuk memperluas pemahaman mereka mengenai persentase. Proses belajar
siswa dalam memperluas pemahaman mereka dimulai dari mengembangkan sense
vi
ACKNOWLEDGEMENT
In the first place I would like to offer my highest gratitude to Jesus Christ, my Lord and my Saviour who always gives me His endless love and guides my life. I would like to thank Jesus Christ for letting me accomplish this master thesis entitled Supporting Students’ Understanding of Percentage.
This master thesis would not have been possible without the guidance, supports, assistance, and encouragement from many people. I would like to present my purest gratitude to all wonderful people with their great and valuable help and encouragement during my struggle on this journey of study.
First and foremost, I gratefully acknowledge Prof. I Ketut Budayasa, Ph.D, Sitti Maesuri, Ph.D, as my supervisors for their supervision, advice, and guidance. I also gratefully acknowledge Barbara van Amerom as my Dutch supervisor for her help, supports and guidance from the early stage of this research. I truly and deeply respect and admire them.
Second, I like to offer my gratitude to the member of my master thesis examiners and reviewers, Prof. Dr. Sitti Maghfirotun Amin, M.Pd., Dr. Agung Lukito, M.S. and Prof. Dr. R. K. Sembiring for their valuable input, suggestions and feedback on my master thesis. This master thesis would not have been possible without their valuable suggestions, criticisms and questions for the improvement of this master thesis.
Third, I dedicated my gratefully thank to Prof. Dr. I Ketut Budayasa, Ph.D as the Director of Post Graduate Program and to Dr. Agung Lukito, M.S as the Head of Mathematics Education Master Program. Their support and help to this study program enable us to cope with any problems related to the management of the program, especially for International Master Program on Mathematics Education (IMPoME). Moreover, I dedicated my gratefully thank to all of my lecturers in Post Graduate Program of Mathematics Education of Surabaya State University for their supports and guidance during my study. I also dedicated my gratefully thank to all my lecturers in Freudenthal Institute of Utrecht University in Netherland for their supports and guidance during my one year study in Netherland. I would like to dedicate my gratitude for them for spending their precious time during this study.
Fourth, my sincere gratitude is dedicated to my colleagues in this master program, especially for the eleven students of IMPoME 2009. They were my family when I was far from my home. They have been motivating colleagues who always give help and supports during my study. Thanks for our beautiful friendship!
vii
a caring father who always motivates and encourages me to pursue this life. My mother, Khatarina Mariani, has always been my source of energy with her endless prayers, love and care. My sisters, Theresia Renny Andarwati and Yoanne Dian Retnosari, and my brothers, Iwan Wijayanto and Agustinus Heru Aprianto, have always been my motivation with their advice and love. Moreover, my deepest gratitude will be delivered to my lovely fiancé, Nobertus Ribut Santoso, who always loves me and has been my source of motivation and inspiration. For all these wonderful people of my life, I would like to dedicate my greatefully thank for all of you. I feel so blessed to have you in my life. I love you so much.
viii
TABLE OF CONTENTS
APPROVAL ... ii
DEDICATION ... iii
ABSTRACT ... iv
ABSTRAK ... v
TABLE OF CONTENTS ... viii
LIST OF FIGURES ... xi
LIST OF TABLES ... xii
LIST OF APPENDICES ... xiii
1 INTRODUCTION ... 1
1.1 Background ... 1
1.2 Research Question ... 3
1.3 Aim of the Research ... 3
1.4 Definition of Key Terms ... 4
1.5 Significance of the research... 5
1.6 Assumptions ... 6
2 THEORETICAL FRAMEWORK ... 7
2.1 Percentage ... 7
2.1.1 Percentage as part whole relationship ... 7
2.1.2 Percentage as a ratio ... 8
2.2 The Didactical Use of Bar Model ... 10
2.3 The strategies to work with percentage ... 11
ix
2.5 Emergent Perspective ... 14
2.6 Percentage in the Indonesian Curriculum for 5th grade ... 16
2.7 Hypothetical Learning Trajectory ... 17
2.8 Hypothetical Learning Trajectory of the Preliminary Researches ... 18
2.8.1 Hypothetical Learning Trajectory 1 ... 18
2.8.2 Hypothetical Learning Trajectory 2 ... 39
3 RESEARCH METHOD ... 45
3.1 Design Research Methodology ... 45
3.2 Research Subjects ... 47
3.3 Data Collection ... 47
3.4 Data Analysis, Reliability, and Validity ... 48
3.4.1 Data Analysis ... 48
3.4.2 Reliability ... 49
3.4.3 Validity ... 50
4 THE IMPROVED HYPOTHETICAL LEARNING TRAJECTORY ... 51
5 RETROSPECTIVE ANALYSIS ... 61
5.1 Pre test ... 62
5.1.1 Exploring students’ sense of fullness of percentage ... 62
5.1.2 Exploring students’ prior knowledge of the meaning of percent ... 63
5.1.3 Exploring students’ acquisition in working with percentage greater than a hundred ... 67
5.1.4 Exploring students’ acquisition in using their prior knowledge to solve a problem ... 68
5.1.5 Conclusion of the pre test ... 70
x
5.2.1 Developing sense of fullness of percentage ... 71
5.2.2 Constructing the meaning of percent ... 77
5.2.3 Constructing sense of percentage as a relative value ... 87
5.2.4 Using percentage in proportional comparison problem ... 94
5.2.5 Expanding knowledge to percentage greater than 100 ... 101
5.3 Post test ... 106
5.4 Discussion ... 109
5.4.1 Contextual Situation ... 110
5.4.2 Intertwinement of mathematical topics ... 110
6 CONCLUSIONS ... 112
6.1 Answer to the research question ... 112
6.2 Local Instructional Theory ... 117
6.3 The Weaknesses of the Research ... 120
6.4 Recommendation ... 121
6.4.1 Reflection ... 121
6.4.2 Revision ... 122
6.4.3 Recommendation for further research ... 123
REFERENCES ... 126
xi
LIST OF FIGURES
Figure 5.1 Some of students’ works in determining percentage ... 66
Figure 5.2 Rio’s answer in the pre test in determining the sweeter drink ... 69
Figure 5.3 Various students’ strategies to estimate the percentage of loading process ... 73
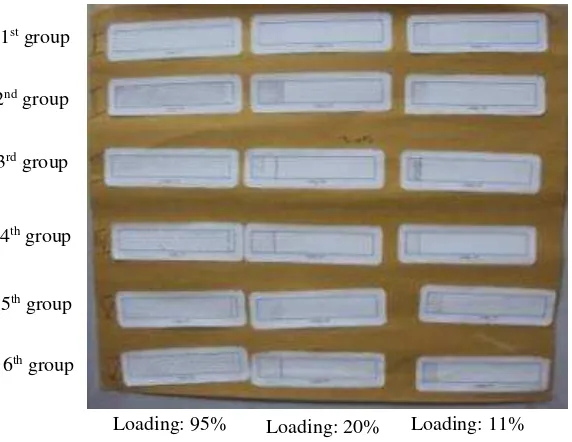
Figure 5.4 Students’ work in shading the loading bar ... 76
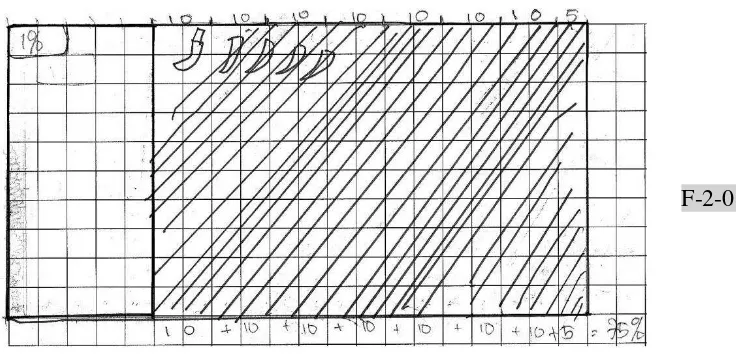
Figure 5.5 Bar model used to estimate percentage of the area used to plant chilli 80 Figure 5.6 One of students’ strategies using 10% as the benchmark percentage . 83 Figure 5.7 One of students’ strategies using grid pattern... 83
Figure 5.8 The work of Rani’s group ... 85
Figure 5.9 An example of student’ answers using percentage to solve proportional comparison problem ... 96
Figure 5.10 Gandhang’s answer that compared absolutely the volume of extract orange ... 97
Figure 5.11 Rio’s answer in drawing chocolate having 50% extra free ... 102
Figure 5.12 An example of incorrect answer in working with percentage greater than a hundred ... 103
Figure 5.13 Rio’s answer using bar model and benchmark percentages ... 104
Figure 5.14 Rani’s answer using benchmark percentages ... 105
xii
LIST OF TABLES
Table 2.1 An Interpretative framework for analyzing individual and collective
activity at the classroom level ... 15
Table 2.2 Learning fraction, decimal, and percentage for 5th graders in Indonesian curriculum ... 17
Table 2.3 The instructional activities in HLT 1 ... 19
Table 2.4 The Outline of HLT 2 ... 40
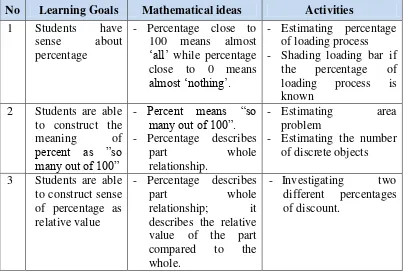
Table 4.1 The instructional activities in HLT 3 ... 51
Table 4.2 The outline of HLT 3 ... 53
xiii
LIST OF APPENDICES
Appendix 1: The Analysis of the First Cycle in SD Laboratorium ... A-Error! Bookmark not defined.
Appendix 2: The Retrospective Analysis of the Second Cycle in SD Laboratorium
... A-Error! Bookmark not defined.
Appendix 3: The lesson plans of teaching experiment .... A-Error! Bookmark not
defined.
Appendix 4: Students’ worksheet ... A-Error! Bookmark not defined.
1 CHAPTER I INTRODUCTION
1 INTRODUCTION
1.1 Background
Percentage is one of the most widely used mathematical topics in daily life
and holds substantial place in the school curriculum for almost any science and
social studies (Arthur J. Baroody et al, 1998; James E. Schwartz et al, 1994;
Parker and Leinhardt, 1995). The relationship between percentage and other
mathematical concepts such as fraction and decimal offers many possibilities to
do arithmetic in a flexible way (Galen et al, 2008). Percentages are not only
another way of writing down simple fractions, but also derive their right to exist
from the limitations of regular fractions; fractions are difficult to compare with
each other, and the scale that they provide is rather unrefined (Galen et al, 2008).
Considering the importance of percentage in daily life, percentage has been
taught since elementary school. However, many percentage problems indicate that
education is primarily focused on procedures and recall instead of getting a real
understanding of percentage (Van den Hauvel-Panhuizen, 1994). At the other
hand understanding of percentage is necessary to ensure proper interpretation of
social studies, science materials, and many situations in daily life (James E.
Schwartz et al, 1994). Many students can quickly learn how to calculate
percentage accurately because they are familiar with those computations they
have already learned in working with fractions and decimals, but they might
Regarding this fact, there were two important issues that were
well-considered as the reasons to design new instructional activities in this research.
The first issue is pupils often find it difficult to understand percentage and apply it
to solve problems in context (Kouba et al., 1988 in Koay Phong Lee, 1998; Parker
and Leinhardt, 1995). The finding in the study of Koay (1998) shows that ability
to recite percent as per hundred and carry out the computations correctly does not
lead to the ability to interpret and apply the concept in context. Koay found it
easier for students to perform computation problems than to explain the meaning
of percent and also knowledge of percent was often rigid and rule-bound.
The second issue is about the way of teaching and learning mathematics in
Indonesia. Mathematics in Indonesian curriculum tended to be taught in a very
formal way; teachers explain the mathematics operation and procedures, give
some examples, and ask pupils to do the other similar problems (Armanto, 2002).
Formal way of teaching on percentage tends to restrict pupils’ creativity and
flexibility in their strategies to solve the percent problem. When students solve
percent problem (e.g., 75% of 160), most of them know that they have to
transform 75% to the fraction 75/100 and then multiply with the ‘whole’, but if
they are asked to explain how they come to the answer, they struggle to explain it.
It shows that many of students can remember the ‘right rule’ for finding
percentage but cannot explain what percentage is. Considering this fact, the
teaching and learning of percentage need to focus on how understanding of
The need to focus on how understanding of percentage can be taught leads
to the need of activities that are aimed at supporting students making sense of
percentage. This need leads to the third issue namely explorative activities. In
Realistic Mathematics Education where teaching is built on the informal
knowledge of the students, it is important to give students the opportunity to
explore some daily life contexts in which percentages play a role (Van den
Hauvel-Panhuizen, 2003). This idea is relevant with Freudenthal’s idea that views
mathematics as a human activity instead of seeing mathematics as a subject to be
transmitted (Freudenthal, 1991). In many books and researches about percentage,
there are many problems that can provoke students to think about percentage,
such as discount problems, tax problems, increasing or decreasing rate of
population and so on. In order to develop instructional activities on percentage for
Indonesian students, it is important to adjust those kinds of problems based on
Indonesian contexts and situations.
1.2 Research Question
The research question of this study is ‘How to support students to extend
their understanding of percentage?’.
1.3 Aim of the Research
Considering those three issues in teaching and learning percentage, this
research aimed at developing a local instructional theory to support students’ to
1.4 Definition of Key Terms
In this section, some important terms relating with the research will be
explained. This explanation aimed to help the reader to follow the idea of this
research.
1. Understanding
Understanding is the number of linkages that one can make between his/her
schema and an abstract or physical object such as a picture, situation,
information, or concept. One has a good understanding of an object, if he/she
could make many linkages relating to the essential aspects of the object. Skemp
(1987) said that to understand something means to assimilate it into an
appropriate schema.
2. Support
Support is any kind of effort of giving encouragement to someone or
something to succeed. In this research, support means any kinds of efforts
provided by researcher or teacher to stimulate students in learning percentage.
The support in this research includes the instructional activities, tools,
guidance, and questions posed by teacher.
3. Percentage
Percentage is relationship based on a one-hundred-part whole and it gives
relative measure, not an absolute measure.
4. Extend the understanding of percentage
Extend the understanding of percentage means constructing the understanding
research, the understanding of percentage that student has to grasp is that a
percentage is relationship based on a one-hundred-part whole that gives
relative measure. Students do not have to explain this in this manner, but they
have to show an awareness of the fact that percentages are always related to
something. The awareness of this idea can be shown by some indicators.
Students are aware of this idea if and only if the students know that when they
divide a whole into ten or a hundred parts then one part represents 1% or 10%
of the whole and the students know that they cannot compare percentages
absolutely without taking into account to what the percentages refer. With
respect to computational goals, a variety of types of computations with
percentage are explored, such as compute the part of a whole while the
percentage is given. However, it is more important that students are able to use
percentage in a situation in which they are needed, when different parts of
different wholes have to be compared.
1.5 Significance of the research
The significance of this research concerned with the theoretical significance
and practical significance for teachers or researchers. With the respect of
theoretical significance, this research contributes to an empirically grounded
instructional theory for learning percentage. With the respect of practical
significance, this research gives an overview to the researcher and other
researchers about how to design an instructional activity for learning percentage
and also this research gives an overview to mathematics teachers about how to
1.6 Assumptions
This research was built upon some assumptions. The first assumption was
that the students were serious in doing the task given during the teaching
experiment. The second assumption was that the teacher was serious in
conducting the teaching and learning process. The third assumption was that the
environment of the school was conducive in supporting the teaching and learning
7 CHAPTER II
THEORETICAL FRAMEWORK
2 THEORETICAL FRAMEWORK
As described in the first chapter, the aim of this research is to develop local
instructional theory on supporting students to extend their understanding of
percentage for young students, age 10 or 11 years old in 5thgrade. For those need, this chapter presents the theoretical framework that aims to provide base of this
research. Literatures about percentage, Realistic Mathematics Education (RME),
about Indonesia curriculum, and about hypothetical learning trajectory were
studied to elaborate this theoretical framework.
2.1 Percentage
Percentage is one of the most widely used mathematical topics in daily life.
The many uses of percentage have led to varying interpretations of the meaning of
percentage (Parker and Leinhardt, 1995). According to Parker and Leinhardt
(1995), percentage can describe part whole relationship and can describe a ratio
based upon the meaning of percentage.
2.1.1 Percentage as part whole relationship
Percentage as part whole relationship describes relative value of the part
compared to the whole. Percentages are relationships based on a
one-hundred-part whole and it gives relative measure, not an absolute measure (Fosnot & Dolk,
2002). Students do not have to explain this in this manner, but they have to show
they therefore cannot be compared without taking into account to what they refer
(Van den Heuvel-Panhuizen, 1994).
A common example is a news report that candidate receive 45% of the vote.
The percentage describes the subset of people who vote for the candidate compare
to the set of all people who vote. Within the part whole relationship meaning, the
percentage ‘100%’ is interpreted as the whole. However, percentages greater than
100 are particularly problematic here. Students may struggle to interpret a
percentage such as 150% because in this case the part is bigger than the whole.
Other problems instead of part-whole problems such as increase-decrease
problems are needed to incorporate the broad range of common application.
2.1.2 Percentage as a ratio
Percentage as a ratio describes a comparison between two quantities from
different sets or different attributes of the same set. Van den Heuvel-Panhuizen
(1994) describes that a key feature of percentage, that one has to understand in
order to have insight, is that a percentage is a relation between two numbers or
magnitudes that is expressed by means of a ratio. It describes relative amount by
which one set is compared to another. For example, suppose the price of an item
was originally Rp 12.000,00 and has been increased to Rp 15.000,00. The ratio of
the new price to the original price is 150/120; or as stated in percentage, the new
In this research, the researcher only focused on the meaning of percentage
as part whole relationship. Researcher only focused on this meaning because it is
the most salient of comparative situations, imaginable for young students in grade
5, and can support students understanding of percentage as relationship based on
one-hundred-part whole. Lembke (1991) asserts that an important component of
percentage knowledge is the understanding of the concept of the base 100,
knowing that percentage always involves comparison of something to 100. That is
not coincidental that the scale goes to 100. This is because in this way it is
possible to place percentages neatly into our number system so that we can easily
convert them into decimal (Galen et al, 2008).
Learning process of percentage should include goals concerning the
understanding of percentage and also computational goals. With respect to
computational goals, a variety of types of computations with percentage are
explored, such as compute the part of a whole while the percentage is given.
However, it is more important that students are able to use percentage in a
situation in which they are needed, when different parts of different wholes have
to be compared (Van den Heuvel-Panhuizen, 1994).
There are many situations in daily life in which percentage play a role. In
this research, the contextual situations used as a support in the learning percentage
are situations in which percentage plays an important role in comparing
proportion. Those contextual situations are discount, concentration of an
ingredient, loading in computer process, and other contextual situations in which
2.2 The Didactical Use of Bar Model
Although the meanings of percentage are diverse, the essence of percentage
is proportionality; percentage is used to describe proportional relationship (Parker
and Leinhardt, 1995). Percentages indicate the proportion of a specific total that is
set to 100 (Galen et al, 2008). This aspect of proportional relationship involving
an equivalent relationship between two ratios suggests that there is needed to offer
an appropriate model to support student to reason proportionally. The model
offered in this research is bar model.
In the learning process of percentage, learning percentage is embedded
within the whole of the rational number domain and is strongly entwined with
learning fraction, decimals and ratio with the bar model connecting these rational
number concepts (Middleton et al in Van den Heuvel-Panhuizen, 2003). The use
of model bar in learning percentage is beneficial for students. The first benefit is
that bar model has area that makes it easier to talk in terms of “the whole” (Galen
et al, 2008). As the second benefit, the bar model gives a good hold for estimating
an approximate percentage, especially in cases where the problems concern
numbers that cannot be simply converted to an simple fraction or percentage. The
third benefit is that the bar model provides the students with more opportunity to
progress. This also means that the bar model can function on different levels of
2.3 The strategies to work with percentage
In this research, the students had pre knowledge about strategy to work with
percentage. They knew the procedural algorithm to solve percentage problem,
especially in computing a part of a whole if the percentage is given. Since the
procedural algorithm sometimes did not make sense for them, the students should
be given opportunities to explore any number of strategies to work with
percentages that are meaningful for them. Based on the research and discussion of
Parker and Leinhardt (1999), it has been discussed some strategies. Those
strategies are using benchmark percentage, proportional thinking strategies, and
additive building-up or splitting strategies. In this research, researcher only
focused on using benchmark percentage and additive building-up strategies. As
what have been discussed in the previous subchapter, the use of bar model also
can be one of the strategies to work with percentage. Therefore, the strategies
besides procedural algorithm that the students could use to work with percentage
problem are given as follows:
1. Benchmarks percentage strategy
Benchmark of percentages describes a percent that can be replaced by a fraction
with numerator of one, known as a unit fraction; for example, 50% of something
is ½ of that thing, and 25% of something is ¼ of that thing. By thinking of these
benchmark percent values as fractions, students are able to make use of
elementary fractional relationships when solving problems (Parker and Leinhardt,
2. Additive building-up or splitting strategy
Additive building-up or splitting strategy refers to addition of some benchmarks
percentage. For example in determining 15% of Rp 100.000,00, first one might
find 10% of Rp 100.000,00, and find 5% of Rp 100.000,00, then add those two
calculations (10 % of Rp 100.000,00 and 5% of Rp 100.000,00) to get the final
result.
3. Using bar model
Bar model can be used as a tool to estimate percentage. The benchmark
percentages, fractions, or decimals can be used in this model to solve percentage
problems.
2.4 Realistic Mathematics Education
Realistic Mathematics Education (RME) is a domain-specific instruction
theory for mathematics education (Treffers, 1987; Van den Heuvel-Panhuizen,
2003). RME is rooted in Freudenthal’s interpretation of mathematics as a human
activity (Gravemeijer, 1994). Based on Freudenthal’s idea, mathematics must be
connected to reality, stay close to students and should be relevant to society. The
use of realistic contexts became one of the determining characteristics of this
approach to mathematics education (Van den Heuvel-Panhuizen, 2003). In this
research, daily life percent problems are a set of contextual problem situation for
students to learn about percentage.
This section will elaborate the characteristics of RME used as a guideline in
by elaborating five characteristics defined by Treffers (1987) that can be seen as
heuristics for instructional design.
1. Phenomenological exploration
In the first of instructional activity, the mathematical activities take place within a
concrete context. This mathematical activity should be experientially real for
students. In this research, daily life situations in which percentage play an
important role such as loading proces, discount, area, and free extra context are
employed as the contextual situation for students to learn.
2. Using models and symbols for progressive mathematization
In learning mathematics, varieties of vertical instruments such as models and
symbols are offered, explored, and developed to bridge the level difference from a
concrete level to a more formal level. In this research, students’ informal
knowledge as the result of explorative activities has to be developed into formal
knowledge of percentage. Students drawing in estimating loading process served
as the bases of the emergence of bar model as a tool to work with percentage.
3. Using students’ own construction and productions
Giving opportunities for students to explore and contribute various strategies can
support students’ individual productions. Students’ own productions can indicate
where they are and how they progress in learning process. In each activity, teacher
has a role to provide opportunities for students to explore their own strategy.
4. Interactivity
Interaction among students and between students and teacher can support the
classroom culture which is conducive. Therefore, one of the tasks of the teacher is
to establish the desired classroom culture (Gravemeijer & Cobb, 2006). This
social interaction can stimulate students to shorten their learning path and support
their own production. In this research, the social interaction is facilitated by group
discussion, presentation of students’ production, and criticizing strategies among
groups.
5. Intertwinement
In designing an instructional activity, it is important to do integration of the
various domains. This intertwining of learning strands is exploited in solving real
life percent problems, in which problems not only support their understanding of
percentage but also support the development of students’ number sense; especially
the relation between percentage and fraction or decimal. In addition, in this
research, the learning of percentage is also intertwined with the area topic.
2.5 Emergent Perspective
Gravemeijer & Cobb (2006) stated that “a key element in the ongoing
process of experimentation is the interpretation of both the students’ reasoning
and learning and the means by which that learning is supported and organized”.
They contend that it is important to be explicit about how one is going about
interpreting what is going on in the classroom. In this research, the framework
used for interpreting classroom discourse and communication is the emergent
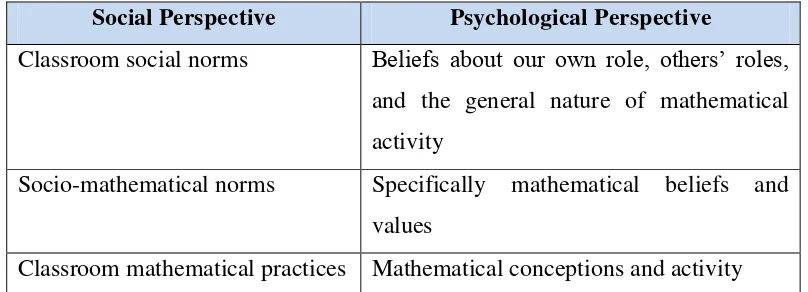
Table 2.1 An Interpretative framework for analyzing individual and collective
activity at the classroom level
Social Perspective Psychological Perspective
Classroom social norms Beliefs about our own role, others’ roles,
and the general nature of mathematical
activity
Socio-mathematical norms Specifically mathematical beliefs and
values
Classroom mathematical practices Mathematical conceptions and activity
Based on Gravemeijer & Cobb (2006), three aspects of emergent perspective are
elaborated. The explanation and discussion of these aspects is relatively brief
because the aim is to develop the rationale for the theoretical framework rather
than to present detailed analyses of these aspects.
The first aspect of emergent perspective concerns the social norms that are
established in the classroom. Social norms refer to expected ways of acting and
explaining that is established through negotiation between the teacher and
students. The examples of social norms that engaged in classroom included the
obligations for students to explain and justify solutions, attempt to make sense of
explanation given by other students, and giving opinion indicating agreement and
disagreement.
The second aspect is socio-mathematical norms. Socio-mathematical norms
refer to the expected ways of explicating and acting in the whole class discussion
that are specific to mathematics. The examples of socio-mathematical norms
include what count as a different mathematical solution, a sophisticated
With the respect of the socio-mathematical norms, students’ explanation and
reasoning dealing with investigating contextual problems about percentage are
explored.
The last social aspect of emergent perspective is classroom mathematical
practices. Classroom mathematical practice refers to the normative ways of acting,
communicating, symbolizing mathematically that are specific to particular
mathematical ideas or concepts. Students interpretation or ideas about percentage,
the way they make visual model of percentage, and the way they work with
percentage will be analyzed.
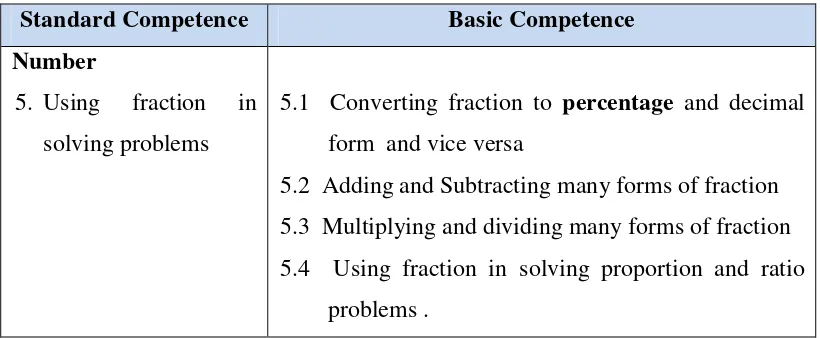
2.6 Percentage in the Indonesian Curriculum for 5th grade
In Indonesia National Curriculum, percentage is taught in 5th grade of elementary school. Before students learn about percentage, they have already
learned about meaning of fraction and addition and subtraction of fraction in the
Table 2.2 Learning fraction, decimal, and percentage for 5th graders in Indonesian
5.2 Adding and Subtracting many forms of fraction
5.3 Multiplying and dividing many forms of fraction
5.4 Using fraction in solving proportion and ratio
problems .
Looking at the Indonesia National Curriculum, percentage is taught in close
relation to fraction and decimal. Based on observation, the learning of percentage
sometimes goes very fast to the formal way and it is taught as another
representation of fractional notation. Considering this fact and the need to support
students to extend their understanding of percentage, this research focused on the
learning of percentage in the 5th grade by emphasizing the understanding of percentage.
2.7 Hypothetical Learning Trajectory
Bakker (2004) said that a design and research instrument that proved usefull
Simon (1995, in Simon and Tzur, 2004) described that an HLT consists of the
goal for the students’ learning, the mathematical task that will be used to promote
student learning, and hypotheses about the process of the students’ learning.
Whereas the teacher’s goal for student learning provides a direction for the other
components, the selection of learning tasks and the hypotheses about the process
of student learning are interdependent. Therefore, an HLT informs researcher and
teacher how to carry out a particular teaching experiment (Bakker, 2004). During
the preliminary and teaching experiment, HLT was used as a guideline for
conducting teaching practice. HLT was also used in the retrospective analysis as
guideline and point of reference in answering the research question.
2.8 Hypothetical Learning Trajectory of the Preliminary Researches 2.8.1 Hypothetical Learning Trajectory 1
Implementing many ideas elaborated in the theory above, this research used
many daily life contexts such as discount, computer process, and some other
contexts in which percentage plays an important role. As the starting point, this
research designed an activity to assess informal knowledge of students on
percentage. In Realistic Mathematics Education where teaching is built on the
informal knowledge of the students, the teaching of percentage could start with
assessing what the students already know about percentage (Van den
Heuvel-Panhuizen, 1994). After that, the context about computer process, estimating the
percentage of loading process, was chosen to construct the meaning of percentage.
To give students opportunity to explore the meaning of percentage, some contexts
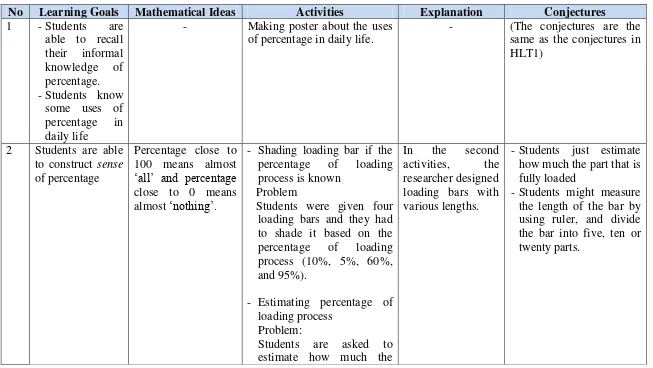
Those kinds of activities were elaborated in a set of instructional activities.
This set of instructional activities is divided into six different main activities and it
is accomplished in seven days. The instructional activities are presented below:
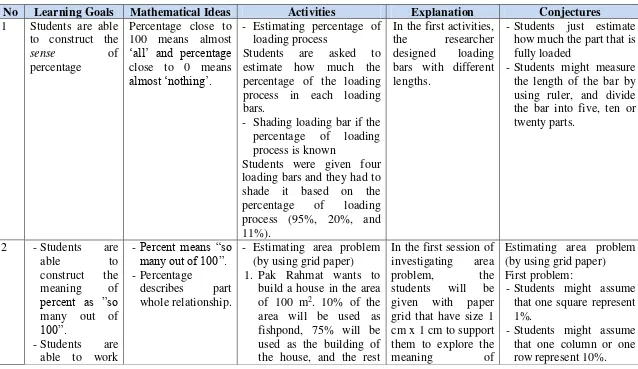
Table 2.3 The instructional activities in HLT 1
No Learning Goals Mathematical ideas Activities
No Learning Goals Mathematical ideas Activities
The instructional activities for learning percentage that were embedded in the
hypothetical learning trajectory will be described in detail as follows:
2.8.1.1 Exploring informal knowledge of percentage Goal:
- Students are able to show their informal knowledge of percentage.
- Students know some situations in which percentage play role.
- Students realize that percentage is widely used in our daily life.
Activity: Making poster of percentage Description of the activity:
Before the first lesson, teacher gives homework to students to collect all things
around them that show the use of percentage in their daily life. They can collect
some advertisements or pictures from magazine or newspaper, or table ingredients
that involve percentage, or other information involving percentage. In this first
meeting, they have to make a poster about the use of percentage in a group of four
or five students. After making the poster, all groups have to show the poster in the
Conjecture of students’ informal knowledge:
- Students show the use of percentage in discount price. I think most of the
students will show the picture about percentage of discount because it is one of
the familiar contexts in daily life.
- Students show the percentage of sugar or any substance in ingredient table.
- Students show information involving percent from magazine or newspaper, for
example report of vote for candidate in an election.
Class discussion:
When students tell about the poster, teacher can pose question to determine
what they already know about percentage. For example if student make a poster
that involve the use of percentage in the discount of clothes in supermarket,
teacher can pose such questions “Do you feel happy if there is discount in the
price? Why?” or “How if the discount is 90% or only 5%?” to know whether they
realizes that percentage close to 100 means almost everything and percentage
close to 0 means almost nothing. In the class discussion, teacher also can ask
students whether they know the meaning of the symbol “%”.Having discussion
about the poster of percentage can probe students’ informal knowledge of
percentage.
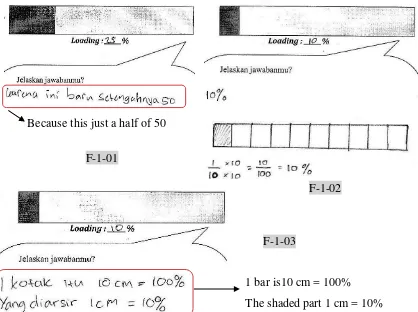
2.8.1.2 Constructing the meaning of percent
Goal: Students are able to construct the meaning of percent as “so many out of
Activity: Estimating loading process and shading loading bar
a. Students are asked to estimate how much the percentage of the loading process
in each loading bar below:
How much is the percentage of the loading bar in each picture? How do you
come to your answer?
b. Students are given three percentages of loading process (10%, 2%, 60%, and
98%), and students are asked to shade part of loading bar that is fully loaded.
Here students also have to explain their strategy in drawing the loading
process.
Description of the activity:
In this activity teacher asks students about their experience in playing game in
computer or play station or in working with computer. Then teacher asks students
whether they have seen loading bar in those kind of activities. To make clear
about how loading bar works, teacher will show loading bar in the computer and
display how it works. There are two different activities in this section.
First Activity
In the first activity, first teacher will display the loading bar and then pauses the
process of the loading in a certain moment. While the teacher displays the loading
Loading : ____% Loading : ____%
process, he/she hides the percentage. Here, teacher starts to have discussion with
the whole class in estimating the percentage of the loading process. In order to
give more opportunity for students in estimating the percentage of the loading
process, students are given a worksheet contain some pictures of loading process
and they have to estimate the percentage.
Second Activity
In the second activity, teacher only gives the percentage of the loading process
(10%, 2%, 60%, and 98%), and then he/she asks students to shade the part of the
loading bar that is fully loaded. In this activity, students are given a paper
containing blank bars so that they can work in the paper. The blank bars given are
presented in big size so that students can shade the part of loading bar that is fully
loaded as precise as possible.
In these activities, students work in group of four or five students.
Conjecture of students’ strategies:
First activity:
- Students might estimate the loading process by using their intuition. For
example they might estimate that the percentage of loading process from the
first loading process is around 25%. For students who give this answer, teacher
can provoke students by giving such question “How can you make your friends
sure that the percentage of the loading process is 20%?”.
- Students might measure the length of the bar and think of the order of number
- Students might use their known percentage to estimate the percentage of the
loading process. In the first loading process, they might recognize that the
percentage of the part that is fully loaded is a half of 50%.
Second activity:
- Students make guessing in drawing the loading process.
- Students think the order of the number 1 up to 100 and their position in the
loading bar.
- Students measure the picture of the blank bar and then divide it into 100 parts.
- Students might use their known percentage to shade the part of loading bar that
is fully loaded.
Class Discussion:
Since in the previous activities students have known many situations in
which percentage play role, here teacher introduces another use of percentage in
computer process, especially in loading process. In the beginning of activity,
teacher can asks students about their interpretation if the percentage in the loading
process is very small or otherwise very big close to 100%.
In this class discussion, the first discussion is about the way they estimate
the percentage of loading process. In estimating the percentage of loading process,
students might have different strategies and answer. They might use their intuition
or use their known percentage to estimate the percentage of the loading process.
The next discussion is about how they shade the part of loading bar that is
fully loaded if the percentage of loading process is given. This activity is the
this activity they have to imagine the situation and then draw the loading process.
In shading the loading bar, they are expected to see the relationship between the
given percentage and the percentage of the whole loading process (100%) and
also are expected to see that the loading bar actually consists of 100 parts, each
part represents 1%.
By discussing these activities, students also are expected to develop their
sense of the relative value of the part (loading process) compared to the whole. In
estimating loading process, relative size of the part is viewed as a sense of fullness
of loading process along the linear scale, with 0% means the loading process is
started and 100% means the loading process is finished.
Next Activity:
Activity: Estimating the area of fishpond
Teacher says the story about the area of his/her yard in his/her village.
Teacher says that in her/his village, he/she has a house with the total area of the
yard is 100 m2. Teacher says that 10 percent of the yard is used as fishpond. Teacher asks students to estimate the area of the fishpond.
The questions are: How much is the area used as fishpond? How do you come to
your answer?
Description of the activity:
Teacher tells the story about the area of the yard in her/his house and the
percentage of the area used as fishpond. Then teacher asks students to find the
area used as fishpond. In this activity, teacher asks students to make a drawing of
Conjecture of students’ strategy:
- Students might draw a representation of the yard and then divide it into ten
parts. After dividing, they conclude that one small part that has area 10 m2 represent the area of the fishpond.
- Students draw a representation of the yard and then divide it into or a hundred
parts. After dividing, they conclude that ten small parts that has area 10 m2 represent the area of the fishpond.
- Students directly divide the area of the yard (100 m2) by ten or by one hundred without making drawing.
Class Discussion:
In the mathematical congress of estimating loading process students have
already estimated the percentage in the loading process and discuss the meaning
of percent. This activity is designed to see whether they really know the meaning
of percent. In this activity, the discussion focuses on the way students estimate the
area of the fishpond. Students might come up with different strategies to solve it.
The meaning of percent can be explored by questions such as “Why do you divide
the area of the yard into ten? Why one small part represents 10%? or “Why do
you divide the area of the yard into a hundred parts? Why ten small parts
represent 10%?.
2.8.1.3 Working with benchmark percentage
Goal: Students are able to construct the meaning of percent as “so many out of
100” and they were able to use their previous knowledge about bar model as a
First Activity: Estimating field area The problem goes as follows:
Mr. Hadi has a field with the total area is 400 m2. He plans to plant rice in 75% of the field and the rest is used to plant corn. How much is the area used to plant
rice? How much is the area used to plant corn? How do you come to your answer?
Description of the activity:
Teacher tells story about a field of Mr. Hadi that is used to plant rice and corn.
After telling the story, then teacher asks students to find the area used to plant rice
and corn. In this activity, students will work in a group of four or five students.
Conjecture of students’ strategy:
Students’ strategies in finding the area used to plant rice:
- Students might draw the field in square or rectangle form and then divide it
into some parts. They might divide it into four, or ten, or hundred parts.
- Students will split 75% into 50% and 25%. First they determine 50% of 400 m2
then they continue to determine 25% of 400 m2. Students’ strategies in finding the area used to plant corn:
- Students will start with the percentage of area used to plant rice. Since 75% of
the field has already used to plant rice, then the area used to plant corn is 25%
(100% minus 75%). Then they will determine 25% of 400 m2 by making drawing of the field.
- After finding the area used to plant rice, students will directly find the area
used to plant corn by subtracting the total area of field by the area used to plant
Class Discussion:
Since in the previous activity students have already discussed the meaning
of percent, in this activity students are given opportunity to solve a percentage
problem to see whether they know the meaning of 75% of a certain amount. In
this activity, the given problem is about the area of field that is designed in
purpose to give students opportunity to make drawing as a representation of the
situation and to make connection with their previous activity.
In this activity, the discussion focuses on the way students estimate the area
used to plant rice and corn. Students might come up with different strategies to
solve it. In this activity, teacher can provoke students to recall their experience in
working with bar or drawing in the previous activity.
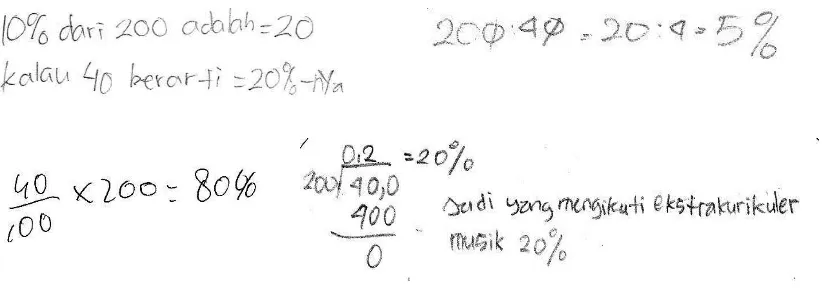
Second Activity: Estimating the number of students joining music extracurricular
Here is an announcement about music extracurricular in SD Harapan.
“In SD Harapan, the number of students in grade 5 and 6 is 200 students. From
200 students, 60% of the students join music extracurricular in the school.”
Here is conversation between two students that discuss about the announcement:
Rina : Hmm….I think there are many students in grade 5 and 6 interest in music
extracurricular. What do you think Budi?
Budi : Yeahh….I think so…
Rina : I think 120 students in grade 5 joining the music extracurricular.
Budi : I don’t think so… I think only 100 students joining the music
The question from this story is ‘Do you agree with Rina or Budi? If you agree
with Rina, how would you explain your argument to Budi? If you agree with
Budi, how would you explain your argument to Rina?’.
Description of the activity:
Teacher shows an announcement about the music extracurricular and then tells the
conversation between two students about the announcement. After telling the
story, teacher asks students’ opinion about the conversation. In this activity,
students discuss the problem in pairs.
Conjecture of students’ thinking:
- Students agree with Rina. They might argue that 60% of 200 students are more
than 120 students. It is because 100 students are 50% of 200 students.
- Students agree with Rina. They might argue that 60% of 200 students are same
with 50% of 200 students plus 10% of 200 students
In determining 50% of 200, they might come up with many strategies. They
will use halving or partitioning 200 into ten or hundred parts. In determining
10% of 200, they might use the result of 50% of 200 and then divide it by 5 so
that they get 10% of 200 or they recall their previous knowledge about finding
10% of 100 m2. They might divide 200 into ten or one hundred parts. After finding 50% of 200 and 10% of 200, they find that 60% of 200 is equal to 180.
- Students do not have idea about the problem. They confuse because they
cannot make a drawing as representation of the situation. Here the problem is
about the number of students and not about the area that can visualize in square
Class Discussion:
Since in the previous activity students have already worked with benchmark
percentages such as 50% and 25%, here students are given opportunity to solve a
percentage problem with other benchmark percentages. In this activity, students
are faced in the situation in which they cannot directly make visual representation
of the situation to solve the problem. Here, they have to recall their previous
knowledge about the meaning of percent and working with benchmark
percentage. The given problem is about the number of students joining music
extracurricular that is designed in purpose to give students opportunity to work
with percentage as relative value of the part compared to the whole in discrete
objects.
In this activity, the discussion focuses on students’ reasoning on why they
agree with Rina or Budi. Students might come up with different reasoning about
it. Teacher can provoke students by posing questions such as “How do you know
that 60% of 200 students are equal to 120 students? Could you make drawing of
your strategy?” . Through discussing the problem, students are expected to see
that percentage describes part whole relationship. By investigating the problem
students are also expected to consider that in determining the percentage of a
certain amount, they can use benchmark percentages to help them to estimate the
2.8.1.4 Constructing sense of percentage as a relative value
Goal: Students are able to recognize that percentages describe relative value of the part compare to the whole and percentages are always related to something (in
this problem percentages relates to prices).
Activity: Investigating discount problem The discount problem is given as follows:
Two department stores, Ramayana and Matahari, offer discount for their products.
Ramayana department store offer 30% discount for toys and Matahari department
store offer 40% discount for toys. If you want to buy toys, which store do you
prefer?
Description of the activity:
Teacher tells about two advertisements that he/she saw in newspaper. After telling
the advertisement, students are given the problem above and they have to discuss
the problem in a group of four or five students. When discussing the problem,
they have to make a poster describing their opinion and their reasoning.
Conjecture of students’ strategy:
- Students will prefer Matahari department store to buy toys because the
discount is bigger than in Ramayana so that the price will be cheaper.
For students who argue like this, teacher can give stimulating question such as
“How do you know that the price in Matahari department store is cheaper than
30%
in Ramayana while one thing that you know is only the discount?”. If students
still argue that the bigger the price the cheaper the price, teacher could ask
“How do you convince your friend that the price in Matahari department store
is cheaper than in Ramayana department store? Can you give an example of
one case?”. From these stimulating questions, it is expected that children will
consider that percentage are always related to something.
- Some students maybe will recognize that to determine the price in each
department store, one has to know the original price.
For students who have this opinion, teacher can ask such questions “How if the
prices are same?” or “How if the prices are not same?”. From the question, it is
expected that students will gain more insight that different reference will lead
to different result.
Class Discussion:
From the first activity of making poster, teacher recalls many uses of
percentage in daily life and discount context assumed as one of the most familiar
contexts for students. In this activity students are given a situation in which there
are two different discounts offered in two different stores. This discount context is
used to have students discuss what these advertisements really tell them.
In the class discussion, maybe almost all students will argue that Matahari
gives the best price because the amount of reduction is bigger. Here, teacher does
not ask for any argument first, but the teacher gives them opportunity to discuss in
groups why they think shopping at Matahari is better. After students give
“Are you sure? How do you convince your friend that your answer is true?”. In
the discussion teacher also give opportunity for students to discuss about the
possibilities of the original price of the toys.
In the case where the original prices are same, it is clear that the price in
Matahari is cheaper than in Ramayana. In the case where the original prices are
not same, there are many interesting things to discuss. The main discussion in this
case is about the reduced prices (absolute values) and the percentages (relative
values) that describe the relationship between the reduced prices with the original
prices.
Through this activity, students are expected to realize that percentages
describe relative value of the reduced price compare to the original price. Students
also expected to explore that percentages are always related to something (prices)
and cannot be compared without taking into account to what they refer because
reduction in percentage gives relative value, not an absolute value.
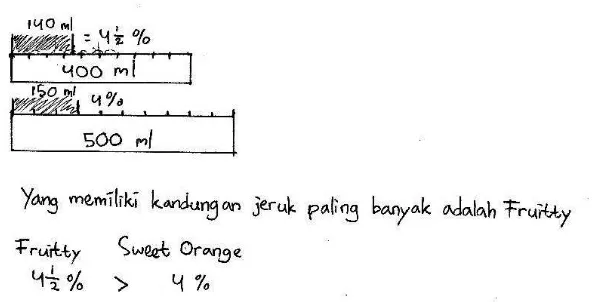
2.8.1.5 Using percentage in comparison problem
Goal: Students are able to use percentages in a situation in which percentages are needed; when different parts of different wholes have to be compared.
Activity: Ordering the sweetness of drinks
Syrup: 80 ml Syrup: 30 ml Syrup: 60 ml
(3)
300 ml
(2)
200 ml
(1)
Can you order those three drinks from the sweetest drink to the least sweet? To
make sure that your answer is true, how would you explain your answer to your
friends?
Description of the activity:
The activity uses three glasses having different volume of drink. Each drink
contains of different amount of syrup. In this activity, teacher asks students to
observe those drinks and report their observation data dealing with the volume of
drinks and syrup in those glasses. After the children observe those glasses, then
teacher asks students to order the sweetness of each drink. In this activity,
students work in group of 4 or five students.
Conjecture of students’ strategies:
- Some students maybe will order those drinks based on the volume of the syrup
without considering the volume of the drink. For students who give this
solution, teacher can pose stimulating question “How about the volume of the
drink? Does the volume of the drink not influence the sweetness of those
drinks?. From the question, it is expected that students will consider the
volume of the water in determining the sweetness of those drinks.
- Since the question is determining the sweetness of each drink, students may
think about the concentration of syrup in each glass. Students might draw the
glasses and then estimate the concentration of syrup in each glass by using
simple fraction.
In estimating the concentration of syrup, students will compare the volume of
that are difficult to compare. They find that the volume of syrup in the first
glass is 4/25 of the volume of the drink, the volume of syrup in the second
glass is 3/20 of the volume of the drink, and the volume of syrup in the third
glass is 1/5 of the volume of the drink.
For students who come to this answer, teacher can ask question “Why do you
get difficulties in comparing those fractions? Do you have idea how to make
those fractions become easy to compare?”. From the question, it is expected
that students will recognize that different denominators make those fractions
become difficult to compare so that they have to make it equal. In order to
make it become equal, those numbers are easy to compare in base of 100.
- Students might estimate the concentration of syrup in each glass by using
percentage. In estimating the percentage, they might use a bar like the bar in
the loading process problem. The example of their strategy goes as follows:
They might estimate that the volume of syrup in the first glass is 16% of the
volume of the drink. By using bar, they also find that that the volume of syrup
in the second glass is 15% of the volume of the drink and the volume of syrup
in the third glass is 20% of the volume of the drink. For students who give this
kind of solution, teacher can pose question “Why do you prefer percentage in
this problem?”. It is expected that students will consider that using percentage
Class Discussion:
In this activity, researcher expects the children to invent percentage as the
answer to a problem. The researcher place the children in situation in which
comparing proportion by using fraction makes things obscure. In this class
discussion, the first discussion is about the way students order those three drinks
from the sweetest to the least sweet. They might only determine the sweetness of
the drinks based on the volume of syrup or they compare the volume of the syrup
with the volume of the drink. If students only focus on the volume of syrup, it
means that they only look at the absolute amount of syrup without comparing to
the volume of water.
Next discussion is about how students order those three drinks from the
sweetest to the last one if they compare the volume of syrup with the volume of
the drink. Students might come up with different strategies to solve it. By
investigating the problem and discussing different strategies used by students,
students are expected to see that percentages make them easy to compare
proportions. The mathematical idea behind this activity is that percentage
describes relative value of the part compared to the whole and it can be used to
standardize different quantities so they can be compared directly.
2.8.1.6 Exploring percentage greater than 100
Goal: Students are able to extend their knowledge to percentage greater than 100 First Activity: Drawing a chocolate bar with 50% extra free
Teacher tells students about the advertisement that says ‘Now available a new