RELATION BETWEEN PORE MODEL AND CENTER-LINE TEMPERATURE
IN HIGH BURN-UP UO
2PELLET
Suwardi
Center for Nuclear Technology – National Nuclear Energy Agency BATAN PUSPIPTEK, Serpong, Banten-15310 Indonesia
Received 17 April 2007; Accepted 1 June 2007
ABSTRACT
Relation between pore model and center-line temperature of high burn up UO2 Pellet.Temperature distribution
has been evaluated by using different model of pore distribution. Typical data of power distribution and coolant data have been chosen in this study. Different core model and core distribution model have been studied for related temperature, in correlation with high burn up thermal properties. Finite element combined finite different adapted from Saturn-1 has been used for calculating the temperature distribution. The center-line temperature for different pore model and related discussion is presented.
Keywords: pore model, high burn up, UO2 pellet, centerline temperature.
INTRODUCTION
Indonesia operates 3 research reactors, all by Batan. First, a 2000 MW Triga Mark II that is an upgrade of 1000 MW TRIGA built in 60 decade. Second, a 250 kW TRIGA Type Reactor built in 70 decade. MPRR 30 MW Multi Purpose Research Reactor built in 80 decade. The activities of Nuclear fuel Development center has been focused in acquisition and development for production of MTR fuel. Capability to product NF for MTR RSG GAS has been improved from Aluminide to oxide to silicide fuel. DART Code from ANL has been used for evaluation new fuel.
Up to date no NPP has been operated in Indonesia. It had been planed to be built a first NPP in 90 decade. The plan of NPP introduction has been revised to become 2005. The revision has been revised again related to the severe monetary and economic crisis in last years of last millennium. The last study concludes that NPP must be introduced in 2016 to national energy system in 2016.
In the past, the burn-up of LWR fuel averaged about 33 MWD/kg. An increase to 100 MWD/kg is within technical reach, and even greater increases are potentially achievable. Increasing the burn-up to 100 MWD/kg would yield a threefold reduction in the volume of spent fuel to be stored, conditioned, packaged, transported, and disposed of per unit of electricity generated. The corresponding reduction in the required repository storage volume would be more modest; the individual fuel assemblies. A further benefit of higher burn-up is that the isotopic composition of the discharged plutonium would make it less suitable for use in nuclear explosives.
Properties of the High Burn-up Structure (HBS) at the pellet rim, its effect on thermal performance and fission gas release. A trend towards increasing the
discharge burnup of nuclear fuel has been a feature of the operation of all types of nuclear power plant for many years. The increase of fuel burnup, and a concurrent increase in fuel duty, has been implemented in response to the economic challenge to reduce costs associated with nuclear power. Increased dwell allows smaller fuel inventories, and reduced spent fuel arising, but there are also increased costs associated with high burnup, for example, increased enrichment and meeting new challenges to fuel integrity and performance. Increased burn-up has been achieved through continuous development of fuel materials, especially advanced cladding, careful and incremental experimentation, and improved understanding and modeling the fuel behavior.
The nuclear fuel is one of the key elements which have to be acted upon if utilities are to be helped to fulfill their mission of generating power in total safety and supplying the kWh to their customers at the best price [Witteau]
In order to determine the most economic level of burn-on discharge of nuclear fuel, that means a demand on in-reactor nuclear fuel analysis is needed. With increasing burn-up of light water reactor (LWR) fuels, it becomes more important to estimate the irradiation behavior of the fuel pellets under high burn-up. Thermal conductivity of fuel pellets is one of the most important thermal properties for calculating the fuel temperature during irradiation.
This parametric study is done in relation to NPP introduction. Hereinafter have been selected FEMAXI to be used as evaluation BB PLTN. The paper presents a study about the effect of pore distribution at high burn-up on fuel temperature. The temperature distribution has been obtained by applying a simple model of steady-state heat transfer of fuel rod at particular level of high burn-up. Calculation has been
* Email: [email protected]
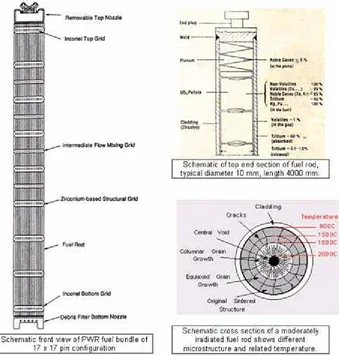
Fig 1. Diagram of typical PWR Fuel (a) Fuel bundle of 17 x 17 rods configuration, (b) Longitudinal section of top end rod, and (c) Different Radial Zones of irradiated microstructure and duty temperature
done by typical models of pore distribution and gap conductance at high burn-up. The model takes into account thermal properties dependent of pellet to temperature, pore, and burn-up.
METHOD
The thermal conductivity changes of irradiated UO2 and (U, Gd)O2 pellets may be related to different phenomena such irradiation-induced point defects, fission products and irradiation-induced micro bubbles. The degradation of thermal conductivity related to high burnup has long been studied, but still all be fully understood. The formation of HBS (rim structure at high burnup) that contains more pore has been studied for long time.
In this study some models of relation between porosity and temperature to thermal conductivity of irradiated UO2 fuel has been chosen to calculate the temperature distribution in the fuel rod when pore distribution is given.
The temperature distribution has been obtained by
applying a simple model of steady-state heat transfer of fuel rod at particular level of high burn-up. Calculation has been done by typical models of pore distribution and gap conductance at high burn-up. The model takes into account thermal properties dependent of pellet to temperature, pore, and burn-up. The procedure evolves the following steps.
Choice pore distribution at high burn-up, model pore and temperatue dependent of pellet conductivity, and temperature on cladding thermal conductivity. Pore contribution is modeled as factor to pellet thermal conductivity, computes coolant water temperature along rod side related to the the model of axial power distribution that is considered as cosines type. The cladding surface to water coolant heat transfer is calculated according to simplified model of Dittus-Boelter. The temperature of cladding surface is determides without taken into account thermal conductivity of CRUD. The gap conductance is calculated as given parameter. The radial power distribution is modeled as a linear combination function, fitted from typical density from experimental data. Rod
heat transfer in the axial direction is omitted. Heat transfer equation in the fuel pellet is approached by a combination of finite element and finite differences Saturn-FS1 [2].
Pore distribution.
Pore distribution is obtained by linear combination fitting an experimental data, and modification for this parametric study.
(1)
A modified expression for this study for example :
(2)
Pore and thermalconductivity.
Two models of thermal conductivity of irradiated fuel is applied:
a. Correction factor for fuel pore that is modeled as pure pore variable of
(3)
b. Correction factor of pore that depends on pore and a coefficient depending temperature. The measured thermal conductivities were normalized to the values of 96.5%TD (TD: theoretical density) by using the Loeb's equation:
λn=λm(1-0.035ε)/(1-εP), (4)
where: λn is the thermal conductivity normalized to that of 96.5%TD; λm, the measured thermal conductivity; ε, the parameter which express the effect of pore shape on the thermal conductivity of pellets; and P, the porosity evaluated from the sample density. The parameter ε is expressed as follows [3]:
ε = 2.6-5×10⁻⁴(T(K)-273.15), (5) Washington [4.1], F, pore factor
F
=
1
.
0
−
2
.
5
⋅
P
; P = 1 – TD (6) The last two models may be unified as correction factor of WaisenakFp = (1-β.P) / (1-0.05*β)
β =2.58 0.58 10 .− × −3T T=Tc (7) K=K95%TD⋅ −(1 βp) /(1 0.05− ⋅β) (W mK/ ) (8)
MatPro v 9.0 model of temperature dependent of thermal conductivity of fresh/un-irradiated UO2 fuel has been choosed.
The computation and results visualization are performed within MathCAD environment. The equations presented here are MathCAD format, and there is a slight difference with conventionally mathematical expression.
Coolant temperature along the channel
The surface temperature Ts at each axial location of the fuel rod is the starting point for calculation of the radial temperature distribution of related z position. The flowing coolant temperature is calculated from the energy balance of fuel and coolant system, local and total along the fuel rod.
+ =
Qmw is mass flow rate of coolant, cpw is the heat capacity of the coolant - temperature dependent, Tcool is coolant temperature and Tin is inlet coolant temperature. The parameter ty represent reactor type, 1 for LWR and 2 for PWR. The linear power, qr(z), is position dependent as follow [2]:
π π Where q0 is Linear Heat Generation Rate and L is fuel rod length.
Cladding Surface Temperature
In the analysis a single-phase heat transfer model simplifies the heat transfer coefficient of cladding surface. The Dittus-Boelter equation for heat transfer coefficient
is reduced by choosing the right hand side with the mean value, except the coolant thermal conductivity.
The surface temperature of cladding in z position (Tcl(z)) is then calculated, knowing the linear power qr(z) and the convective heat transfer coefficient (hw)
π
Radial Distribution of Cladding Temperature
Discretization of cladding, using the term of cladding radius (rc), nc = number of cladding segment, Rci, inner cladding radius and Rco for outer cladding radius.
The range of cladding radius rc is: −
The cladding temperature is calculated from the energy balance around the cladding. The balance around a slice of cladding ring, omitting the cladding water side corrosion, can be arranged as:
)
Tc(rc) is temperature of cladding at rc. Tc(Rco) is the temperature of outer cladding. λcl stands for thermal conductivity of cladding. Iteration is needed since the equation contains an implicit variable.
The difference between inner and outer cladding surfaces is:
At this point the temperature of flowing coolant to the inner surface of cladding is known.
The outer surface of fuel pellet than is calculated using a simplified input of gap conductance. It is assumed that the gap distance is not change by difference temperature distribution caused be non-heterogeneity of power:
Radial Distribution of Fuel Temperature and Porosity
The heat transfer from pellet surface to the inner surface of cladding is calculated using a simplified correlation of gap conductance as a temperature function.
The radial temperature gradient is assumed higher than it’s axial; the axial heat transfer is neglected. The energy balance in the fuel contains a power density term that depend on the corresponding radius,
λ π The (qv(r)) is volumetric power density profile according to radial coordinate, be modeled as polynomial eq.10 that is fit of typical power distribution.
qv(r) = p . v(r) (20) For high burn-up the polynomial is expressed by eq.-11.,
⎛ ⎞
The correlation between linear power density / LHGR qr(r) and volumetric power density qv(r) is:
π
=
∫
( ) 2. . . ( ).
qr r r qv r dr (22)
A finite element approach is applied for the radial distribution of fuel temperature.
The radial space is discretized into nr element of linear lagrangian type. Fuel temperature in each element is defined as:
+ + Tk, and Tk+1, is temperature at corresponding nodal coordinate (Kr, rk+1) with global numbering.
The qr is power (thermal) generated by cylindrical fuel with radius = r per unit length. qr is given as a polynomial of r variable obtained from fitting the curve of SATURN-FS1 figure.
If p represents volumetric density of power at radius r, with eq-14:
( )
+ +(
Qv (=average power generated per unit volume) can be calculated with equation 15. Here q0 is qr at pellet surface, that is LHG (Linear Heat Generation)π Introducing 3 new variables Ai, Bi, and R as follow:
( ) ( )
The volumetric power generation can be written as:
qrk = p R Qv ( Bk pk + Ak+1 pk) (29) By using finite different approach, the energy balance eq-13 becomes:
Tk is fuel temperature at node k. it can be written explicitly.
(
)
Substitution of qr in equation-19 in equation-21 and using variables Qv in equation -15, while A (equation 16), B (equation-22) and new variables F, G, AA, BB as equation-23 to equation-26 below:
(
)
Then the eq-21 can be rewritten as eq-37:
( ) correction factors. For this analysis they are sufficiently set as 1.0.
Now the radial temperature distribution of z position is established. For other z coordinate the different in qr and Tcool. Tcool(z) has been calculated in eq-1. Linear heat generation (qr at radial position R) for different Z is LHGR multiplied by the axial power-factor.
Repeating the radial distribution for all axial position using corresponding coolant temperature in eq-1, and volumetric heat generation eq-10 the temperature distribution in 2-dimensional space is calculated.
Comparing the temperature distribution does the analysis and the corresponding thermal property calculated by different heterogeneity of power density in radial or in axial direction.
RESULTS AND DISCUSION
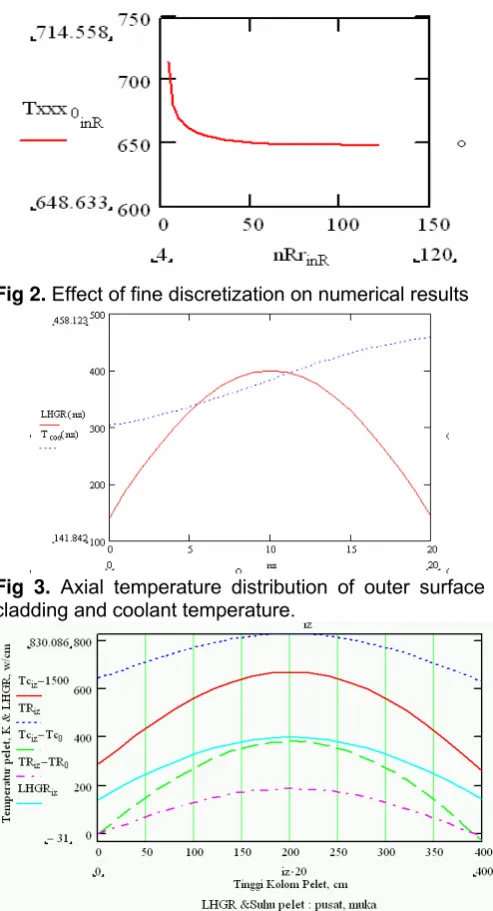
Fig 2 shows the temperature obtained by different number of radial discretization of pellet. About 25 or more radial elements is needed for accurate numerical results. Fig 3 shows the axial temperature distribution of outer surface cladding and coolant temperature. The profile of pin temperature is nearly cosine type caused by axial profile of LHGR. The coolant temperature rise as it cooling the fuel pin.
Fig 2. Effect of fine discretization on numerical results
Fig 3. Axial temperature distribution of outer surface cladding and coolant temperature.
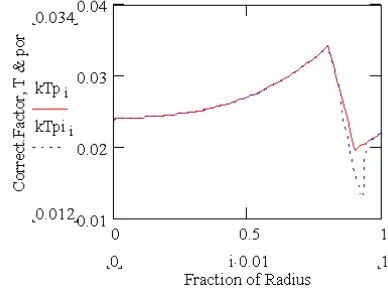
Fig 4. Axial distribution of different temperature and linear heat generation rate (Tc – center line, TR Surface pellet, LHGR-Linear Hear Gneration Ratein w/cm)
Fig 4 shows multi plots of temperatures in K and LHGR in w/cm along the fuel pin of 400 cm. Tc – 1500 is the center line temperature – 1500K, TR is the temperature of pellet surface. Tc-Tc0 represents the temperature of center line minus the center line temperature at inlet coolant. TR-TR0 is the surface temperature minus the surface temperature at inlet of coolant. LHGR is the acronym of linear heat generation rate, expressed in w/cm and it’s profile is modelled as cosine type.
Fig 5. Two models of radial pore distribtions
Fig 6. Model of pore effect on termal conductivity
Fig 5 shows two models of pore distribution at high burnup, one is developped from experimental data, and other is modified distribution. The rim is about 3 time more poreous than the rest Fig 6 shows the model of temperature effect on termal conductivity, is part two of eq-9. The conductivity drop as pore increase. Fig 7 shows the radial distribution of correction factor related to the pore pore distributions. Fig 8 shows the effect of radial temperature distribution on termal conductivity. As expressed by second parenthesis of eq-9. Fig 9 shows 3 different Corection factor distribution of thermal conductivity resulted from 3 models of pore effect, equations 3, 6, and 7. The effect rise gradually according to radial position until it approach the HBS that suddenly falls to the minimum value, and then rise again as temperature decrease radially.
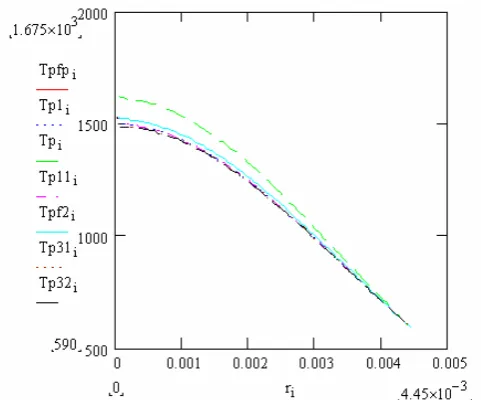
From 3 different pore distribution and 2 different pore correction factor resulted 6 profiles of pore correction factor. An average of fist profile of correction factor has also been used to calculated the temperature distributionin radial direction. The result is plotted in. Fig.10. The plot shows radial distribution of pellet temperature of different pore distribution. Tp is calculated by radial average of pore correction factor. Tp1 and Tp11 use different modle of core correction
Fig 7. Effect of radial pore distribution on termal conductivity
Fig 8. Combination of pore and temperature correction factor of thermal conductivity along pellet radius.
Fig 9. Corection factor distribution of thermal
conductivity resulted from 3 models of pore effect
factor, Tpfp, Tpf2, different models of pore correction factor Tp31, Tp32. The temperature profile calculated by using average correction factor give a maximum deviation from the average, that is can be anticipated of not using the local correction factor. The results from two different model of correction factors hardly differentiable. The two models give a same numerical results. A little different of pore distribution results a clear different temperature distribution (Tpf to Tp).
Fig 10. Radial distribution of temperature predicted from different pore distribution. Tp is calculated by factor of average pore)
CONCLUSION
A simple, steady state bi-dimensional axial symmetry model with a combination finite element-finite different approach has been used to study the relation between model of pore contribution to temperature distribution especially to centerline temperature. The model takes into account porosity and temperature for thermal conductivity and power density profile.
Calculation using mean Correct.Factor not local correction factor along diameter : resulting overestimation 90 K of central line temperature.
The two models corelation of Correct.Factor as function of pore and temperature resulting no significant different on resulted temperature.
Pore distribution need to be expressed well especially related to HBS to give accurate results of the central line temperature of pellet.
ACKNOWLEDGEMENTS
The author would like to thank Mr. John Killeen, Division of Nuclear Fuel Cycle and Waste Technology, Nuclear Fuel Cycle and Materials Section - IAEA, for granting financial support for this study.
REFERENCES
1. Ritzhaupt, H.J., 1993, Saturn=FS 1 A computer code for Thermo-mechanical Fuel Rod Analysis, Kernforschungszentrum Karlsruhe
2. INSC-ANL, UO2 properties, http: //
www.insc.anl.gov /matprop/uo2, July 1998
3. Olander, D.R., 1976, Fundamental aspects of Nuclear Reactor Fuel Elements, En.R&D Admin. 4. El-Wakil, W.W., 1985, Nuclear Heat Transport,
International Textbooks Co.,
5. Watteau, M., 1998, Framatome ANP Extended Burn-up Experience and Views on LWR Fuels. Proc. Conf. LWR Fuel Perfor-mance & Modeling, IWG