59
Aceh International Journal of Science and Technology
ISSN: 2088-9860 eISSN: 2503-2348
Journal homepage: http://jurnal.unsyiah.ac.id/aijst
The quantification of adulteration in arabica coffee using UV-visible
spectroscopy in combination with two different PLS regressions
Diding Suhandy
1*, Meinilwita Yulia
21 Department of Agricultural Engineering, Faculty of Agriculture, The University of Lampung, Jl. Prof.
Dr. Soemantri Brojonegoro No.1 Bandar Lampung 35145, Lampung, Indonesia
2 Department of Agricultural Technology, Lampung State Polytechnic, Jl. Soekarno Hatta No. 10,
Rajabasa Bandar Lampung, Indonesia method becomes very difficult. For this reason, in this research we propose a new analytical method based on UV-visible spectroscopy for quantification of adulteration in arabica-robusta coffee blend. The proposed method is easy to use, low cost with affordable spectrometer and safe for environment with free-chemical analysis. A number of 100 samples was used as samples with different degree of adulteration (10-60% of robusta concentration in arabica-robusta coffee blend). Spectral data of aqueous samples was obtained using a UV-visible spectroscopy in the range 200-400 nm. The result shows that calibration model using selected subintervals (iPLS model) can improve the prediction performance of calibration model using full spectrum (FS-PLS). It is noted that iPLS model removed wavelengths that is not related to the quantification of adulteration in arabica-robusta coffee blend. This study has shown a potential application of using UV-visible spectroscopy for simple and low cost tool to detect the authentication of arabica coffees. characteristics and physicochemical composition, but also in terms of commercial value, with arabica coffees commanding market prices 20–25% higher and being considered to be of better quality than robusta because of their superior taste and aroma.
Recently, food authentication is a major challenge that has become increasingly important due to the drive to guarantee the actual origin of a product and for determining whether it has been adulterated with
contaminants or filled out with cheaper ingredients (Ashurst and Dennis, 1996; Singhal et al., 1997). In
60
depending on a wide range of factors, including coffee varietal and geographic origin. Therefore, suitable methods are required in order to discriminate between coffee varieties and to detect potential adulterations of high quality coffee beans with poorer and cheaper types, thus ensuring authenticity, quality, safety and efficacy of final products to be commercialized.
Several researches have reported the development of reliable and specific coffee authentication techniques. Many of the recently developed approaches for determining coffee authenticity have focused mainly on coffee identification and classification on the basis of different types of compositional data (Bicchi et al., 1997; Briandet et al., 1996a; Briandet et al., 1996b). Despite the relative success achieved by many of these approaches, it is important to consider that most of these methods have several drawbacks. Most of them use quite expensive solvent and need precise sample extraction (elaborate and/or time-consuming). For this reason, simpler, faster and chemical free methods, such as those based on spectroscopic techniques which can be easily implemented in routine analysis, have emerged as a very attractive and useful alternative tool for adulteration identification purposes in several products (Briandet et al., 1996a; Briandet et al., 1996b; Souto et al., 2015; Alamprese et al., 2013; Diniz et al., 2016; Domingues et al., 2014; Aroca-Santos et al., 2016; Biswas et al., 2011). The use of human sensory assessment by skillful
tasters for coffee quality evaluation is impartial and unreliable (Tavares et al., 2012). Near infrared
spectroscopy, mid infrared spectroscopy, gas chromatography–mass spectrometry and high performance liquid chromatography (HPLC) have been used for quality control, classification and authentication of coffee samples. However, most of these instrumental techniques require harmful reagents and/or
expensive equipment with large operational/maintenance costs (Souto et al., 2010). In this context,
ultraviolet and visible (UV-VIS) spectroscopy would be a simpler and less costly alternative.
Recently, UV–VIS spectroscopy has been applied to the detection and quantification of coffee adulteration (Souto et al., 2015; Souto et al., 2010; Suhandy et al., 2016a; Yulia et al., 2016). In the literature, to the best knowledge of the authors, there is no any reports on the use of UV-VIS spectroscopy for quality evaluation and authentication of arabica coffee. Furthermore, there is no any reports on the evaluation of different PLS regression for quality evaluation of arabica coffee. Therefore, in this research, we investigate the potential application of using UV-VIS spectroscopy combined with two different PLS regressions to detect and quantify the adulteration in arabica coffee samples.
A number of 1 kg ground roasted arabica coffee samples were collected directly from coffee farmers at Liwa, Lampung, Indonesia (Hasti coffee Lampung). Another 1 kg ground roasted robusta coffee samples were also provided for making arabica coffee adulteration. All coffee samples were grinded using home-coffee-grinder (Sayota). Since that particle sizes in coffee powder has significant influence to spectral analysis, it is important to use same particle size in coffee powder samples (Suhandy et al., 2016b).
In this research we use particle size of 420 µm by sieving through a nest of U. S. standard sieves (Mesh
number of 40) on a Meinzer II sieve shaker (CSC Scientific Company, Inc. USA) for 10 minutes. The experiments were performed at room temperature (around 27-29°C).
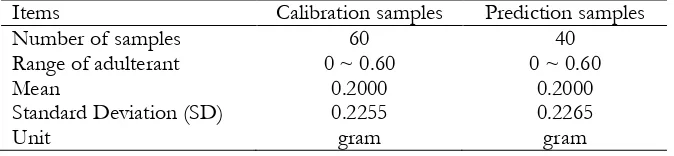
In this research we prepare 100 samples of coffee samples which consist of two groups, adulterated and non-adulterated samples. Adulterated samples have 50 samples of arabica coffee with adulteration (adulterated with robusta coffee in the range of adulteration 10-60%). Non-adulterated samples have 50 samples without adulteration (pure arabica coffee with 0% of robusta coffee). To develop and evaluate calibration model for quantification of concentration of robusta in arabica-robusta coffee blend, the samples were randomly divided into two groups, calibration and prediction samples set, respectively (Table 1).
Table 1 Sample Characteristics of Calibration and Prediction Set with Different Concentration of Adulterant (Robusta Coffee) in Arabica-Robusta Coffee Blend
90-61
98°C then mixed with magnetic stirring (Cimarec™ Stirrers, model S130810-33, Barnstead International, USA) at 350 rpm for 5 min. Then the samples were filtered using a 25 mm pore-sized quantitative filter paper coupled with an erlenmeyer. After cooling process to room temperature (for 20 min), all extracts were then diluted in the proportion of 1:20 (mL: mL) with distilled water.
Instrumentation and Spectra Data Acquisition
VIS spectra from the aqueous extracts were acquired in the range of 200-400 nm by using a UV-VIS spectrometer (Genesys™ 10S UV-Vis, Thermo Scientific, USA) equipped with a quartz cell with optical path of 10 mm, and spectral resolution of 1 nm at a room temperature. This is a dual-beam spectrometer which utilizes a high-intensity xenon lamp as light source and dual Silicon Photodiodes as detector. Before the measurements step, blank (the same distilled water used in extraction process) was placed inside of the sample cell to adjust the 100% transmittance signal.
Data Analysis Using Multivariate Methods
All recorded spectra data were transferred to computer via USB flash disk and then convert the spectra data from .csv extension into an excel data (.xls). All spectra then smoothed using Savitzky-Golay algorithm with 11 windows and was followed by applying multiplicative scatter correction (MSC).
For calibration model, two different calibration models were developed using PLS regression. First, we develop a calibration model using all spectral data (200-400 nm) and it was called as full spectrum PLS regression (FS-PLS). In the second calibration model, the full spectrum (200-400 nm) was divided into 10 equidistant subintervals. Then the PLS regression was developed for each subinterval. The PLS calibration model was performed with commercial multivariate analysis software; The Unscrambler® version 9.8 (CAMO, Oslo, Norway). For each subinterval, root mean square error of calibration (RMSEC) and the RMSECV value were calculated. For the iPLS calibration model, the calibration and validation was developed on the selected subintervals. The average RMSECV of a subinterval was used as threshold value for selection of appropriate subintervals (Suhandy et al., 2013). Only subintervals which had a lower RMSECV than the threshold value were selected for the iPLS regression model.
Principal component analysis (PCA) (Jolliffe and Cadima, 2016) was also applied to evaluate the possibility of UV-Visible spectroscopy to discriminate between the adulterated and non-adulterated ground coffee samples. The state of adulteration is calculated by determining the concentration of robusta coffee in arabica-robusta coffee blend. The calibration model was modelled from the UV-visible spectra with partial least squares (PLS) regression (full and interval PLS) using calibration sample set. The optimal number of latent variables for each model was estimated with the full cross-validation method (Tormod et al., 2002).
To assess the performance of PLS model in predicting concentration of adulterant (robusta concentration in arabica-robusta coffee blend), the root mean square error of cross-validation (RMSECV) was calculated according to the following equation (Santos et al., 2012).
(1)
In Eq. (1), �!",! is the model estimate for sample i based on a model calibrated without sample i
deleted and N is the number of samples. The model error for unknown samples (prediction sample set) was estimated in terms of the root mean square error of prediction (RMSEP).
(2)
Where, �! is the estimate for �! for the ith test sample and �! is the number of samples in the
prediction set.
62
and minimum value) in reference values of the prediction samples divided by the RMSEP. The higher the RER the more precise is the model. For example, RER more than ten means that the standard error of the model response is less than one tenth of the range (Jolliffe and Cadima, 2016). The high value of the RPD indicated the great ability of the models to predict the chemical composition accurately in samples outside the calibration set. It is generally acknowledged that, an RPD value higher than three is
recommended for screening purposes (Lorenzo et al., 2009) while RPD value higher than five is
considered suitable for quality control (Lorenzo et al., 2009). However, some authors give a more
qualitative interpretation for the RPD, where a RPD value lower than 1.5 was considered inadequate for most applications while calibration models with RPD greater than 2 were deemed excellent (Fearn, 2002). The equation for RPD and RER are (Yulia et al., 2014):
(3)
(4)
Results and Discussion
Analysis of Spectral Data in Ultraviolet-Visible Range (200-400 nm)
Figure 1 (left side) shows the spectral data of adulterated (dashed line) and non-adulterated (solid line) coffee samples. It looks that the spectral data overlap and contain much scattering information which is not related to the target response (robusta concentration in arabica-robusta blend) especially at wavelength 270 nm. The possible source for this scattering is mainly due to variability related to sample preparation
(Shan et al., 2014; Pasikatan et al., 2001)(mainly grinding of the raw materials, weighing of the coffee
samples and mixing between arabica and robusta coffee). Before developing PLS regression, it is necessary to apply some pre-processing method to remove those scattering information. For this purpose, here we apply smoothing method (Savitzky-Golay with 11 windows) and it was followed by applying multiplicative scatter correction (MSC) method. The result is depicted in Figure 1 (right side).
Figure 1. Original spectra (left) and pre-processed spectra (right) of coffee samples.
PCA Result on All Samples
63
samples with low degree of adulteration contains more arabica concentration and it is considered
to be similar with pure arabica samples (non-adulterated samples).
Figure 2. PCA result of coffee samples using pre-processed spectra in the range 200-400 nm.
Developing Calibration Model for Adulteration Quantification Using FS-PLS and iPLS Regression
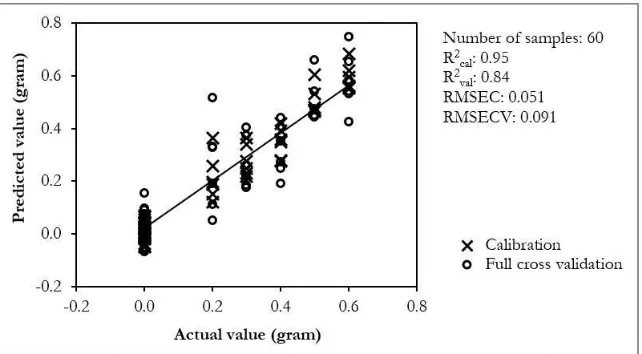
Using the full spectrum (200 - 400 nm), a calibration model was developed using PLS regression based on pre-processed spectra. Figure 3 shows the calibration and validation results for determination of robusta concentration in arabica-robusta coffee blend using FS-PLS regression. The calibration has high coefficient determination (0.95) with low error in validation (RMSECV=0.091). This FS-PLS calibration model has 10 latent variables (LVs).
Figure 3. Calibration and validation result for determination of robusta concentration in arabica-robusta coffee blend using FS-PLS regression.
64
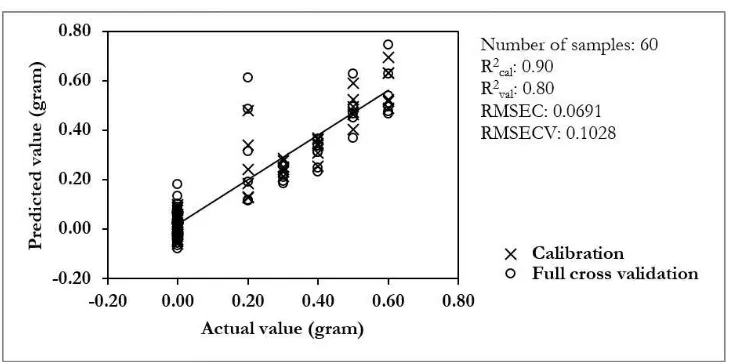
Figure 5. Calibration and validation result for determination of robusta concentration in arabica-robusta coffee blend using iPLS regression.
To develop interval PLS calibration model, we have to select appropriate intervals. For this, the RMSECV was plotted for the 10 subintervals (Figure 4). RMSECV is mainly used to compare the prediction performance of iPLS and FS-PLS calibration models (Pedersen et al., 2003). In this study, the average value of RMSECV was used as a threshold for subinterval selection. Subintervals which had a lower RMSECV than the threshold will be selected for development of the iPLS regression model. As seen in Figure 4, subintervals 3, 4, 5, 6, and 9 have a lower or a similar value of RMSECV to that of the threshold value. For this reason, these subintervals were selected for the iPLS calibration model. Using the selected subintervals an iPLS calibration model was developed and depicted in Figure 5.
Evaluating the Prediction Performance of FS-PLS and iPLS Regression Model
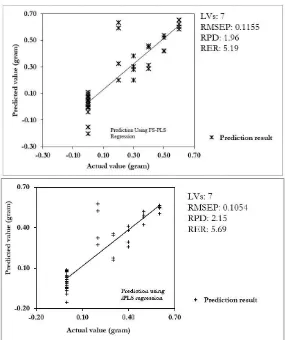
In order to evaluate the performance of the developed FS-PLS and iPLS regression model, the model was used to predict concentration of robusta in arabica-robusta coffee blend (in the range of 0-60%) using unknown samples (prediction sample set). The result was demonstrated in Figure 6. It can be seen that both FS-PLS and iPLS model resulted in a comparable result with iPLS is better than FS-PLS in term of RPD and RER values. It seems that selection of subintervals in iPLS model has removed wavelengths that is not related to the quantification of adulteration in arabica-robusta coffee blend. In spite of that RER value are still not yet satisfactory, prediction performance using iPLS model is excellent with RPD is more than two (Lorenzo et al., 2009).
Our result was comparable to other spectroscopic method in quantification adulteration in coffee. For
example, the adulteration of C. arabica blends with the C. robusta variety using near-infrared spectroscopy
(NIRS) combined with multivariate calibration methods has been conducted (Pizarro et al., 2007). The
calibration model developed after preprocessing derivative spectra using OWAVEC resulted in RMSEP = 0.79%. Other study used mid-infrared spectroscopy to distinguish 13 coffee blends containing different percentages (0.5 to 30%) of coffee husks. Samples adulterated with husks were identified by PCA, and quantitative estimation of adulteration was achieved by PLS regression (Tavares et al., 2012).
65
Figure 6. Scatter plot of actual vs. predicted concentration of robusta in arabica-robusta coffee blend calculated using FS-PLS (upper) and iPLS calibration model (lower).
Conclusion
By use of UV-VIS spectroscopy it has been possible to successfully quantify the concentration of adulterant (robusta coffee added into arabica coffee) in arabica-robusta coffee blend. Two different PLS models, FS-PLS and iPLS, were developed and tested with RPD and RER is higher in iPLS model. Using the iPLS model with the selected subintervals, the prediction of robusta coffee concentrations (as adulterant in arabica coffee) can be optimized; RPD was improved from 1.96 to 2.15.
Acknowledgement
The authors acknowledge financial support from the Indonesian Ministry of Research, Technology and Higher Education (KEMENRISTEKDIKTI) via Penelitian Strategis Nasional 2016 (No: 419/UN26/8/LPPM/2016). We thank to the Department of Agricultural Engineering, The University of Lampung for their permission to use their facilities for spectral data acquisition and Hasti Coffee Lampung for the supply of authenticated coffee samples.
References