Plant Communities, Soil Carbon, and Soil Nitrogen Properties
in a Successional Gradient of Sub-Alpine Meadows on the Eastern
Tibetan Plateau of China
Wen-Jin LiÆJin-Hua LiÆ Johannes M. H. KnopsÆ Gang WangÆJu-Jie JiaÆYan-Yan Qin
Received: 29 February 2008 / Accepted: 26 July 2009 / Published online: 25 August 2009 ÓSpringer Science+Business Media, LLC 2009
Abstract To assess the recovery trajectory and self-maintenance of restored ecosystems, a successional gradi-ent (1, 3, 5, 15, and 30 years after abandonmgradi-ent) was established in a sub-alpine meadow of the eastern Tibetan Plateau in China. Plant communities and soil carbon and nitrogen properties were investigated and analyzed. Regression analyses were used to assess the models (linear or quadratic) relating measures of species richness, soil carbon and nitrogen properties to fallow time. We found that species richness (S) increased over the first 20 years but decreased thereafter, and aboveground biomass showed a linear increase along the fallow time gradient. The rich-ness of different functional groups (forb, grass and legume) changed little along the fallow time gradient, but their corresponding above ground biomass showed the U-shaped, humped or linear pattern. Soil microbial carbon (MBC) and nitrogen (MBN) in the upper 20 cm showed a U-shaped pattern along the fallow time gradient. However, soil organic carbon (Corg) and total nitrogen (TN) in the
soil at depth greater than 20 cm showed significant patterns of linear decline along the fallow time gradient. The threshold models of species richness reflected best the recovery over the 15 year fallow period. These results indicated that fallow time had a greater influence on development of the plant community than soil processes in
abandoned fields in sub-alpine meadow ecosystem. These results also suggested that although the succession process did not significantly increase soil C, an increase in microbial biomass at the latter stage of succession could promote the decomposability of plant litter. Therefore, abandoned fields in sub-alpine meadow ecosystem may have a high resilience and strong rehabilitating capability under natural recovery condition.
Keywords Fallow time gradientSpecies richness Soil carbonSoil nitrogen Sub-alpine meadow
Introduction
Many grasslands worldwide are degraded through over-grazing, lowering their productivity and resilience (Li and Zhou 1998; Landsberg and others 1999). Within the Tibetan plateau of China, overgrazing has degraded 42.51 million ha and severely degraded 7.03 million ha of grasslands (Wang 1997). Therefore, developing rehabili-tation strategies for severely degraded grasslands is important. Degraded grasslands may have a capacity for self-recovery if the disturbance is ceased for an extended time and undergo a natural succession. Several studies have documented that such as cessation of disturbance results in a natural succession and that this has the potential to be a successful conservation strategy that restores the diversity, functioning and resilience in degraded grasslands world-wide (Burel and Baundry 1995; Jordan and others 1988; Palik and others2000).
Restoration studies have traditionally determined the rate and direction of secondary succession of plant communities (Pickett 1982; Asefa and others 2003; Abebe and others
2006; Ruprecht2006). Studies of succession in abandoned W.-J. LiJ.-H. Li (&)G. WangJ.-J. JiaY.-Y. Qin
Key Laboratory of Arid and Grassland Agroecology, Lanzhou University, Lanzhou 730000, People’s Republic of China e-mail: [email protected]
W.-J. Li
e-mail: [email protected]
J. M. H. Knops
fields have shown different patterns for the vegetation and soil carbon and nitrogen pools. Several studies have shown a linear positive increase in plant diversity with time indi-cating that plant species diversity may recover over periods of less than 10 years after abandonment of disturbance (Abebe and others2006). However, other studies showed that the restoration of plant species diversity in response to fallow time is ‘humped-back model’ (Peet and Christensen
1978; Asefa and others 2003). In contrast to vegetation changes, most studies have shown that soil does not improve significantly over time periods less than 10 years (Odum 1960; Aweto 1981; Odum and others 1984; Lee
2002), and that soil improves only over much longer periods (Aweto1981; Juo and Lal1977; Hamburg1984; Robertson and Vitousek1981; Landgraf and others2003; Knops and Tilman2000; Brye and Kucharik2003). However, to gain a better understanding of ecosystem changes of fallow lands it might be essential to study vegetation and soil changes simultaneously (Potthoff and others 2005), because both vegetation and soil changes are associated with an increase in below-ground plant biomass (Potthoff and others2005). Ecological restoration procedures can directly affect both vegetation and ecosystem functions such as nutrient cycling and carbon (C) accrual (Cione and others2002; De Deyn and others 2003). However, how vegetation and soil recovery are linked in restored ecosystems is unclear (Pal-mer and others 1997). Understanding the relationships among plant species diversity, plant productivity and resource availability in restored ecosystems are important to the management, preservation, and restoration of native communities and may also be key for successfully restoring species-rich ecosystem.
We used a chronosequence of successional fields and studied both the vegetation and soil changes during sec-ondary succession in a sub-alpine meadow region with the goal of determining appropriate management activities to restore plant diversity, increase plant cover, biomass and increase soil fertility. We evaluated the vegetation structure, species diversity, and ecological processes in order to determine the recovery trajectory and self-maintenance of a restored sub-alpine meadow ecosystems. We used a chronosequence with space-for-time substitutions that may allow us to forecast recovery trajectories of plant and soil parameters. If consistent patterns of vegetation and soil change exist along successional gradient, using a fallow period could be a useful strategy and a major step forward in providing a way for managers and policy-makers to develop a sustainable management of these sub-alpine meadow ecosystems. The major objectives of this study were: (1) to quantify species richness over time under natural recovery conditions; (2) to examine whether different functional group (forbs, grasses and legumes) showed different recovery trajectories; and (3) to examine if soil carbon and
nitrogen properties were correlated with plant changes over time. We propose the following specific hypothesis:
(1) Plant diversity and functional group and their corre-sponding biomass increase during a fallow period because of the cessation of grazing.
(2) The humped pattern on species richness over time may reflect threshold recovery model, which can be apply to decision making and management over relatively short timescales (Suding and Hobbs2008). (3) Soil carbon increases during a fallow period because
of increased plant productivity.
(4) Soil nitrogen increases during a fallow period, if legume abundance increases, because legumes might increase activity of soil microbes involved in miner-alization (Spehn and others2000).
(5) Soil recovery is much slower than vegetation changes during a fallow period (Knops and Tilman2000; Brye and Kucharik2003).
Materials and Methods
Study Area
A chronosequence of abandoned fields was established in the Research Station of Alpine Meadow and Wetland Ecosystems of Lanzhou University in the eastern part of the Qing-Hai Tibetan Plateau, China (N3455°, E10253°) in
2003. The region has an elevation of 2,900–3,000 m above sea level. Based on meteorological data provided by Hezuo’s Institute of Meteorology, the area belongs to sub-alpine meadow with mean annual precipitation of 546.6 mm from 1958 to 2007, and about 85% of that rainfall is concentrated within the growing season from June through September. Annual mean temperature is 2.4°C from
-9.9°C in January to 12.8°C in July. The coldest months are
December, January, and February with an average temper-ature of-8.9°C and the warmest months are June, July, and
August, of which the average temperature is 11.5°C. The
soil texture is sandy loam with gravel, slightly alkaline and classified as a sub-alpine meadow soil (Gong1999).
Agricultural practices in this region include rain-fed farming with main two crops of short growing season: oat (Avena sativa) and rape (Brassica napus) in an oat–fallow– rape rotation.
Study Design
validated by revisiting and resampling the studied com-munities (Foster and Tilman2000).
We established the sampling fields in Hezuo in 2003. The fields used in this study were set aside from agriculture in 2001, 1999, 1997, 1987, and 1972 and had an age since abandonment at sampling time of 1, 3, 5, 15, and 30 years. All fields are located within an area of 10 km2, had the same orientation, facing south and slope with 15–25°. All
fields were fenced to exclude large herbivores (mainly sheep and cattle), but not small herbivores, such as rabbit, plateau pika and plateau zokor, which were found occa-sionally at low densities.
In each field, 10 (50950 cm) permanent sampling quadrats were placed using a systematic sampling design along two transects. Quadrats in each field were set 3.5 m apart from each other and field margins (about 2 m from the edge). In August 2006 and 2007, during the peak of the growing season, cover (%) was visually estimated in each quadrat. After these measurements, the aboveground bio-mass of each species was cut, dried at 80°C to constant
weight and weighed.
Species richness (S) was expressed as the average number of species per quadrat (n=10) in each field, and aboveground biomass was also expressed as the average biomass per quadrat in each field. All species were clas-sified into three functional groups: i.e., grass, legume and forb. No natural woody plants were found in any fields. The grass group included graminoids and sedges, and the forb group included all other species except grass and legumes.
Soil Sampling
Eight 0–20 cm, 20–40 cm soil samples were collected at random in August 2006 and 2007 in each field, and com-posited by field and depth, for a total of 8 samples per field per depth. After removing larger gravel stones and plant fragments and roots, each sample was divided into two parts. One part of each soil sample was air-dried for the estimation of soil physicochemical parameters and the other part was sieved through a 2 mm screen and adjusted to 50% of water holding capacity and then incubated at 25°C for 2 weeks to permit uniform rewetting and to
sta-bilize the microbial activity after the initial disturbances. 0.1 g dry soil samples for each field was used to measure soil organic carbon (Corg) by the dichromate oxidation
method (Kalembasa and Jenkinson1973), and 1 g dry soil samples for each field was used to measure soil total nitrogen (TN) by the Kjeldahl method (Jackson1958).
Microbial biomass carbon (MBC) and nitrogen (MBN) in soil were estimated by fumigation extraction (Brookes and others1985). Six portions equivalent to 25 g of dry weight soil were taken from each soil sample per field.
Three portions were fumigated for 24 h at 25°C with
CHCl3(ethanol-free). Following fumigant removal, the soil
was extracted with 100 ml of 0.5 M K2SO4by shaking for
1 h at 200 rpm and then filtered (membrane mesh size is 0.4lm). The other three non-fumigated portions were extracted simultaneously at the time fumigation com-menced. Organic carbon in the extracts was measured using dichromate oxidation method. Microbial biomass C was calculated as follows:
Microbial biomass carbon¼ ðCorgðfumÞ CorgðnonÞÞ=0:38;
Total nitrogen in the extracts was measured using the Kjeldahl method (Brookes and others 1985). Microbial biomass nitrogen was calculated as follows:
Microbial biomass N¼ ðTN (fum) TN(non)Þ=0:45
Statistical Analyses
Linear or quadratic regression models were used to eval-uate changes in plant and soil properties over time and were fitted to the data based on the best fit. Analyses were performed using Origin 7.0.
Results
Plant Community
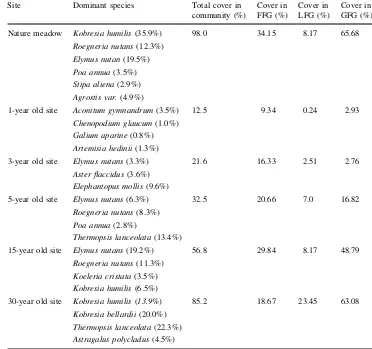
Total vascular plant cover increased from 12.5 to 85.2% over time. During the first 8 years of succession, the veg-etation changed from annual and biannual weeds to perennial grasses (Table1). After 18 years of fallow, the vegetation was dominated by Elymus nutans, Roegneria nutans, Koeleria cristata, Kobresia bellardii, Kobresia humilisandThermopsis lanceolata(Table1).
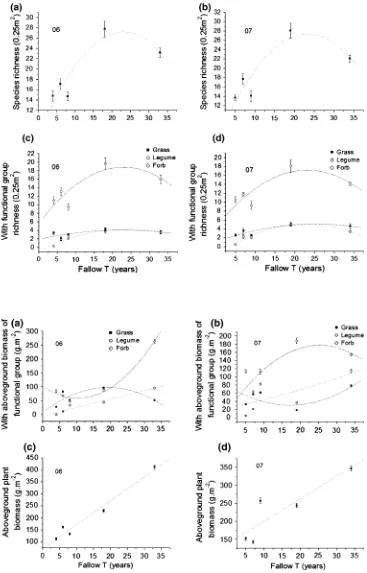
Plant species richness in the five fields ranged from 13.7 to 28.1 per 0.25 m2and increased over the first 20 years but decreased thereafter (Fig.1a, b). Most of species richness was comprised of forbs (Fig.1c, d) and forb richness increased over the first 20 years but decreased thereafter. The aboveground biomass of forb group exhibited signifi-cant U-shape curve (decreased over the first 10 years but increased thereafter) responding to fallow time gradient in 2006 (Fig.2a; Table2). Aboveground biomass of forb showed an inverse trend in 2007 which was correlated with a significantly higher aboveground biomass of legumes and grasses (Fig.2b; Table2). Legume group richness and their corresponding biomass increased significantly over fallow time (Figs.1c, d, 2a, b; Table2). We also found that aboveground biomass along the fallow time gradient increased significantly linearly (Fig.2c, d; Table2). The aboveground biomass in 2006 varied from 112 to 412 g m-2
and increased from 142 to 347 g m-2
Soil Carbon and Nitrogen Properties
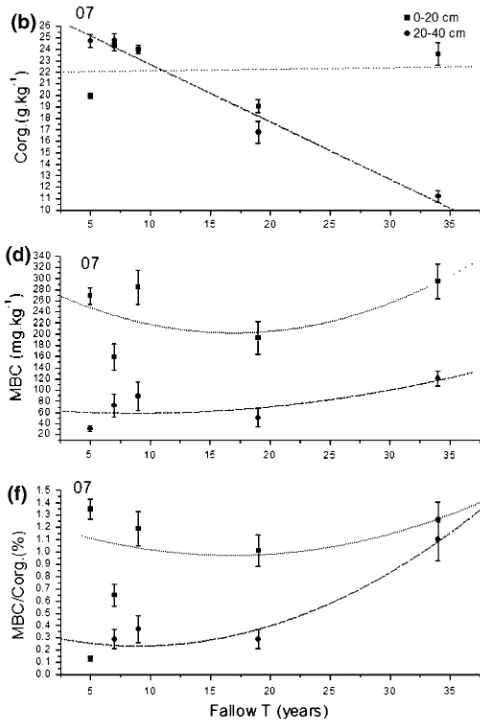
Soil organic C in the upper 20 cm differed among the two sampling years. In 2006 we found a linear decrease, whereas in 2007 we found no significant change with fallow time. The soil organic C in the 20–40 cm depth showed the same linear decrease with fallow time in both years (Fig.3a, b; Table3). Soil microbial C (MBC) and the percent of microbial carbon to soil organic carbon (MBC/Corg) in the
upper 20 cm along fallow time gradient decreased over the first 20 years but increased thereafter (Fig.3c–f; Table3).
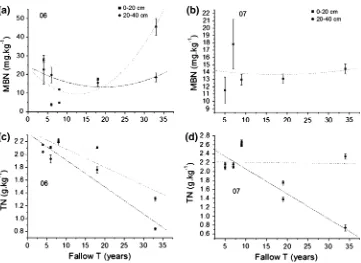
The response pattern of the soil microbial N (MBN) in relation to the fallow time gradient showed a U-shaped curve (decreased over the first 10 years but increased thereafter) in the upper 20 cm in 2006, and the decrease of MBN was larger in the upper 20 cm as compared to 20– 40 cm in the first years of fallow (Fig.4a; Table 3). At the fallow of 18 years, MBN in the upper 20 cm began to increase markedly again and reached the peak in the fallow of 33 years, whereas the 20–40 cm MBN increasing but less so in 2006 (Fig.4a). There was significant linear decrease in TN over fallow time except in the upper 20 cm in 2007 (Fig.4c, d; Table 3).
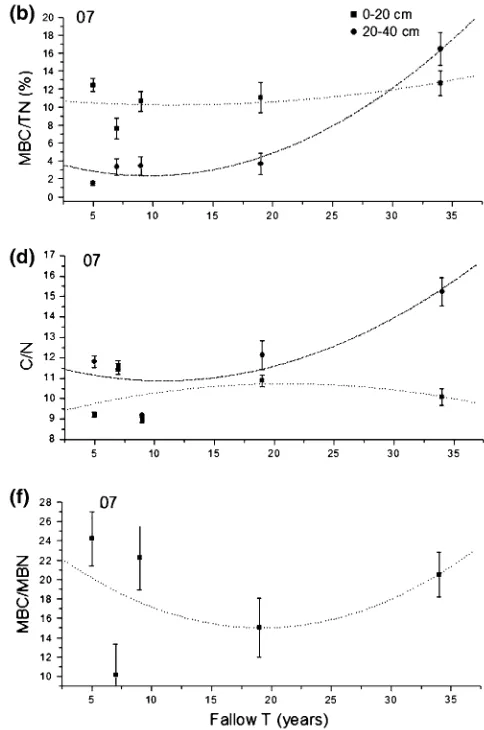
The percent of microbial carbon to soil organic nitrogen (MBC/TN) in the upper 20 cm showed a U-shaped curve (decreased over the first 20 years but increased thereafter) in 2006, while the 20–40 cm showed a more significant U-shaped increase in 2007. MBC/TN in the upper 20 cm was always larger than in the under 20 cm (Fig.5a, b). The ratio of soil organic carbon and soil total nitrogen (C/N) showed the same trend at both soil depths in 2006, with the 20–40 cm depth showing a U-shaped curve in both years (Fig.5c, d).
Discussion
Changes in Plant Communities Over Time
In the early succession stage (1–4 years) annual and peren-nial weeds and herbs with high reproductive capacities and ecological, morphological and genetic plasticity dominated. In the later successional stage(1–30 years) the annual plants and short-lived perennials were displaced by the slow-growing, long-lived, and highly resilient perennial grasses with clonal reproduction (Egler1954; Pickett1982) such as Elymus nutans,Roegneria nutansandKobresia humilis.
Table 1 Changes in plant across fallow time gradients
The mean covers are shown for the years of 2006 and 2007. FFGForb functional group, LFGLegume functional group, GFGGrass functional group
Site Dominant species Total cover in community (%)
Cover in FFG (%)
Cover in LFG (%)
Cover in GFG (%)
Nature meadow Kobresia humilis(35.9%)
Roegneria nutans(12.3%)
Elymus nutan(19.5%)
Poa annua(3.5%)
Stipa aliena(2.9%)
Agrostis var.(4.9%)
98.0 34.15 8.17 65.68
1-year old site Aconitum gymnandrum(3.5%)
Chenopodium glaucum(1.0%)
Galium aparine(0.8%)
Artemisia hedinii(1.3%)
12.5 9.34 0.24 2.93
3-year old site Elymus nutans(3.3%)
Aster flaccidus(3.6%)
Elephantopus mollis(9.6%)
21.6 16.33 2.51 2.76
5-year old site Elymus nutans(6.3%)
Roegneria nutans(8.3%)
Poa annua(2.8%)
Thermopsis lanceolata(13.4%)
32.5 20.66 7.0 16.82
15-year old site Elymus nutans(19.2%)
Roegneria nutans(11.3%)
Koeleria cristata(3.5%)
Kobresia humilis(6.5%)
56.8 29.84 8.17 48.79
30-year old site Kobresia humilis(13.9%)
Kobresia bellardii(20.0%)
Thermopsis lanceolata(22.3%)
Astragalus polycladus(4.5%)
We also found a significantly increase in legume func-tional richness and biomass over time. Forb funcfunc-tional richness increased at the earlier stage, then decreased gradually at the medium stage. The aboveground biomass showed a linear-increase with fallow time gradient. These indicate that the cessation of grazing favors the functional
group richness and their corresponding biomass during a fallow period and supports the first hypothesis. The above-mentioned correlations suggest that the relationship between aboveground biomass and species richness did not always increase linearly over time. Our results disagree with the hypothesis that increasing productivity was a
Fig. 1 Changes in species and functional group richness over time. Each data point is the average of 10 quadrats with standard error in 2006 (left) and 2007 (right). See Table2for significance of all variables
direct result of higher species diversity, as has been shown in experimental grassland plant communities (Tilman and others1996; Hector and others1999).
In general, species richness increased in a ‘hump-shaped’ pattern over fallow time. This indicates that spe-cies richness does not always increase over longer fallow time. Abebe and others (2006) also reported that the trends of plant species richness and diversity after restoration changed in a positive-linear way, and declined when the fallow times were doubled. Bonet and Juli (2004) investi-gated a 60-year chronosequence study of semi-arid old-fields and indicated that species richness varied in a non-linear relation as a result of the coexistence of different functional groups. Species richness increased quickly dur-ing the first decade of abandonment and the maximum total richness was found at 18 years following fallow, with a decrease after that. Annuals and perennial forbs reached their maximum richness during the first 10 years of aban-donment. Asefa and others (2003) assessed the restoration of biodiversity in highly degraded areas in eastern Tigray, northern Ethiopia using enclosures, and found that herba-ceous species richness increased with time of restoration, reaching a maximum after 3 years of rest, followed by a decline.
During the early stages of succession, the gradual col-onization and reestablishment of a soil seed bank may lead
to an increase in species richness (Huston 1979), and subsequently, species richness may decrease in later suc-cessional stages as a result of competitive interactions (Tilman 1982). Thus, the ‘‘humped-back model’’ (uni-modal response curve) of species richness may be a general pattern that occurs in the vegetation diversity over fallow time gradients (Peet and Christensen 1978). This pattern, although the underlying factors may be different, can also be applied to nutrient and productive gradients (Grime
1973; Tilman 1982; Wisheu and Keddy 1989), and dis-turbance frequency gradients (Connell 1978; Lubchenco
1978; Huston1979; Wilson and Keddy1988). In total the hump shaved curve suggests that there may be a threshold along fallow time, nutrient and productive and disturbance frequency gradient. Critical thresholds occur when the response of a species or ecological process to disturbance is not linear, but instead changes abruptly at some threshold level (Sasaki and others 2008). Exceeding this threshold leads to a loss of ecosystem functions and biodiversity; change in the opposite direction can instead lead to recovery if the threshold change can be reversed (Sasaki and others2008). The threshold models of species richness matches the recovery that we found following 15 years of fallow and supports our second hypothesis. This threshold, to some degree, may depend also depend on other factors, such as land use history, previous crop practices (Bonet
2004), soil seed bank (Baskin and Baskin 1998), plant dispersal type, soil moisture content and nutrient (Bonet
2004) and current management. However, the mechanism causing this threshold is unclear.
Changes in Soil Carbon and Soil Nitrogen Properties Over Time
If soil processes are influenced by plant community, then soil processes should correlate with successional plant dynamics (Amiotti and others 2000; Woods 2000). It is generally accepted that organic carbon increase over suc-cessional time (Aweto1981; Juo and Lal1977; Hamburg
1984; Landgraf and others 2003; Potter and others 1999; Richter and others 1999; Knops and Tilman 2000; Brye and Kucharik 2003), although a few studies have shown limited change (Robles and Burke1998; Bonet2004).
In our study we found a significant decline in soil organic carbon with fallow time. This is not consistent with many other studies and our third hypothesis that soil carbon would increase with increased plant productivity. We hypothesize that in the absent of disturbance the biomass accumulation was mainly in aboveground plant biomass and litter and not in belowground biomass, which led to lower belowground carbon input. In addition, the higher plant cover and increased aboveground biomass may have immobilized more nutrients in the later stages of
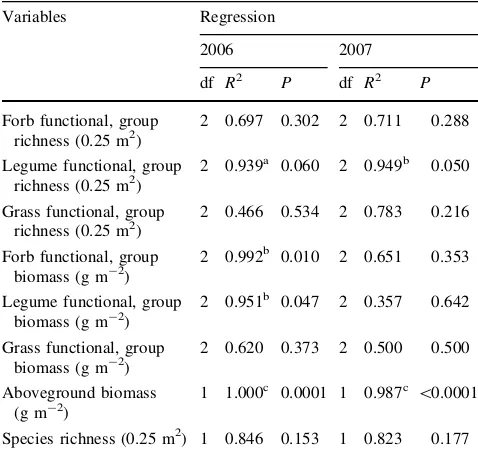
Table 2 The characteristics of fitted curve between fallow time and several variables describing the plant at this sites
Variables Regression
2006 2007
df R2 P df R2 P
Forb functional, group richness (0.25 m2)
2 0.697 0.302 2 0.711 0.288
Legume functional, group richness (0.25 m2)
2 0.939a 0.060 2 0.949b 0.050
Grass functional, group richness (0.25 m2)
2 0.466 0.534 2 0.783 0.216
Forb functional, group
2 0.620 0.373 2 0.500 0.500
Aboveground biomass (g m-2)
1 1.000c 0.0001 1 0.987c \0.0001
Species richness (0.25 m2) 1 0.846 0.153 1 0.823 0.177
R2values from regression analyses testing for first and second order polynomial
a Statistical significant differences atPB0.1
b Statistical significant differences atPB0.05
succession. An alternative explanation of the slower decomposition and nutrient mineralization, may be the recalcitrant nature of belowground litter at high latitudes (Flanagan and Veum 1974; Van Cleve and Yarie 1986). The establishment of native species may lead to an increase in undecomposed belowground litter that may take longer than our time series to become incorporated into soil organic matter. These two mechanisms may in combination have caused the significant decline in soil organic carbon over fallow time.
Our study also showed a significant decline in soil nitrogen with fallow time. This isn’t consistent with many other studies and also does not correspond with the increased legume abundance. Other studies have shown that soil N content in the top 25 cm did not significantly correlated with ecosystem age in the restored prairies (Brye and Kucharik2003). Total soil N content in the top 30 cm increased significantly from year to year, however, total soil N content in the 30–60 cm depth interval did not differ
significantly (Brye and others 2002). Knops and Tilman (2000) found that soil total carbon, nitrogen, and the carbon to nitrogen ratio (C:N) all were significantly positively correlated with field age since abandonment and soil nitrogen in the 0–10 cm depth increased with field age, but there was no change in the 10–60 cm depth horizon. Therefore, it is necessary to consider soil depth when studying soil nutrient accumulation. We hypothesized that soil nitrogen increases during a fallow period, if legume abundance increases, because legumes might increase activity of soil microbes involved in mineralization (Spehn and others 2000). Our results have shown that the legume cover and aboveground biomass increased over fallow time, but similarly to the soil carbon decline, the decrease in soil nitrogen might be caused by a redistribution of soil nitrogen into the plant or litter nitrogen.
Soil microbial biomass is sensitive to the changes in soil function over the time scale of secondary succession (Schmidt and others 2007). Manlay and others (2000)
Fig. 3 Changes in soil carbon across fallow time gradients. The mean and standard error are shown for years 2006 (left) and 2007 (right). See Table3for significance of all variables. All abbreviations:Corg
Table 3 The characteristics of fitted curve between fallow time and several variables describing the soil at these sites
Variables Depth (cm) Regression
2006 2007
df R2 P df R2 P
Corg 0–20 1 0.868b 0.021 1 0.010 0.916
20–40 1 0.806b 0.038 1 0.978c 0.001
MBC 0–20 2 0.400 0.598 2 0.316 0.648
20–40 2 0.126 0.874 2 0.528 0.471
MBC/Corg(%) 0–20 2 0.525 0.475 2 0.159 0.841
20–40 2 0.271 0.729 2 0.925a 0.075
MBC/MBN 0–20 1 0.248 0.392 1 0.151 0.849
20–40 1 0.009 0.879 \ \ \
MBC/TN (%) 0–20 2 0.533 0.467 2 0.273 0.728
20–40 2 0.807 0.193 2 0.971b 0.029
C/N 0–20 2 0.647 0.352 2 0.102 0.897
20–40 2 0.793 0.206 2 0.783 0.216
MBN 0–20 2 0.751 0.249 2 0.010 0.991
20–40 2 0.434 0.565 \ \ \
TN 0–20 1 0.822b 0.034 1 0.002 0.941
20–40 1 0.884b 0.015 1 0.848b 0.026
R2values from regression analyses testing for first and second order polynomial
a Statistical significant differences at theP
B0.1
b Statistical significant differences at theP
B0.05
c Statistical significant differences at theP
B0.001
‘‘\’’=indicates not applicable;Corgsoil organic carbon,MBCsoil microbial carbon,MBNsoil microbial nitrogen,TNsoil total nitrogen,C/Nthe ratio of soil organic carbon and soil total nitrogen,MBC/Corg(%) the percent of microbial carbon to soil organic carbon,MBC/TN(%) the percent of microbial carbon to soil organic nitrogen
reported that microbial biomass showed no clear variation in sampled 0–10 cm soil along fallow time (\30 years).
Landgraf (2001) found that microbial biomass carbon and MBC/Corg ratios increased along fallow time (\3 years),
but microbial biomass N decreased. Jia and others (2005) found that microbial biomass carbon and MBC/Corg readily decreased but microbial biomass nitrogen exhib-ited no trend along fallow time (\15 years). However, our
study is inconsistent with these patterns. We found that microbial biomass carbon and MBC/Corg in the upper
20 cm increased in the former stage of fallow(\6 years),
and declined from 8 to 18 years, and after 18 years increased again. This suggests that changes in microbial biomass along fallow time gradients are different among ecosystems. MBC/Corg reflects the link and interaction between microbial biomass and soil organic C (Insam and Domsch1988) and can serve as an index for monitoring soil perturbation (Smith and Paul 1990). The percent of
microbial C to soil organic C was significantly greater, which indicates that microbial biomass potentially plays a greater role in soil C turnover than the plant detrital matter in alpine meadow We found that the microbial biomass N in the upper 20 cm decreased sharply during the early stage of fallow (\8 years), followed by an
increase in later stages. We hypothesize that the increas-ing plant cover and aboveground biomass over time increased the plant litter pool, which may have led to a decrease in soil temperature, which resulted in slower decomposition and nutrient mineralization and a slower N cycling leading to lower soil available nitrogen levels (Tilman and others 1996; Knops and others 2001). Diversity, vegetation structure, and ecological processes can be regarded as the criteria of restoration success (Ruiz-Jaen and Aide 2005). Our results indicated that fallow time had a great influence on development of plant community and soil process in this ecosystem and
Fig. 5 Changes in the ratios of soil carbon and nitrogen across the fallow time gradient. The mean and standard error are shown for years 2006 (left) and 2007 (right). See Table3 for significance of all variables. All abbreviations: Corg soil organic carbon, MBC soil
supported our hypothesis that soil recovery is slower than the vegetation recovery during succession.
We found that during natural restoration succession, the vegetation developed faster than soil processes, which suggest that fallow would not significantly improve the soil (Odum 1960; Aweto 1981; Odum and others 1984; Lee
2002).
Conclusions
Our results suggest that fallow time had a greater influence on development of plant community than soil process in abandoned fields in sub-alpine meadow ecosystem. The species richness of different functional group (forb, grass and legume species) showed the same hump-shaped pat-terns along fallow time gradient, but the corresponding biomass exhibited no trend. Soil organic carbon and total nitrogen showed the more significant linear-declined models except in the upper 20 cm in 2007 along fallow time gradient. MBC (0–20 cm), MBC/Corg(%) (0–20 cm),
MBC/TN (0–20 cm), C/N (20–40 cm) and MBN (0–20 cm) showed the U-shaped model along fallow time gradient. These results indicate that the development of plant community may lead to nutrient limitation at the latter stage of succession. However, the increased micro-bial biomass at the latter successional stage may promote increased decomposition of plant litter. Therefore, aban-doned fields in sub-alpine meadow ecosystem have a high resilience and stronger rehabilitating capability under the natural recovery condition. These results support a ‘‘humped-shaped model’’ of recovery, suggesting that 15 years of fallow leads to the best restoration of these degraded fields.
Acknowledgments This research was supported by a grant (No. 30871823) from the Natural Science Foundation of China and the Research Station of Alpine Meadow and Wetland Ecosystems of Lanzhou University. We are very grateful to professor Guozhen Du, Shiting Zhang and Xianhui Zhou for helping in field investigation and two anonymous reviewers for the constructive suggestions on our manuscript.
References
Abebe HM, Oba G, Angassa A, Weladji RB (2006) The role of area enclosures and fallow age in the restoration of plant diversity in northern Ethiopia. African Journal of Ecology 44:507–514 Amiotti NM, Zalba P, Sa0nchez LF, Peinemann N (2000) The impact
of single tree on properties of loess-derived grasslands soils in Argentina. Ecology 81:3283–3290
Asefa DT, Weladji RB, Oba G, Coleman JE (2003) An assessment of restoration of biodiversity in degraded High Mountain grazing lands in northern Ethiopia. Land Degradation & Development 14:25–38
Aweto AO (1981) Secondary succession and soil fertility restoration in south western Nigeria. II. Soil fertility restoration. Journal of Ecology 69:609–614
Baskin CC, Baskin JM (1998) Seeds: ecology, biogeography, and evolution of dormancy and germination. Academic Press, San Diego, London, pp 666–667
Bonet A (2004) Secondary succession of semi-arid Mediterranean old-fields in south-eastern Spain: insights for conservation and restoration of degraded lands. Journal of Arid Environments 56:213–223
Bonet A, Juli G (2004) Pausas Species richness and cover along a 60-year chronosequence in old-fields of southeastern Spain. Plant Ecology 174:257–270
Brookes PC, Landman A, Pruden G, Jenkinson DS (1985) Chloro-form fumigation and release of soil nitrogen: a rapid direct extraction method to measure microbial biomass nitrogen in soil. Soil Biology & Biochemistry 17:837–842
Brye KR, Kucharik CJ (2003) Carbon and nitrogen sequestration in two prairie topochronosequences on contrasting soils in Southern Wisconsin. American Midland Naturalist 149:90–103
Brye KR, Norman JM, Gower ST (2002) Assessing the progress of a tallgrass Prairie restoration in Southern Wisconsin. American Midland Naturalist 148:218–235
Burel F, Baundry J (1995) Species biodiversity in changing agricul-tural landscapes: a case study in the Pays d’Ange, France. Agriculture Ecosystem and Environment 55:1993–2000 Cione NK, Padgett PE, Allen EB (2002) Restoration of a native
shrubland impacted by exotic grasses, frequent fire, and nitrogen deposition in southern California. Restoration Ecology 10:376– 384
Connell JH (1978) Diversity in tropical rain forests and coral reefs. Science 199:1302–1310
De Deyn GB, Raaijmakers CE, Zoomer HR, Berg MP, De Ruiter PC, Verhoef HA, Bezemer TM, van der Putten WH (2003) Soil invertebrate fauna enhances grassland succession and diversity. Nature 422:711–713
Egle FE (1954) Vegetation science concepts I. Initial floristic composition. A factor in old-field vegetation development. Vegetation 4:412–417
Flanagan PW, Veum AK (1974) Relationships between respiration, weight loss, temperature and moisture in organic residues in tundra. In: Holding AJ, Heal OW, MacLean SF Jr, WFlanagan P (eds) Soil organisms and decomposition in Tundra. Tundra Biome Steering Committee, Stockholm, pp 249–278
Foster BL, Tilman D (2000) Dynamic and static views of succession: testing the descriptive power of the chronosequence approach. Plant Ecology 146:1–10
Gong ZT (1999) Chinese soil taxonomy: theories, methods and applications. Science Press, Beijing
Grime JP (1973) Competitive exclusion in herbaceous vegetation. Nature 242:344–347
Hamburg SP (1984) Effects of forest growth on soil nitrogen and organic matter pools following release from subsistence agri-culture. In: Stone EL (ed) Forest soils and treatment impacts. Proceedings of the Sixth North American Forest Soils Confer-ence (June 1983), pp 145–158. University of Tennessee, Knoxville, Tennessee, USA
Hector A, Schmid B, Beierkuhnlein C, Caldeira MC, DiemerM Dimitrakopoulos PG et al (1999) Plant diversity and productivity experiments in European grasslands. Science 286:1123–1127 Huston MA (1979) A general hypothesis of species diversity.
American Naturalist 113:81–101
Insam H, Domsch KH (1988) Relationship between soil organic carbon and microbial biomass on chronosequences of reclama-tionsites. Microbial Ecology 15:177–188
Jia GM, Cao J, Wang G (2005) Influence of land management on soil nutrients and microbial biomass in the Central Loess Plateau, Northwest China. Land Degradation & Development 16:455–462 Jordan WR, Peters RL, Allen EB (1988) Ecological restoration as a strategy for conserving biological diversity. Environmental Management 12:55–72
Juo ASR, Lal R (1977) The effect of fallow and continuous cultivation on the chemical and physical properties of an Alfisol in the tropics. Plant and Soil 47:567–584
Kalembasa SJ, Jenkinson DS (1973) A comparative study of titrimetric and gravimetric methods for the determination of organic carbon in soil. Journal of Science, Food Agriculture 24:1085–1090
Knops J, Tilman D (2000) Dynamics of soil nitrogen and carbon accumulation for 61 years after agricultural abandonment. Ecology 81:88–98
Knops J, Wedin D, Tilman D (2001) Biodiversity and decomposition in experimental grassland ecosystems. Oecologia 126:429–433 Landgraf D (2001) Dynamics of microbial biomass in Cambisols
under a three year succession in north eastern Saxony. Journal of Plant Nutrition and Soil Science 164:665–671
Landgraf D, Bo¨hm C, Makeschin F (2003) Dynamic of different C and N fractions in a Cambisol under five-year succession fallow in Saxony (Germany). Journal of Plant Nutrition and Soil Science 166:319–325
Landsberg J, O’Connor T, Freudenberger D (1999) The impacts of livestock grazing on biodiversity in natural ecosystems. In: H-J Jung, GC Fahey (eds) Nutritional ecology of herbivores, pp 752– 777. American Society of Animal Science, Savoy, IL
Lee K (2002) Secondary succession in abandoned fields after shifting cultivation in Kangwon-Do, Korea. In: Lee D, Jin V (eds) Ecology of Korea. Bumwoo Publishing Company, Seoul, pp 406–407
Li WH, Zhou XM (1998) Ecosystems of Tibetanan plateau and approach for their sustainable management. Guangdong Science & Technology Press, Guangdong
Lubchenco J (1978) Plant species diversity in a marine intertidal community: importance of herbivore food preference and algal competitive abilities. American Naturalist 112:23–39
Manlay RL, Cadet P, Thioulouse J, Chotte JL (2000) Relationship between abiotic and biotic soil properties during fallow periods in the Sudanian zone of Senegal. Applied Soil Ecology 14:89–101 Odum EP (1960) Organic production and turnover in old-field
succession. Ecology 41:34–49
Odum EP, Pinder JEIII, Christiansen TA (1984) Nutrient losses from sandy soils during old-field succession. American Midland Naturalist 111:148–154
Palik BJ, Goelbel PC, Kirkman LK, West L (2000) Using landscape hierarchies to guide restoration of disturbed ecosystems. Eco-logical Applications 10:189–202
Palmer MA, Ambrose RF, Poff NL (1997) Ecological theory and community restoration ecology. Restoration Ecology 5:291–300 Peet RK, Christensen NL (1978) Changes in species diversity during secondary forest succession on the North Carolina Piedmont. In: During HJ, Werger MJA, Willems JH (eds) Diversity and pattern in plant communities. SPB Academic Publishing, The Hague, pp 233–245
Pickett STA (1982) Population patterns through twenty years of old field succession. Vegetatio 49:45–59
Potter KN, Torbert HA, Johnson HB, Tischler CR (1999) Carbon storage after long-term grass establishment on degraded soils. Soil Science 164:718–725
Potthoff M, Jackson LE, Steenwerth KL, Ramirez I, Stromberg MR, Rolston DE (2005) Soil biological and chemical properties in restored perennial grassland in California. Restoration Ecology 13:61–73
Richter DD, Markewitz D, Trumbore SE, Wells CG (1999) Rapid accumulation and turnover of soil carbon in a re-establishing forest. Nature 400:56–58
Robertson GP, Vitousek PM (1981) Nitrification potentials in primary and secondary succession. Ecology 62:376–386
Robles MD, Burke IC (1998) Soil organic matter recovery on conservation reserve program fields in southwestern Wyoming. Soil Science Society of America Journal 62:725–730
Ruiz-Jaen MC, Aide TM (2005) Restoration success: how is it being measured? Restoration Ecology 13:569–577
Ruprecht E (2006) Successfully recovered grassland: a promising example from Romanian old-fields. Restoration Ecology 14:473–480
Sasaki T, Okayasu T, Jamsran U, Takeuchi K (2008) Threshold changes in vegetation along a grazing gradient in Mongolian rangelands. Journal of Ecology 96:145–154
Schmidt SK, Costello EK, Nemergut DR, Cleveland CC, Reed SC, Weintraub MN, Meyer AF, Martin AM (2007) Biogeochemical consequence of rapid microbial turnover and seasonal succession in soil. Ecology 88:1379–1385
Smith JL, Paul EA (1990) The significance of soil microbial biomass estimations. In: Bollage JM, Stotzky G (eds) Soil biochemistry. Marcel Dekker, New York, pp 357–396
Spehn EM, Joshi J, Schmid B, Alphei J, Ko¨rner Ch (2000) Plant diversity effects on soil heterotrophic activity in experimental grassland ecosystems. Plant and Soil 224:217–230
Suding KN, Hobbs RJ (2008) Threshold models in restoration and conservation: a developing framework. Trends in Ecology and Evolution. doi:10.1016/j.tree.2008.11.012
Tilman D (1982) Resource competition and community structure. Princeton University Press, Princeton, NJ
Tilman D, Wedin D, Knops J (1996) Productivity and sustainability influenced by biodiversity in grassland ecosystems. Nature 379:718–720
Van Cleve K, Yarie J (1986) Interaction of temperature, moisture and soil chemistry in controlling nutrient cycling and ecosystem development in the taiga of Alaska. In: Van Cleve K, Chapin FSIII, Flanagan PW, Viereck LA, Dyrness CT (eds) Forest ecosystems in the Alaskan Taiga. A synthesis of structure and function. Springer, New York, pp 160–189
Wang QJ (1997) The study of grassland resource, ecological environment and sustainable development on Qinghai–Tibetan Plateau. Qinghai Prataculture 6:1–11
Wilson SD, Keddy PA (1988) Species richness, survivorship and biomass accumulation along an environmental gradient. Oikos 53:375–380
Wisheu IC, Keddy PA (1989) Species richness–standing crop relationship along four lakeshore gradients: constraints on the general model. Canadian Journal Botany 67:1609–1617 Woods DK (2000) Dynamics in late-successional hemlock–hardwood