REGULAR ARTICLE
Plant species effects on soil carbon and nitrogen dynamics
in a temperate steppe of northern China
Lili Jiang&Xingguo Han&Ning Dong& Yanfen Wang&Paul Kardol
Received: 18 October 2010 / Accepted: 5 May 2011 #Springer Science+Business Media B.V. 2011
Abstract We evaluated plant species effects on soil carbon (C) and nitrogen (N) dynamics in a steppe ecosystem of northern China. In two subsequent years, we measured soil properties in the top 10 cm of the soil under replicated mono-dominant plant patches in two sites that differed in land-use history: a cultivated site (old field) and an uncultivated site (steppe). Both in the cultivated site and the uncultivated site, we selected patches of three of the dominant plant species. Contrast analyses in ANOVA showed that soil organic carbon (SOC) and total N content (g per m2) was on average lower in the cultivated site than in the uncultivated site. On average, soil respiration was also lower in the cultivated site than in the uncultivated site. However, overall differences in soil C and N dynamics between
the cultivated site and the uncultivated site (if existing) were generally small compared to the effects of individual plant species. Soil respiration differed among plant species in the cultivated site, but not in the uncultivated site. In contrast, SOC content, total N, and N mineralization rate differed among plant species in the uncultivated site, but not in the cultivated site. Mineralization and nitrification rates strongly varied among the dominant plant species, particularly in the uncultivated site. Variation in both C and N pools and fluxes could be best explained by a combination of plant biomass, litter, and soil micro-bial and micro-climatic parameters. Cultivation can directly affect soil C and N dynamics. However, importantly, our data suggest that indirect effects through changes in plant species composition are also important, and probably strongly interact with direct effects in affecting soil C and N dynamics after land-use change. Hence, evaluation of land-use history on soil C and N dynamics requires integral analyses of changes in plant community composition.
Keywords Cultivation . Carbon sequestration . N-mineralization rate . Old-field . Restoration . Soil carbon and nitrogen . Soil respiration . Succession
Introduction
In northern China, steppe is a dominant form of landscape and an integral component of the Eurasian DOI 10.1007/s11104-011-0822-y
Responsible Editor: Hans Lambers.
L. Jiang
:
N. Dong:
Y. WangCollege of Resources and Environment,
Graduate University of the Chinese Academy of Sciences, 19 Yuquanlu,
Beijing 100049, China
L. Jiang
:
X. Han (*):
N. DongState Key Laboratory of Vegetation and Environmental Change, Institute of Botany, Chinese Academy of Sciences,
Xiangshan,
Beijing 100093, China e-mail: [email protected]
P. Kardol
continent, in 2001 covering a total of 4×10⁶ km2 (National Statistics Bureau of China 2002). Steppe plays important roles in servicing the ecological environment and socio-economics of the region. Since the mid 1950’s, about 4.8% of the steppe area was claimed for agriculture. In recent years, more than 10% of former agricultural land has been restored to grassland or forest (Ministry of Environ-mental Protection 2004). Change of land use will have important implications for local and global biogeochemical cycles and local vegetation dynam-ics (Foster et al. 2003; Degryze et al. 2004). For example, soils may act as a source or sink of carbon dioxide (CO2) in exchange with the atmosphere;
soils contain a large stock of soil organic carbon (SOC), and slight changes in SOC stock represent large CO2 fluxes (Krogh et al. 2003). Thus
under-standing effects of land use change on biogeochem-ical cycles is of high importance in predicting future atmospheric CO2levels (IPCC2001).
Cultivation of grassland and steppe has caused large losses of soil carbon and nitrogen (Wu and Tiessen2002; McLauchlan2006; Wang et al.2009). For example, short-term cultivation has been shown to increase soil respiration because of improved conditions for decomposition of soil organic matter, such as increased soil aeration and moisture content, and disruption of soil aggregates, exposing stable, adsorbed organic matter to microbial activity (Six et al.1998). However, the loss of organic matter in soil means depletion of substrates for soil respiration (Luo and Zhou 2006), which indicates that on the long term effects of cultivation may be difficult to predict.
On the other hand, changes in soil nitrogen mineralization rate after agricultural abandonment are still not very well understood and may be context-dependent (Grandy and Robertson 2006). For instance, some studies showed highest N miner-alization rates in early secondary succession (Baer et al. 2002; Camill et al. 2004) while others found that net nitrogen mineralization increased with time after abandonment (Angus et al. 2006; Fraterrigo et al. 2006). Differences in historical management could be one of the reasons why shifts in nitrogen mineraliza-tion rate after land-use change vary from site to site (e.g., Vitousek et al. 1989). For example, historical manure inputs may stimulate soil net nitrification rates (Compton and Boone 2000).
Historical land use explains part of the variation and distribution in present vegetation (Matlack1994; Motzkin et al. 1996). Importantly, variation in plant dominance patterns may affect patterns of soil C and N accumulation and cycling rates (Bardgett et al. 1999; Camill et al.2004; Ehrenfeld et al.2005; Angus et al. 2006; Fraterrigo et al. 2006). For example, plant-induced variation in soil C has been demon-strated in a shortgrass steppe ecosystem (Burke et al., 1999). Camill et al. (2004) found that the increase of soil C mineralization rates and decrease of soil N mineralization rates were correlated with the increase of C4grasses during secondary grassland succession.
However, so far, little is known about the importance of shifts in dominant plant species after land use change on soil carbon and nitrogen dynamics.
Former studies have evaluated the relative importance of land-use history and plant species effect on soil properties and processes using a full factor design (Burke et al. 1999; Compton et al. 1998). However, land-use history may select for plant species with particular functional traits (De Deyn et al. 2008), and the dominant plant species generally vary with land use history. Hence, a full factor design often does not realistically reflect the combined effect of plant species and land use history on soil properties. Therefore, we used a nested design (i.e., plant-species nested within land-use) to explore soil C and N dynamics in a previously cultivated old-field and in a typical steppe that was not cultivated. We compared variation in soil C and N parameters (top 10 cm of the soil profile) among plant species within the cultivated site and unculti-vated site with the overall variation between the cultivated site and uncultivated site.
K-strategic plant species adapted to stable environmental conditions (see Jiang et al.2010).
Methods
Study site
This study was conducted in Duolun County (42°02′N, 116°17′E, 1,324 m a.s.l.), Inner Mongolia, China. Mean monthly air temperature ranges from−17.5°C
in January to 18.9°C in July, with a mean annual temperature of 2.1°C. Mean annual precipitation (1958–2008) is 380 mm; 67% falls from June to August. The annual precipitation in 2007 (198 mm) was among the lowest values of the last 50 years, while the annual precipitation in 2008 (370 mm) was among the highest values of the last 50 years. The soil is classified as chestnut soils (Chinese classification) or Calcicorthic Aridisol in the USA Soil Taxonomy classification, with 63% sand, 20% silt, and 17% clay and mean pH is 6.84.
Experimental design
Within the research area, we selected an old-field (abandoned for 5 years; previously cultivated with Chinese oat,Avena chinensis) (hereafter referred to as the ‘cultivated site’) and, adjacent to the cultivated site, a typical steppe site (hereafter referred to as the ‘uncultivated site’). The cultivated and uncultivated sites used to be part of the same steppe area. Before 1978 the grassland area was not managed and the major disturbance resulted from antelope and rabbit grazing, and wildfire. Since the economic reforms and open-door policy in 1978, lands were opened to private use. The intensive farming, grazing and subsequent land-use changes resulted in reduced area of typical grasslands and severe land degradation
(Yuan et al.2005,2006). Since 1997, bans on grazing and farming have been carried out by the local government; e.g., the local government implemented the “Fence” project for grazing (e.g., grazing-free) and the “Grain for Green” project for farming (converting low-yield farmland to forest and pasture). The overall aim of these projects is to control soil erosion and combat desertification by restoring forest or grassland vegetation on degraded and‘desertified’ land (Chen et al.2009). Both in the cultivated and the uncultivated site mono-dominant plant species patches commonly occur (Jiang et al.2010).
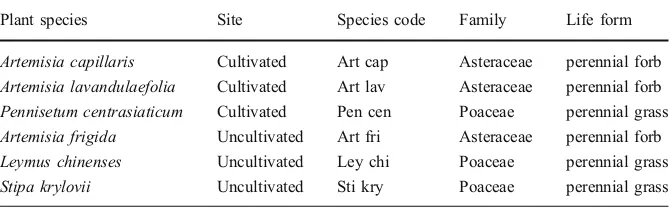
We selected mono-dominant plant patches for three of the dominant species at each of the two sites (Table 1), and we established 2×2 m plots in each patch. At the cultivated site we selected patches of
Artemisia capillaris (Art cap; C3 forb), Artemisia lavandulaefolia (Art lav; C3 forb), and Pennisetum centrasiaticum (Pen cen; C4grass) which are typical
species in abandoned agricultural land in northern China (Zhang 2005; Wang et al. 2009). At the uncultivated site we selected patches of Artemisia frigida (Art fri; C3forb),Leymus chinenses(Ley chi;
C3grass), andStipa krylovii(Sti kry; C3grass) which
are typical dominant plant species in steppe in this region (Bai et al. 2004). For each plant species we selected six randomly replicated patches which were at least 2 to 3 m apart from each other. Across all plant species, the patches were randomly distributed in the cultivated and uncultivated site, and all patches were distributed within 60 m. The soils in the study area are homogeneous (Jiang et al. 2010); hence, the pattern of historical land-use depended on ownership boundaries rather than on inherent soil properties.
Root, shoot, and litter biomass
We used a root in-growth method to determine belowground net primary production (BNPP). In
Plant species Site Species code Family Life form
Artemisia capillaris Cultivated Art cap Asteraceae perennial forb
Artemisia lavandulaefolia Cultivated Art lav Asteraceae perennial forb
Pennisetum centrasiaticum Cultivated Pen cen Poaceae perennial grass
Artemisia frigida Uncultivated Art fri Asteraceae perennial forb
Leymus chinenses Uncultivated Ley chi Poaceae perennial grass
Stipa krylovii Uncultivated Sti kry Poaceae perennial grass
Table 1 Plant species
April 2007 and 2008 respectively, in each plant patch, we collected two 40 cm-depth soil cores using an 8 cm diameter soil core sampler. We washed the roots from the soils over a 2 mm sieve, oven-dried the roots at 70°C for at least 48 h, and then weighed biomass. After that, the root-free soils were placed back into the hole they were collected from. We then collected roots in late October in 2007 and 2008, respectively, by using a 6 cm diameter soil core sampler at the center of the original root in-growth holes. The roots were washed from the soils, oven-dried at 70°C for at least 48 h, and weighed as BNPP. In August 2007 and 2008, at peak standing biomass, all living plant tissue as well as the litter was collected from two 1 m× 0.15 m rectangular subplots in each patch. Plant material and litter was oven-dried at 70°C for at least 48 h prior to being weighed. Plant material was analyzed for C and N concentration.
Soil analyses
In August in 2007 and 2008, three soil cores underneath each plant patch were collected using a metallic tube (10 cm in height and in 6 cm diameter). For each plant species, the three cores were bulked and air-dried for measurements of SOC and total soil N (see below).
Soil respiration–In August 2007 and 2008, a LI-8100 portable soil CO2 fluxes system (Li-Cor, Inc.,
Lincoln, NE, USA) was used to measure soil respira-tion. Soil respiration was measured once a week between 2:00 PM and 4:00 PM. One PVC collar (11 cm in diameter and 5 cm in height) was permanently inserted 2–3 cm into the soil at the center of each plot. Measurements were taken by placing the LI-8100 chamber on the PVC collars for 1–2 min. Living plants inside the soil collars were removed by hand at least one day before the measurement to eliminate aboveground plant respiration.
Soil net N mineralization –We used a PVC cores method (Raison et al.1987; Hook and Burke1995) to measure N mineralization. Briefly, in May, July and August 2007 and 2008, in each plant patch, two PVC tubes (5 cm diameter×12 cm long) were placed 10 cm into the ground. The PVC tubes were covered with plastic film to prevent water penetration and allow gas exchange. Prior to inserting the tubes, the litter was removed; litter was placed back after the PVC tubes were installed. Simultaneously, using similar PVC
tubes, two soil samples were collected in adjacent locations; the two samples were bulked and mixed and sieved through a 2-mm mesh. Subsamples were used to measure initial content of inorganic N (NH4+
-N and -NO3
--N), indicated as SInNI (SNO3
-NI and
SNH4+NI). After incubation for one month, the PVC
tubes were collected, and soil inorganic N was measured, indicated as SInNF (SNO3
-NF and
SNH4+NF). Net N mineralization (Rmin), nitrification
(Rnit) and ammonification (Ramm) rates were
calculat-ed as (SInNF- SInNI)/T, (SNO3-NF- SNO3-NI)/T and
(SNH4+NF- SNH4+NI)/T, where T was the incubation
period in days (Turner et al.1997).
Soil temperature, moisture, and bulk density – In each plant patch, adjacent to the PVC tubes soil temperature was measured twice in August 2007 and in August 2008. Soil temperature was measured at 10 cm depth using a thermocouple probe (Li-8100-201) connected to the LI-8100 at the same time of soil respiration measurements. One soil core (3 cm diameter, 10 cm depth) was collected weekly in each plant patch in May, July, and August 2007 and 2008, and then dried for 48 h at 105°C to determine soil moisture content. Soil bulk density was determined in August 2007 using a coring method (for details, see Wang et al. (2008)).
Plant, litter, soil, and microbial C and N–Plant C, and SOC content (g kg−1) were analyzed using a H
2SO4
-K2Cr2O7 oxidation method (Nelson and Sommers 1982). We calculated SOC and total N concentration (g cm−3) as: SOC (or total N) concentration = O
i× Bi×
103, where Oi is the mean SOC (or total N) content
(g kg−1) in the upper 10 cm of the soil profile. B
iis the
bulk density (g cm−3). Total N was analyzed using a
Kjeldahl digestion method with an Alpkem autoan-alyzer (Kjektec System1026 Distilling Unit, Sweden). NO3
--N and NH4 +
-N was extracted with 2 M KCl.
Statistical analysis
explained variation in soil C and N dynamics across plant patches in the cultivated and in the uncultivated site, we used stepwise multiple regressions, including mean August temperature and soil moisture, plant C, N and C/N, litter C, N and C/N, shoot biomass, root biomass, BNPP, litter biomass, and microbial biomass C, N and C/N. Linear correlations were run to test for relationships of soil temperature and soil moisture with soil inorganic N, nitrification rate, and ammonification rate. We ran regression analyses separately for 2007 and 2008, and separately for the cultivated site and the uncultivated site. For all ANOVAs, the assumption of normality was checked with Kolmogorov-Smirnov tests and the assumptions of homogeneity of variances were checked using Levene’s test. If the assumptions were not met, data were log-transformed prior to analysis. Statistical analyses were performed using SPSS, version 15.0 (SPSS Inc, Chicago, Illinois).
Results
SOC
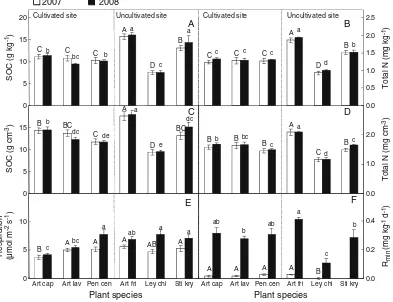
SOC content (g kg−1) was on average a little higher in
the uncultivated site than in the cultivated site. However, SOC content strongly varied depending on the plant species beneath which the soils were collected (Fig.1A), and plant species explained more of the variation in SOC content than did cultivation history (Table2). SOC content did not differ significantly between 2007 and 2008, and no significant interactive effects of year and plant species were observed (Table2). None of the plant or soil parameters correlated significantly with SOC content in the cultivated site, while in the uncultivated site there was a negative correlation with microbial biomass C/N in 2007 and a positive correlation with soil moisture in 2008 (Appendix1).
aA
Cultivated site Uncultivated site Cultivated site Uncultivated site
A
Sti kry Art cap Art lav Pen cen Art fri Ley chi Sti kry Art cap Art lav Pen cen Art fri Ley chi
Plant species
Fig. 1 Mean soil organic carbon (SOC) (A) and total N (B)
content (g kg−1), SOC (C) and total N (D) concentration (g m−3), soil respiration rate (E) and soil net N mineralization rate (F) (means ± SE;N=6) for soils (0–10 cm depth) under different plant species within land use histories (cultivated and unculti-vated). Date (mean ± s.e.) are shown for 2007 and 2008.
Uppercase and lower case letters indicate significant differences among species (Duncan’s hsd posthoc tests, P<0.05) in 2007 and 2008, respectively. Art cap =Artemisia capillaris; Art lav =
SOC concentration (g cm−3) did not differ between
the cultivated and uncultivated site (Table 2). How-ever, SOC concentration differed significantly depend-ing on the plant species beneath which the soils were
collected (Fig. 1C; Table 2). Plant species explained more of the variation in SOC concentration than did cultivation history (Table 2). SOC concentration did not differ significantly between 2007 and 2008, and no
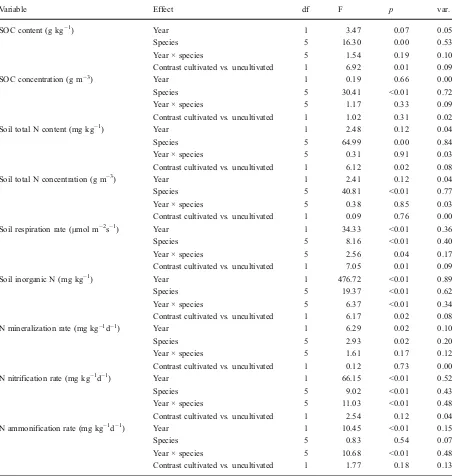
Table 2 Results from two-way ANOVAs testing effects of
plant species, year, and plant species × year on SOC content and concentration, total soil N content and concentration, soil respiration (R) and mean soil N mineralization rate (Rmin), soil
N nitrification rate (Rnit) and soil N ammonification rate (Rann).
Contrasts were specified for testing across-year differences between plant species from the cultivated site and plant species from the uncultivated site. The variance (var.) columns (Partial Eta Squared;η2) represent the proportion of variance explained
by the factor, calculated as the partial r2
Variable Effect df F p var.
SOC content (g kg−1) Year 1 3.47 0.07 0.05
Species 5 16.30 0.00 0.53
Year × species 5 1.54 0.19 0.10
Contrast cultivated vs.uncultivated 1 6.92 0.01 0.09
SOC concentration (g m−3) Year 1 0.19 0.66 0.00
Species 5 30.41 <0.01 0.72
Year × species 5 1.17 0.33 0.09
Contrast cultivated vs.uncultivated 1 1.02 0.31 0.02
Soil total N content (mg kg−1) Year 1 2.48 0.12 0.04
Species 5 64.99 0.00 0.84
Year × species 5 0.31 0.91 0.03
Contrast cultivated vs.uncultivated 1 6.12 0.02 0.08
Soil total N concentration (g m−3) Year 1 2.41 0.12 0.04
Species 5 40.81 <0.01 0.77
Year × species 5 0.38 0.85 0.03
Contrast cultivated vs.uncultivated 1 0.09 0.76 0.00
Soil respiration rate (μmol m−2s−1) Year 1 34.33 <0.01 0.36
Species 5 8.16 <0.01 0.40
Year × species 5 2.56 0.04 0.17
Contrast cultivated vs.uncultivated 1 7.05 0.01 0.09
Soil inorganic N (mg kg−1) Year 1 476.72 <0.01 0.89
Species 5 19.37 <0.01 0.62
Year × species 5 6.37 <0.01 0.34
Contrast cultivated vs.uncultivated 1 6.17 0.02 0.08
N mineralization rate (mg kg−1d−1) Year 1 6.29 0.02 0.10
Species 5 2.93 0.02 0.20
Year × species 5 1.61 0.17 0.12
Contrast cultivated vs.uncultivated 1 0.12 0.73 0.00
N nitrification rate (mg kg−1d−1) Year 1 66.15 <0.01 0.52
Species 5 9.02 <0.01 0.43
Year × species 5 11.03 <0.01 0.48
Contrast cultivated vs.uncultivated 1 2.54 0.12 0.04
N ammonification rate (mg kg−1d−1) Year 1 10.45 <0.01 0.15
Species 5 0.83 0.54 0.07
Year × species 5 10.68 <0.01 0.48
significant interactive effects of year and plant species were observed (Table2). Across sites and years, SOC concentration most strongly correlated to litter parame-ters and microbial biomass C/N (Appendix1).
Soil total N
Soil total N content (g kg−1) basically reflected the
pattern of SOC content: strong variation depending on the plant species beneath which the soils were collected (Fig. 1B), and plant species explained more of the variation in SOC content than did cultivation history (Table 2). Soil total N content did not differ signifi-cantly between 2007 and 2008, and no significant interactive effects of year and plant species were observed (Table2). None of the plant or soil parameters correlated significantly with soil total N content in the cultivated site, while in the uncultivated site there was a negative correlation with microbial biomass C/N and a positive correlation with soil moisture (Appendix1).
Soil total N concentration (g cm−3) reflected the
pattern of SOC concentration (Fig. 1D; Table 2). In 2007, in the cultivated site soil total N concentration was negatively correlated to BNPP and soil temper-ature, while in the uncultivated site soil total N concentration was negatively correlated to BNPP and root biomass, and positively to shoot biomass (Appendix1). In 2008, soil total N concentration in the cultivated site was negatively correlated to microbial biomass C/N and root biomass; no correlations were found for the uncultivated site (Appendix1).
Soil respiration
Soil respiration rate was on average 19% higher in the uncultivated site than in the cultivated site (Fig. 1E; Table2). However, plant species strongly affected soil respiration, and plant species explained more of the variation in soil respiration than did cultivation (Fig.1E; Table2). Soil respiration varied significantly interannually with on average 33% higher values in 2008 than in 2007 (Table 2, Fig. 1E). There were significant interactive effects of year and plant species (Table 2). In 2007, soil respiration was significantly positively correlated to plant root biomass in the cultivated site, while negatively correlated to microbial biomass C/N and positively correlated to soil temper-ature and litter N in the uncultivated site (Appendix1). In 2008, soil respiration was significantly positively
correlated to soil moisture and microbial biomass C in the cultivated site, while negatively correlated to litter C/N in the uncultivated site (Appendix1).
Soil inorganic N
Soil inorganic N was on average 23% higher in the uncultivated site than in the cultivated site. However, plant species strongly affected soil inorganic N, and plant species explained more of the variation in soil inorganic N than did cultivation (Fig.2A; Table.2). Soil inorganic N content was on average two-fold higher in 2008 than in 2007 (Fig.2A), and there were significant interactive effects of year and plant species (Table 2). In 2007, soil inorganic N was significantly positively correlated to soil moisture in the cultivated site, while no correlations with any plant or soil parameters were found in the uncultivated site (Appendix 1). In 2008, soil inorganic N was significantly positively correlated to microbial biomass N and soil temperature in the cultivated site, while negatively correlated to BNPP in the uncultivated site (Appendix1).
Soil net N mineralization rate
Overall, net N mineralization rate did not differ between the cultivated site and the uncultivated site, but plant species within sites strongly affected net N mineralization rates (Fig.1F, 2B; Table 2). Soil net N mineralization rates were much higher in 2008 than in 2007 (Fig. 1F, 2B), but no significant interactive effects of year and plant species were observed (Table2). In the cultivated site, soil net N mineralization rate was negatively correlated to microbial biomass C/N and positively correlated to litter biomass in 2007, while strongly positively correlated to litter C/N in 2008. No correla-tions were found for the uncultivated site (Appendix1).
Soil net N nitrification rate
in the cultivated site while negatively correlated to BNPP in the uncultivated site (Appendix1). In 2008, soil net N nitrification rate was positively correlated to microbial biomass C/N and negatively correlated to plant root biomass in the cultivated site while negatively correlated to soil bulk density in the uncultivated site (Appendix1).
Soil net N ammonification rate
Overall, net N ammonification rate did not differ between the cultivated site and the uncultivated site. Effects of plant species on net N nitrification rates varied interann-ually (Fig. 2D), resulting in a significant interaction between year and plant species (Table2). In 2007, no correlations were found between net N ammonification rate and plant and soil parameters. In 2008, soil net N ammonification rate was positively correlated to soil temperature and BNPP in the cultivated site and to litter C/N and C in the uncultivated site (Appendix1).
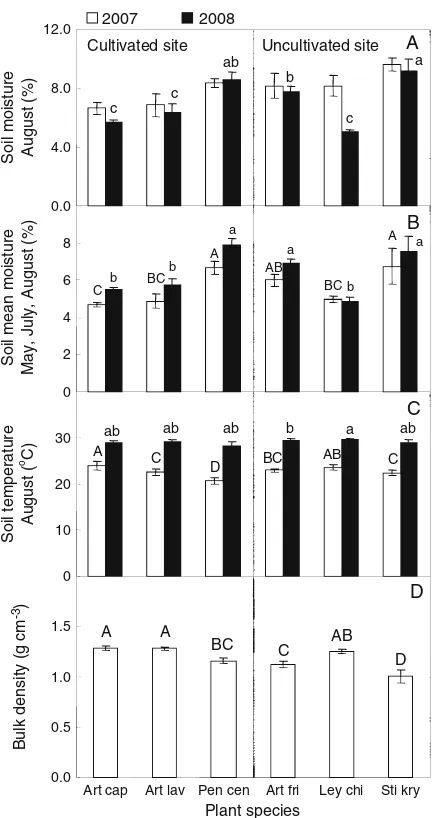
Soil moisture, soil temperature, and soil bulk density
Soil moisture content did not differ between the cultivated site and the uncultivated site, but signifi-cant differences among plant species within sites were observed (Fig. 3A, B; Appendix 3). Soil temperature did not differ among plant species (Fig. 3C; Appendix 3). Bulk soil density was on average higher in the cultivated site than in the uncultivated site, and significantly differed among plant species within sites (Fig.3D; Appendix3).
Plant and litter parameters
Detailed results for plant and litter parameters are presented in Appendix 2 and Appendix 3. Briefly, significant plant species differences were observed in shoot biomass, root biomass, BNPP, litter biomass, plant N, plant C/N, litter N, litter C/N. Overall, root biomass, plant N, and litter N were higher in the cultivated site than in the uncultivated site, while BNPP, litter biomass, and plant C/N were lower in the cultivated site than in the uncultivated site.
-0.2 -0.1 0.0 0.1 0.2 0.3 0.4
May July Aug May July Aug
C
-0.2 -0.1 0.0 0.1 0.2
May July
Aug May
July Aug
2007 2008
D
0.0 2.0 4.0 6.0 8.0 10.0
= Art cap
= Art lav
= Pen cen
= Art fri
= Ley chi
= Sti kry A
-0.2 0.0 0.2 0.4
May
July Aug May July Aug
B
Inorganic N
(mg
kg
-1 )
Rmin
(mg kg
-1
d
-1 )
Rnit
(mg kg
-1
d
-1 )
Ramm
(mg kg
-1
d
-1 )
Fig. 2 Soil inorganic N (A), soil N mineralization rate (B), soil
N nitrification rate (C), and soil N ammonification rate (D) in May, July, and August 2007 and 2008 (means ± SE;N=6). Art cap =Artemisia capillaris; Art lav =Artemisia lavandulaefolia; Pen cen = Pennisetum centrasiaticum; Art fri = Artemisia frigida; Ley chi =Leymus chinensis; Sti kry =Stipa krylovii
Discussion
We observed that soil surface C and N dynamics (top 10 cm of the soil) overall did not differ substantially between a previously cultivated old-field site and an uncultivated steppe site in a Chinese steppe ecosystem. However, we observed that soil C and N dynamics
differed depending on the plant species beneath the parameters were measured, both in the cultivated site and in the uncultivated site. We used the Var. index (sensu Burke et al. 1999) to evaluate effects of cultivation history and plant species on soil C and N dynamistic. In most cases, plant species explained substantially more of the variation of soil C and N dynamics than did cultivation history. For example, for SOC content, plant species accounted for 53% of the variation whereas cultivation history accounted for only 9% of the variation. Similar percentages were found for SOC concentration, soil total N content and concentra-tion, soil respiration and soil net N mineralization rate. Individual plant species differ in shoot and root biomass, litter chemistry, efficiency of nutrient acquisi-tion, and root exudation (Berendse 1998; Eviner et al. 2006), and microbial population structure, diversity, and activity (Perez et al.2004; Garbeva et al.2008). Hence, divergence in plant species composition resulting from land use history can modify or counteract direct impacts of land-use history on soil C and N cycling (Bardgett et al. 1999). In our study system, plant community composition diverged between the cultivated and uncul-tivated site (Jiang et al. 2010), and we showed strong effects of the dominant plant species on SOC, total N, soil respiration and soil net N mineralization rate.
SOC and soil total N content was overall a little higher in the uncultivated site than in the cultivated site. However, SOC and soil total N concentration did not differ between the two sites. This may be because we calculated SOC (and soil total N) concentration as SOC (and soil total N) content×soil bulk density. Increase in soil bulk density can persist for a long period of time after abandonment in cultivated soils, and can to some extent offset the differences observed in SOC and soil N concentration (Compton et al. 1998). Cultivation can readily induce an increase in soil bulk density (Wang et al. 2008; Wang et al. 2009). In our study, the 0–10 cm soil bulk density in the cultivated site was significantly higher than in the uncultivated site (Fig. 3; Appendix 3). Importantly, we however found that plant species accounted for 72% of the variation in SOC concentration and 77% of the variation in soil total N concentration while land-use history only accounted for 2% of the variation in SOC concentration and for less than 1% of the variation in soil total N concentration (Table2). Stepwise multiple regressions showed that the most important factors accounting for variation in SOC and a
Soil moisture August (%)
2008
Art cap Art lav Pen cen Art fri Ley chi Sti kry
Plant species
Bulk density (g cm
-3)
May, July, August (%)
B
Cultivated site 2007
Fig. 3 Mean soil moisture in August 2007 and 2008 (A), mean soil
soil total N differed between the cultivated site and the uncultivated site, including root and shoot biomass, microbial factors, as well as soil temperature and soil moisture. This suggests that the dominant plant species (which differed between the cultivated and uncultivated site) regulated soil physiochemical properties, for example via differences in the quantity and quality of litter they return back into the soil (Berendse1998; Eviner et al.2006).
We observed that soil respiration, which includes both autotrophic and heterotrophic respiration, was on aver-age lower in the cultivated site than in the uncultivated site. Lower plant root biomass in the cultivated site (1,533 and 1,646 g m−2in 2007 and 2008, respectively)
may be one of the reasons for low soil respiration. Indeed, we found that soil respiration was significantly correlated with root biomass. Moreover, higher root biomass in the uncultivated site probably increased fine root turnover and labile C sources in the rooting zone, which could have resulted in greater soil respiration in the 0–10 cm deep soil layer (Baer et al.2002; Camill et al.2004). Higher microbial biomass in the uncultivated site than in the cultivated site (Jiang et al.2010) could be one other reason for increases of soil respiration in the uncultivated site. We found that soil respiration correlat-ed with soil microbial biomass, which could be relatcorrelat-ed to the loss of organic matter in cultivated soils. The availability of carbon substrates and soil respiration has been shown to be correlated (Golchin and Asgari2008). Water availability controls soil microbial activity and thus can affect the rates of N cycling (e.g., Nicolardot et al. 1994, 2001). In our study, higher soil net N mineralization rates in 2008 than in 2007 could indeed be explained by variation in soil moisture (Appendix5); precipitation was substantially higher in 2008 (370 mm) than in 2007 (198 mm). Wang et al. (2009) found that the optimum soil moisture of net mineralization rate was 25–35% which indicated that soil moisture could have limited soil net N minerali-zation rate in our dry steppe ecosystem. Soil inorganic N content, nitrification rate, and ammonification rate were also higher in 2008 than in 2007.
Previous studies in European and North-American grasslands and heathlands have shown that individual plant species can strongly influence net N mineraliza-tion and nitrificamineraliza-tion rates (Van der Krift and Berendse 2001; Eviner et al. 2006). Similarly, for the Chinese steppe ecosystem, we found strong plant species effects on net N mineralization and nitrification rates. Using
stepwise regressions we showed that different plant parameters, such BNPP and litter C/N and biomass explained significant amounts of variation in mineral-ization and nitrification rates. Linear correlations also showed relationships of soil moisture and temperature (which both varied among plant species) with net N mineralization and nitrification rates (Appendix 4, 5). Finally, plant species effects on soil microbial biomass (Jiang et al.2010) also explained some of the variation in net N mineralization and nitrification rates. Together, these results indicate that plant, soil microbial and soil physical properties collectively, and probably interac-tively, affect soil N cycling.
Contrary to previous studies in other ecosystems (Baer et al. 2002; Camill et al. 2004; Angus et al. (2006); Fraterrigo et al. 2006), we did not find any overall effects of cultivation history on net N mineralization, nitrification or ammonification rate in the Chinese steppe. However, we acknowledge that our experimental design was suboptimal for testing effects of cultivation history, i.e., we had no replicated cultivated and uncultivated sites. Hence, further studies are needed to explore the relatively importance of cultivation history and plant species in affecting soil C and N dynamics.
Conclusions
Our study shows that plant species have a strong influence on total pools of SOC and soil total N, soil respiration and net N mineralization rate, and that shifts in plant dominance patterns may be the predominant factor controlling C and N dynamics after land-use change. Indeed, plant species can modulate resource input to the soil as well as soil micro-climatic conditions, which both can affect the functioning of soil microbial communities, and hence, soil ecosystem processes. Similar to what has been suggested for effects of climate change (Kardol et al.2010), this implies that accurate assessments of effects of land-use history on soil C and N dynamics require incorporating the concurrent changes in plant community composition.
Acknowledgements This research was supported by the State
.
Appendix 1 Stepwise multiple regressions of SOC, soil
respiration, soil total N, soil inorganic N, N mineralization rate, nitrification rate, and ammonification rate with biotic and abiotic factors. Rmin= N mineralization rate; Rnit= nitrification
rate; Ramm= ammonification rate. Shown are only those factors
that affected soil C or N significantly (P<0.05). Regressions were run separately for 2007 (A) and 2008 (B)
Parameter Cultivated site Uncultivated site
Explanatory factor partial r2 F P Explanatory factor partial r2 F P
A (2007)
SOC (g kg−1) / / / / microbial biomass C/N
−0.76 51.78 <0.001
shoot biomass 0.05 4.6 0.049
SOC (g cm−3) litter C/N
−0.29 6.25 0.019 litter biomass −0.77 55.78 <0.001
soil moisture 0.20 5.9 0.028
shoot biomass 0.23 11.49 0.004
Soil respiration (μmol m−2s−1) root biomass 0.37 9.39 0.007 microbial biomass C/N −0.36 8.94 0.009
soil temperature 0.28 11.45 0.004
litter N 0.12 6.70 0.022
Soil total N (g kg−1) / / / / microbial biomass C
−0.40 19.65 0.001
soil moisture 0.29 6.64 0.020
Soil total N (mg cm−3) BNPP
−0.28 6.36 0.023 BNPP 0.55 19.45 0.000
soil temperature −0.23 7.28 0.017 shoot biomass 0.16 8.38 0.011
microbial biomass C −0.12 4.67 0.049 root biomass −0.12 9.95 0.007
litter C −0.12 7.26 0.018
Soil inorganic N (mg kg−1) soil moisture 0.28 6.31 0.023 / / / / Rmin(mg kg−1d−1) microbial biomass C/N −0.24 5.18 0.037 / / / /
litter C/N 0.23 6.64 0.021 / / / /
Rnit(mg kg−1d−1) microbial biomass C/N −0.32 7.68 0.013 BNPP −0.3282 7.33 0.016
litter biomass 0.21 6.85 0.0194
Ramm(mg kg−1d−1) / /
B (2008)
SOC (g kg−1) / / / / soil moisture 0.83 33.14 0.001
plant C/N 0.08 6.16 0.048
SOC (g cm−3) / / / / microbial biomass C/N
−0.74 19.95 0.003
litter C/N 0.14 7.15 0.037
Soil respiration soil moisture 0.88 53.38 0.000 litter C/N −0.55 8.39 0.023
microbial biomass C 0.06 7.51 0.034
Soil total N (g kg−1) / / / / microbial biomass C/N 0.88 53.84 0.000
soil moisture 0.07 8.28 0.028
Soil total N (g cm−3) / / / / microbial biomass C/N
−0.89 58.63 0.000
root biomass −0.07 9.93 0.020
Soil inorganic N (mg kg−1) microbial biomass N 0.65 13.44 0.008 BNPP -0.76 22.81 0.002
soil temperature 0.22 11.33 0.015
Rmin(mg kg−1d−1) litter C/N 0.71 17.49 0.004 / / / /
BNPP −0.18 10.14 0.019 / / / /
plant C/N 0.09 21.12 0.006 / / / /
plant C 0.02 13.05 0.023 / / / /
bulk density 0.00 35.61 0.009 / / / /
Rnit(mg kg−1d−1) microbial biomass N 0.46 6.07 0.043 bulk density −0.48 6.54 0.038
root biomass −0.27 6.03 0.050
Ramm(mg kg−1d−1) soil temperature 0.66 13.35 0.008 litter C/N 0.75 18.09 0.005
AB A C C BC B
0 20 40 60
Art cap Art lav Pen cen Art fri Ley chi Sti kry
Plant species
Art cap Art lav Pen cen Art fri Ley chi Sti kry
Plant species
Appendix 2 Shoot biomass (A), root biomass (B), BNPP (C),
litter biomass (D), plant C concentration (E), plant N concentration (F), plant C/N (G), litter C concentration (H), litter N concentration (I) and litter C/N concentration (means ± SE; N=6). Uppercase letters indicate significant differences among species using Duncan (P<0.05) in 2007; Lowercase
Appendix 3 Result from ANOVA testing effects of plant species, year, and plant species × year on plant and litter parameters, and on soil moisture, soil temperature, and bulk
density. Contrasts were specified for testing across-year differ-ences between plant species from the cultivated site and plant species from the uncultivated site. Shown are F andp-values
Variable Effect df F p
Shoot biomass (g m−2) Year 1 93.94 0.000
Species 5 3.94 0.040
Year × species 5 4.80 0.001
Contrast cultivated vs.uncultivated 1 1.58 0.210
Root biomass (g m−2) Year 1 11.49 0.001
Species 5 27.96 0.000
Year × species 5 8.74 0.000
Contrast cultivated vs.uncultivated 1 33.01 0.000
BNPP (g m−2) Year 1 1.42 0.238
Species 5 24.00 0.000
Year × species 5 17.04 0.000
Contrast cultivated vs.uncultivated 1 7.47 0.008
Litter biomass (g m−2) Year 1 1.43 0.236
Species 5 25.81 0.000
Year × species 5 6.92 0.000
Contrast cultivated vs.uncultivated 1 24.17 0.000
Plant C (%) Year 1 10.33 0.003
Species 5 0.66 0.656
Year × species 5 2.78 0.029
Contrast cultivated vs.uncultivated 1 0.96 0.331
Plant N (%) Year 1 7.43 0.009
Species 5 54.79 0.000
Year × species 5 0.19 0.964
Contrast cultivated vs.uncultivated 1 15.24 0.000
Plant C/N Year 1 38.66 0.000
Species 5 115.79 0.000
Year × species 5 7.78 0.000
Contrast cultivated vs.uncultivated 1 15.46 0.000
Litter C (%) Year 1 8.43 0.006
Species 5 1.92 0.111
Year × species 5 1.80 0.133
Contrast cultivated vs.uncultivated 1 1.52 0.223
Litter N (%) Year 1 0.13 0.716
Species 5 57.87 0.000
Year × species 5 1.20 0.324
Contrast cultivated vs.uncultivated 1 5.08 0.028
Litter C/N Year 1 0.13 0.716
Species 5 57.87 0.000
Year × species 5 1.20 0.324
Contrast cultivated vs.uncultivated 1 2.67 0.108
Soil moisture (%) Year 1 7.01 0.010
Species 5 10.60 0.000
Year × species 5 2.22 0.063
Contrast cultivated vs.uncultivated 1 4.61 0.085
Soil temperature (°C) Year 1 319.86 0.000
Species 5 3.21 0.012
Year × species 5 0.89 0.495
Contrast cultivated vs.uncultivated 1 0.51 0.478
Bulk density (g cm−3) Species 5 10.92 0.000
R2= 0.0965
P= 0.07
0.0 1.0 2.0 3.0 4.0
2007
A
R2= 0.0107 P > 0.05
-0.08 0.00
15 20 25 30
Soil temperature (°C) Soil temperature (°C)
D R2= 0.3148
P= 0.00
-0.04 0.00 0.04
B
R2= 0.5018
P= 0.00
-0.01 0.01 0.03 0.05
C
R2= 0.0005
P> 0.05
0.0 2.0 4.0 6.0 8.0 2008
E
R2= 0.0576
P> 0.05
-0.03 0.02 0.07
15 20 25 30
H R2= 0.0575
P> 0.05
0.0 0.2 0.4 F
R2= 0.0214
P> 0.05
0.0 0.2 0.4 G
Inorganic N (mg kg
-1)
Inorganic N (mg kg
-1)
Rmin
(mg kg
-1 d -1)
Rmin
(mg kg
-1 d -1)
Rnit
(mg kg
-1 d -1)
Rnit
(mg kg
-1 d -1)
Ramm
(mg kg
-1d -1)
Ramm
(mg kg
-1d -1)
-0.02
-0.04
-0.06
Appendix 4 Correlation of soil inorganic N (A, E), soil N mineralization rate (B, F), soil N nitrification rate (C, G), and soil N
R2= 0.1612
P= 0.015 0.0
1.0 2.0 3.0 4.0
A
R2= 0.0003
P> 0.05 -0.08
-0.06 -0.04 -0.02 0.00
2 4 6 8 10
D R2= 0.1555
P= 0.02
0.04 0.00 0.04
B
R2= 0.2981
P= 0.00
-0.01 0.01 0.03 0.05
C
R2= 0.0225 P > 0.05
-0.03 0.02 0.07
2 4 6 8 10 12
H R2= 0.042 P > 0.05
0.0 0.2 0.4 F
R2= 0.1039 P = 0.06
0.0 0.2 0.4 G R2= 0.2102
P= 0.01 0.0 2.0 4.0 6.0 8.0 E
Inorganic N (mg kg
-1)
Inorganic N (mg kg
-1)
Rmin
(mg kg
-1 d -1)
Rmin
(mg kg
-1 d -1)
R
nit
(mg kg
-1 d -1)
Rnit
(mg kg
-1 d -1)
Ramm
(mg kg
-1 d -1)
Ramm
(mg kg
-1 d -1)
Soil moisture (%) Soil moisture (%)
Appendix 5 Correlation of soil inorganic N (A, E), soil N mineralization rate (B, F), soil N nitrification rate (C, G), and soil N
References
Angus JF, Bolger TP, Kirkegaard JA, Peoples MB (2006) Nitrogen mineralisation in relation to previous crops and pastures. Aust J Soil Res 44:355–365
Baer SG, Kitchen DJ, Blair JM, Rice CW (2002) Changes in ecosystem structure and function along a chronosequence of restored grasslands. Ecol Appl 12:1688–1701 Bai YF, Han XG, Wu JG, Chen ZZ, Li LH (2004) Ecosystem
stability and compensatory effects in the Inner Mongolia grassland. Nature 43:181–184
Bardgett RD, Mawdsley JL, Edwards S, Hobbs PJ, Rodwell JS, Davies WJ (1999) Plant species and nitrogen effects on soil biological properties of temperate upland grasslands. Funct Ecol 13:650–660
Berendse F (1998) Effects of dominant plant species on soils during succession in nutrient-poor ecosystems. Biogeo-chemistry 42:73–88
Burke IC, Lauenroth WK, Riggle R, Brannen P, Madigan B, Beard S (1999) Spatial variability of soil properties in the shortgrass steppe: the relative importance of topography, grazing, microsite, and plant species in controlling spatial patterns. Ecosystems 2:422–438
Camill P, McKone MJ, Sturges ST, Severud WJ, Ellis E, Limmer J, Martin CB, Navratil RT, Purdie AJ, Sandel BS, Talukder S, Trout A (2004) Community- and ecosystem-level changes in a species-rich tallgrass prairie restoration. Ecol Appl 14:1680–1694
Chen XG, Zhang XQ, Zhang YP, Wan CB (2009) Carbon sequestration potential of the stands under the Grain for Green Program in Yunnan Province, China. Forest Ecol Manag 258:199–206
Compton JE, Boone RD (2000) Long-term impacts of agriculture on soil carbon and nitrogen in New England forests. Ecology 81:2314–2330
Compton JE, Boone RD, Motzkin G, Foster DR (1998) Soil carbon and nitrogen in a pine-oak sand plain in central Massachusetts: Role of vegetation and land-use history. Oecologia 116:536–542
De Deyn GB, Cornelissen JH, Bardgett RD (2008) Plant functional traits and soil carbon sequestration in contrast-ing biomes. Ecol Let 11:516–531
Degryze S, Six J, Paustian K, Morris SJ, Paul EA, Merckx R (2004) Soil organic carbon pool changes following land-use conversions. Global Change Biol 10:1120–1132 Ehrenfeld JG, Ravit B, Elgersma K (2005) Feedback in the
plant-soil system. Annual Rev Environ Res 30:75–115 Eviner VT, Chapin FS III, Vaughn CE (2006) Seasonal
variations in plant species effects on soil N and P dynamics. Ecology 87:974–986
Foster D, Swanson F, Aber J, Burke I, Brokaw N, Tilman D, Knapp A (2003) The importance of land-use legacies to ecology and conservation. BioScience 53:77–88 Fraterrigo JM, Balser TC, Turner MG (2006) Microbial
community variation and its relationship with nitrogen mineralization in historically altered forests. Ecology 87:570–579
Garbeva P, van Elsas JD, van Veen J (2008) Rhizosphere microbial community and its response to plant species and soil history. Plant Soil 302:19–32
Golchin A, Asgari H (2008) Land use effects on soil quality indicators in north-eastern iran. Aust J Soil Res 46:27–
36
Grandy AS, Robertson GP (2006) Initial cultivation of a temperate-region soil immediately accelerates aggregate turnover and CO2 and N2O fluxes. Global Change Biol
12:1507–1520
Hook PB, Burke IC (1995) Evaluation of methods for estimating net nitrogen mineralization in a semiarid grassland. Soil Sci Soc Am J 59:831–837
IPCC (2001) In: Ding Y, Griggs DJ, Noguer M, Van der Linden PJ, Dai X, Maskell K, Johnson CA, Houghton JT (eds) Climate change 2001: The scientific basis. Cambridge University Press, Cambridge
Jiang LL, Han XG, Zhang GM, Kardol P (2010) The role of plant–soil feedbacks and land-use legacies in restoration of a temperate steppe in northern China. Ecol Res 25:1101–1111
Kardol P, Cregger MA, Campany CE, Classen AT (2010) Soil ecosystem functioning under climate change: plant species and community effects. Ecology 91:767–781
Krogh L, Noergaard A, Hermansen M, Greve MH, Balstroem T, Breuning-Madsen H (2003) Preliminary estimates of contemporary soil organic carbon stocks in Denmark using multiple datasets and four scaling-up methods. Agr Ecosyst Environ 96:19–28
Luo YQ, Zhou XH (2006) Soil respiration and the environ-ment. Elsevier, San Diego
Matlack GR (1994) Plant species migration in a mixed-history forest landscape in eastern North America. Ecology 30:223–233
McLauchlan K (2006) The nature and longevity of agricultural impacts on soil carbon and nutrients: A review. Ecosys-tems 9:1364–1382
Motzkin G, Foster DR, Allen A, Harrod J, Boone R (1996) Controlling site to evaluate history: vegetation patterns of a New England sand plain. Ecol Monogr 66:345–
365
National Statistics Bureau of China (2002) China Statistics Year book 2002. Beijing, China Statistical Press, 6
Ministry of Environmental Protection of the People’s Republic China (2004). Natural Resource Bulletin 2003
Nelson D, Sommers L (1982) Dry combustion method using medium temperature resistance furnace. In: Page AL et al (eds). Methods of soil analysis. Part 2. Chemical and microbial properties, 2nd edn. Soil Science Society of America and American Society of Agronomy Book Series No.9: 539–579
Nicolardot B, Fauvet G, Cheneby D (1994) Carbon and nitrogen cycling through soil microbial biomass at various temperatures. Soil Biol Biochem 26:253–261
Nicolardot B, Recous S, Mary B (2001) Simulation of C and N mineralization during crop residue decomposition: a simple dynamics model based on the C:N ratio of the residue. Plant and Soil 228:83–103
Perez CA, Carmona MR, Aravena JC, Armesto JJ (2004) Successional changes in soil nitrogen availability, non-symbiotic nitrogen fixation and carbon/nitrogen ratios in southern Chilean forest ecosystems. Oecologia 140:617–
Raison R, Connell M, Khanna PK (1987) Methodology for studying fluxes of soil mineral-N in situ. Soil Biol Biochem 19:521–530
Six J, Elliott ET, Paustian K, Doran JW (1998) Aggrega-tion and soil organic matter accumulaAggrega-tion in cultivated and native grassland soils. Soil Sci Soc Am J 62:1367–1377
Turner CL, Blair JM, Schartz RJ, Neel JC (1997) Soil N and plant responses to fire, topography, and supplemental N in tallgrass prairie. Ecology 78:1832–1843
Van der Krift TAJ, Berendse F (2001) The effect of plant species on soil nitrogen mineralization. J Ecol 89:555–
561
Vitousek PM, Matson PA, Van Cleve K (1989) Nitrogen availability and nitrification during succession: primary, secondary and oldfield seres. Plant Soil 115:229–239 Wang ZP, Han XG, Li LH (2008) Effects of grassland
conversion to croplands on soil organic carbon in the temperate Inner Mongolia. J Environ Manage 86:529–534 Wang Q, Zhang L, Li L et al (2009) Changes in carbon and nitrogen of chernozem soil along a cultivation
chronose-quence in a semi-arid grassland. Eur J Soil Sci 60:916–
923
Wu RG, Tiessen H (2002) Effect of land use on soil degradation in alpine grassland soil, China. Soil Sci Soc Am J 66:1648–1655
Yuan ZY, Li LH, Han XG, Huang JH, Jiang GM, Wan SQ (2005) Soil characteristics and nitrogen resorption in
Stipa krylovii native to northern China. Plant Soil 273:257–268
Yuan ZY, Li LH, Han XG, Chen SP, Wang ZW, Chen QS, Bai WM (2006) Nitrogen response efficiency increased mono-tonically with decreasing soil resource availability: a case study from a semiarid grassland in northern China. Oecologia 148:564–572
Zhang JT (2005) Succession analysis of plant communities in abandoned croplands in the eastern Loess Plateau of China. J Arid Envir 63(2):458–474