SNAPSHOT SPECTRAL AND COLOR IMAGING USING A REGULAR DIGITAL
CAMERA WITH A MONOCHROMATIC IMAGE SENSOR
J. Hauser 1 *, V. A. Zheludev 2,3, M. A. Golub 1, A. Averbuch 2, M. Nathan 1, O. Inbar 1, P. Neittaanmäki 3, and I. Pölönen 3.
1
School of Electrical Engineering, Faculty of Engineering, Tel Aviv University, Ramat Aviv, Tel Aviv 69978, Israel - (hauserjo, mgolub, mnathan)@ post.tau.ac.il, [email protected]
2
School of Computer Science, Faculty of Exact Sciences, Tel Aviv University, Ramat Aviv, Tel Aviv 69978, Israel - (zhel, amir1)@ post.tau.ac.il
3
Faculty of Information Technology, Jyväskylä University, Jyväskylä FI-40014, Finland - (pekka.neittaanmaki, ilkka.polonen)@jyu.fi
Commission III, WG III/4
KEY WORDS: Multispectral and hyperspectral imaging, Imaging systems, Computational Imaging.
ABSTRACT:
“Spectral imaging” (SI) refers to the acquisition of the three-dimensional (3D) spectral cube of spatial and spectral data of a source object at a limited number of wavelengths in a given wavelength range. “Snapshot spectral imaging” (SSI) refers to the instantaneous acquisition (in a single “shot”) of the spectral cube, a process suitable for fast changing objects. Known SSI devices exhibit large total track length (TTL), weight and production costs and relatively low optical throughput. We present a simple SSI camera based on a regular digital camera with (i) an added diffusing and dispersing “phase-only” static optical element at the entrance pupil ("diffuser") and (ii) tailored compressed sensing (CS) methods for digital processing of the diffused and dispersed (DD) image recorded on the image sensor. The diffuser is designed to mix the spectral cube data spectrally and spatially and thus to enable convergence in its reconstruction by CS-based algorithms. In addition to performing SSI, this SSI camera is capable to perform color imaging using a "monochromatic" or "gray-scale" image sensor without color filter arrays.
1. INTRODUCTION
“Spectral imaging” (SI) refers to the acquisition of the three-dimensional (3D) spectral cube of spatial and spectral data of a source object at a limited number of wavelengths in a given wavelength range. SI has a multitude of applications in many fields (Brady, 2009), including biology (Garini et al., 2006), medicine (Uhr et al., 2012), food inspection (Long et al., 2005), archaeology, art conservation (Lang, 2012), astronomy and remote sensing (Foster et al., 2006). SI with mosaic spectral filter arrays on the image sensor (Themelis et al., 2008) leads to substantial light gathering losses. In "staring" or "pushbroom" SI systems (Carlsohn, 2006), removable sets of narrow band-pass filters (Long et al., 2005) or time-sequential dynamic spectral filters (López-Álvarez et al., 2008) slow the SI process and cannot apply it to dynamic, fast changing objects. Modern trends in digital imaging (Brady, 2009) resort to a generic combination of optics with digital processing and to compressed sensing (CS) (Donoho, 2006, Candès et al., 2006) for various purposes and applications. CS-based algorithms already have many applications in astronomy, biology, medicine, radar and seismology (Stern et al., 2008, Willet et al., 2011). “Snapshot spectral imaging” (SSI) refers to the instantaneous acquisition of the spectral cube, a process suitable for fast changing objects. There are several known SSI devices/architectures that demonstrate the progress and high potential of SSI. In particular, the Coded Aperture Snapshot Spectral Imager (CASSI) (Wagadarikar et al., 2008) designs use an intermediate image plane and a coded aperture. The coded aperture can be a binary mask, a gray-scaled coded mask (Rueda-Chacon et al., 2013), or a spatial-light modulator (Yuan et al., 2015). These designs yield 2D coded measurements on the sensor array, from which the spectral cube is reconstructed using CS algorithms. * Corresponding author
The need for intermediate image formation optics (in addition to regular components of a digital camera) in several of the referenced devices, increases the total track length, the weight and the production costs of such SSI devices. In order to convert a regular digital camera to an SSI camera for arbitrary objects, we resort here to (i) a diffusing and dispersing "phase-only" static optical element at the entrance pupil, and (ii) tailored CS methods for digital processing of the diffused and dispersed (DD) image recorded on the image sensor. The limited volume of data in the DD image acquired by a 2D image sensor in a single snapshot poses a problem for the reconstruction of a 3D spectral cube. To overcome this limitation and to enable SSI, we resort to compression of spatial data in multispectral images with the aid of CS-based reconstruction algorithms. The diffuser is designed to mix the spectral cube data spectrally and spatially and thus to enable convergence in its reconstruction by CS-based algorithms. We demonstrate the feasibility of reconstructing experimental SSI images with a relatively straightforward linear iterative process of "split Bregman iterations" (SBI) (Goldstein et al., 2009, Cai et al., 2009).
2. SPECTRAL IMAGING WITH A DISPERSIVE DIFFUSER
2.1 Continuous Model of the Optical System
Figure 1. Optical scheme of a spectral and color imaging optical system based on a digital camera and a diffuser.
To succeed in image reconstruction, modern CS theory requires a highly randomized system response. Classical spectroscopic systems comprise a dispersive optical element like a prism or a diffraction grating. In order to minimize the required number of optical elements and to restrict our imager design to a modification of standard digital cameras, we decided to combine dispersive and diffusing properties required from the added optical element in a single diffuser. We assume that the entrance pupil is located in front of the imaging lens. The diffuser is positioned at the “pupil domain”, i.e., entrance pupil or the system aperture of the imaging lens and works as a random dispersing element that provides the DD image at the monochromatic image sensor. A digital processor processes the DD image to reconstruct a plurality of monochromatic images (i.e., the spectral cube) of the source object through iterative CS-based algorithms.
While the diffuser was designed for wavelength
l
des, other wavelengths in the entire spectral range are incident on it. The diffuser (Golub et al., 2016) is designed as a thin phase optical element with linear dimensions Du¢´Dv¢, whose grooves arefabricated of a transparent material with refractive index
n
( )
l
and providing a phase function
j
(
u
¢
, ;
v¢l
)
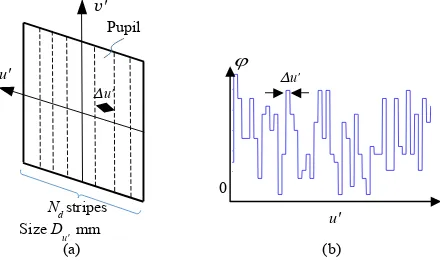
. The design choice for the diffuser’s phase function was a randomly permutated, nonlinear saw-tooth phase. Figure 2 illustrates a portion of the diffuser's phase profile. The diffuser provides wavelength-dependent light diffusion and accordingly serves also as an inherent disperser. Therefore, it provides spectral multiplexing along with spatial multiplexing.Figure 2. (a) Dimensions of the diffuser, scaled to exit pupil coordinates; (b) fragment of a randomized piecewise-constant
phase function of the diffuser.
We assumed that before introduction of the 1D diffuser, the imaging system was spatially shift invariant and its optical resolution was matched to the sensor pixel pitch. When installed
into the SI optical system, the diffuser modifies the system pupil function of the entire SI optical system towards
(
,
;
)
e p
x
(
,
;
)
.
P
u
¢
v¢l
=
é
ë
i
j
u
¢
v¢l
ù
û
(1)Accordingly, the coherent PSF can be calculated as an inverse Fourier transform
(
)
(
)
(
)
; 1
, ; , exp 2 d d
; sinc ,
u x y
h x y P u i u
i R R
D
h x y
R
l p
l l l
l l
¢
¢
¢ æ ¢ ¢+ ¢ö ¢
¢ ¢ = ¢ ç ÷ ¢
è ø
æ ö
¢ ç ¢÷
è ø
ò
v
v
v v
=
(2)
where h x
(
¢;l)
is the 1D version of h x y(
¢, ';l)
, R is the distance from the center of the exit pupil to the image sensorand sinc( )x sin(px) px
= . Accordingly, the 1D incoherent PSF
associated with the diffuser at wavelength l is
(
;
)
(
;
)
2.
Ih
x
¢
l
=
h x
¢
l
(3)The diffuser converts the original image into a DD image with programmed blur for each object point. For each wavelength, the intensity I¢
(
x y¢, ;l
)
of the DD image in presence of thediffuser may be expressed by just a 1D convolution I¢=hI ÄI
of the ideal ("non-dispersed") image I x y
(
, ;l
)
with the incoherent PSF hI(
x;l
)
¢ . The convolution is calculated
separately for each coordinate y of the object as
(
, ;
)
I(
) (
, ;
)
d .
I x y
¢ ¢
l
=
ò
h x - x ;
¢
l
I x y
l
x
(4)2.2 Discretization
Mathematical formulations for digital image processing obviously require a transfer from continuous coordinates and wavelengths of optics to discrete indices of vectors and matrices. To define spatial sampling, we consider the discrete pixelated structure of the image sensor, which is characterized along x and y axes by a 2D spatial pitch
x y
d ´d , a number
,
x y
N N of pixels, and a number Nb of bits per pixel. The
imaging zoom has to match the blur caused by the PSF of the diffuser such that the entire DD image stays within the aperture of the image sensor, i.e. within Nx pixels in each row and Ny
pixels in each column. The “non-diffused-non-dispersed” image obtained without a diffuser at same zoom is spread to a lesser degree, and occupies accordingly only a smaller number
x
N
<
N
of pixels located in the central part of each imagesensor row. Even though the number Ny´Nx of sensed pixels
may be smaller than the number of voxelsNy´N´L in the
targeted 3D spectral cube, we refer the CS approach that enables restoration of the entire spectral cube with reasonable accuracy. The spectral cube uses a finite number L of spectral bands with central wavelengthsll, l=1,L out of the entire continuous
stripes
d
N mm
u'
D Size
Pupil
∆u' v'
u'
(a)
-3 -2 -1 0 1 2
0
∆u' j
wavelength range. A discrete version of the spectral cube in each
where spectral cube voxels can be expressed as
( )
(
)
Equation (4) is converted into a discrete convolution applied separately to each of Ny image rows. Discrete pixels of the DD image at the
l
th contribution of polychromatic light to discrete pixels of the DD image is denoted as ( )jl L. At each image pixel, the sum can be expressed as
( )
(
)
where non-negative numbers kl characterize the overall relative
spectral sensitivity of the image sensor and the optical transmission of the optical components of the system at wavelength ll, and where sensitivity of the optical system. For mathematical considerations, it is convenient to concatenate the spectral and vertical spatial dimensions of the spectral cube to a matrix X with dimensionsN L N´ y,
such that each spectral dimension is described by a sub-matrix Xl of
size N N´ y. We define an
N
x´
N L
dimensional block Toeplitzwavelength and features the randomization originating from the diffuser. The 2D DD image is represented as a matrix
Y
of sizeX is a single column vector from the concatenated spectral cube to be reconstructed from the single column sensed vector ( )j
Y . Matrix
Xrepresents the spectral data to be reconstructed from DD image
Y
.
Equation (8) can now be expressed in matrix form as the multiplication of a vector of length N L over a matrix of sizex
N
´
N L
. Themultiplication results in a vector of a smaller lengthNx
Y
( )j=
A
X
( )j.
(13)as customary in CS theory.
2.3 Sparse Representation and Reconstruction
Equation (14) provides the CS model for our spectral imaging system. It shows that the recorded DD image Y includes a linear mixture of spectral and spatial data of the entire spectral cubeX, as described by the sensing matrix
A
.
The CS problem consists of the reconstruction of matrix X in such a way that Equation (14) with a given matrix Ybecomes satisfied. The number Nx´Ny of equations for Yin
Equation (14) is less than the number of unknown variables N L N´ y
fact that typical 2D digital images have a sparse representation in wavelet and wavelet-frame domains. Consequently, spectral cubes, which are collections of monochromatic images, possess the same property, i.e. they can be represented by collections of sparse matrices that contain many zeros. Therefore, in accordance with the CS theory, we look for a solution of Equation (14) that is maximally sparse in a wavelet-frame domain. The mathematical relation between spectral cube matrix X and its sparse representation d (having only a relatively small number of non-zero elements) can be represented as a linear transform d=DX, with a ”sparsifying” matrix D. Then, d is the transform coefficients array. The sparse representation may be implemented by resorting to the 2D frame transforms (Averbuch et al., 2014). Another option is the 3D wavelet transform, where the 2D transforms are applied to the monochromatic images and 1D transform is applied to the cube comprised of the 2D transform coefficients matrices along the spectral dimension. The spectral-dimension wavelet transform provides an additional sparseness of the representation because spectra in each pixel are changing smoothly from one band to another. For the wavelet transforms, the biorthogonal wavelets derived from the discrete splines of 12-th order were utilized (Averbuch et al., 2014). We denote by Ythe matrix of the inverse 2D (3D) frame (wavelet) transform, such that spectral cube X can be restored from its sparse representation d by
.
=
Y
X
d
(15)Equation (14) can be expressed in the form
,
feasibility for reconstruction of sensible solution of Equation (16) for a special case of K-sparse matrices or vectors dthat have only K non-zero elements. It is known that the K-sparse sensible solution d of Equation (16) (and consequently X of Equation (14)) exists and can be reconstructed for a class of matrices Qthat satisfy a RIP condition oforder K. The RIP condition of order K in CS (Candès et al, 2006) demands that any sub-matrix of Q formed by less than K columns
must satisfy the inequality:
order to reconstruct the sparse representation d of the spectral cube X
from the DD image Y, we resorted to split Bregman iterations (SBI) (Goldstein et al., 2009, Cai et al., 2009). Specifically, d was reconstructed as a solution of the following constrained minimization problem:
M we mean the Frobenius norm, and the l1 norm is
The minimization problem is equivalent to minimization of a functional
1 2 2
where µ,c are Lagrange weight coefficients.. In particular, coefficient
c weights the sparsity level of d, and coefficient µ weights the fit of
AX toY. Following (Shen, 2010), a closed loop of the iterative algorithm uses a feedback from the l1 error and a shrinking operation that ensures a sparse reconstruction. In more detail, the minimization of the functional in Equation (20) is performed by an iterative process:
(
)
(
)
(
)
vectors used to execute iterations, AT denotes a transposed matrix A
,
d
b =1,d
c =1 and(
)
( )
(
)
shrink
x
,
g
=
sgn
x
max
x
-
g
, 0
(22)is the function applied to each vector component. The iterations are
terminated once the inequality
2
l
AX Y- £s is achieved, or after a
given number of iterations. The parameter sis determined by the noise
level on the sensor array.
3. EXPERIMENTAL OPTICAL ARRANGEMENT AND CALIBRATION
The concept of our CS-based SSI camera was proven for L=33 wavelength bands in an optical experiment that used a regular digital camera equipped with a monochromatic (without color filters array) image sensor, a diffuser, and specialized digital image processing capabilities, as shown in Figure 1. A color iPad screen served as an object. The experimental arrangement included the following optical components: a regular digital camera with a 5 Megapixel, 12-bit Aptina Demo kit (Aptina, 2015) monochromatic image sensor, a DSL935 Sunex imaging lens with a numerical aperture (NA) value of approximately 0.17, and a wide bandpass spectral filter for the entire visible range. The image sensor had 2592 x 1944 pixels with a pixel pitch of
d
x =d
y= 2.20µm. Even though our generic hardware andsoftware enable large dimensions, we performed our experiments with spectral cubes of size 256 256 33
y
N ´N´L= ´ ´ pixels. The
The actual diffuser design used in our experiments had a 3.2mm clear aperture that matched the entrance pupil and includedNd= 400,
u
D =8µm wide stripes, as illustrated in Figure 2.
In order to obtain a more accurate model of our physical system, we performed direct calibration of the SSI camera by direct point-spread function (PSF) measurements thatprovided the sensing matrix. An object with single thin white vertical column displayed on the iPad screen was imaged in the dark at several spatial positions in each spectral band. Separated spectral bands for the calibration were achieved by resorting to a set of L=33 Thorlabs narrow-bandpass 10nm FWHM spectral filters that covered the 400-720nm wavelength range in equal gaps of 10nm and which were mechanically integrated in filter wheels. To have a firm reference for spectral cube reconstruction in our experiments, we conducted direct reference measurements of the spectral cube of size
256 256 33
y
N ´N´L= ´ ´ for the object of interest. In
addition, spectral calibration procedure was performed in order to correct non-ideal aspects, such as the white line's spectrum used for the PSF measurements and the non-uniform transmittance of the bandpass filters.
4. OPTICAL EXPERIMENT FOR SPECTRAL IMAGING
An exemplary "Color Checker" test object was used, among others, for optical SSI experiments. This was created on the iPad screen mounted on the optical bench in the arrangement of Figure 1, at a fixed distance of 88cm in front of the imaging lens. The reference spectral cube measurements, the PSF measurements and the grayscale snapshots of the DD image were recorded on the image sensor in the dark, with the diffuser in place. The digital reconstruction of the spectral cube was performed using the SBI process with a measured sensing matrix
A
and optimized iteration parametersµ,c . Two reconstruction methods were considered: 1) 2D frame transforms of the monochromatic images, 2) 3D wavelet transforms of the spectral cubes. For this, the biorthogonal wavelet and tight and semi-tight frame transforms derived from polynomial and discrete splines were tested. The diverse libraries of such transforms were designed in (Averbuch et al., 2014). The experimental results demonstrated below are produced by using the 2D semi-tight frame transform derived from the quasi-interpolating polynomial splines and the biorthogonal 3D wavelet transform derived from the twelfth-order discrete splines.Quality evaluation of the reconstructed spectral cube X was done by comparison to the reference spectral cube X, which was measured directly with the set of L=33 bandpass filters. We expressed the normalized root-mean-square errors (RMSE) of the full spectral cube as
( ) ( )
1 2 2
, ,
1 1 1 max max
1
,
y j j
N
N L
i l i l
i j l
y
X
X
RMSE
NN
L
= = =X
X
ì
é
ù
ü
ï
ï
=
í
ê
-
ú
ý
ê
ú
ï
ë
û
ï
î
þ
ååå
(23)where max ( )
, , ,
max
=
jl l j i i
X
X
and max ( ), , ,
max
=
jl l j i i
X
X
. Then, wecalculated the peak signal-to-noise ratio (PSNR) as
10
20log (
).
PSNR
=
-
RMSE
(24)Similarly, we have performed a quality evaluation of the monochromatic images per each wavelength, the spectra per each spatial coordinate and the RGB image, all derived from the
reconstructed spectral cube. The RGB conversion was done in accordance with the CIE standard observer color matching functions implemented by Matlab function “RGB_from_Spectral_cube” (Foster, 2017).
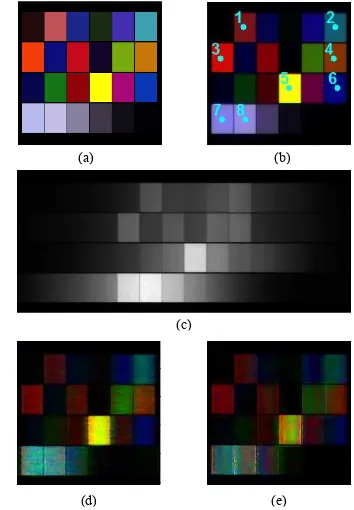
Figure 3 shows images that correspond to the "Color Checker" object. Figure 3(a) shows the original object displayed on the iPad, Figure 3(b) shows the RGB image calculated from direct measurements with the 33 bandpass filters, and Figure 3(c) shows the DD image recorded at the monochromatic image sensor with 10.6ms integration time. Note that this time is substantially smaller than the 80.8 x 33=2666 ms needed for use of 33 bandpass filters, for a given peak signal of 90% of the sensor's saturation level. Such small integration time provides one major advantage of SSI over time-sequential acquisition methods. Figure 3(d) and 3(e) show the RGB images built from the reconstructed spectral cubes, obtained with the 2D framelet and 3D wavelet reconstruction methods, respectively.
Figure 3. Object "color checker" with the 33 spectral bands in the range of 400nm-720nm: (a) iPad object; (b) reference spectral cube directly measured with 33 spectral filters and converted to RGB format; (c) dispersed and diffused (DD)
image optically recorded at the image sensor; (d), (e), reconstructed spectral cubes converted to RGB format, obtained
with 2D framelet and 3D wavelet methods, respectively.
The calculated PSNR (RMSE values in brackets) values of the spectral cubes obtained with the 2D framelet reconstruction method are 26.13 (0.05), and for the 3D wavelet reconstruction method are 28.38 (0.038). For the RGB images, the calculated PSNRRGB (RMSERGB values in brackets) values of the obtained with the 2D framelet reconstruction method are 17.67 (0.049), and for the 3D wavelet reconstruction method are 15.92 (0.16). Figure 4 shows five out of 33 monochromatic images extracted from the spectral cubes at wavelengths 450 nm, 540 nm, 570 nm, 610 nm and 650 nm. Figure 4(a) shows the original, Figures 4(b) and 4(c) and show the images that correspond the 2D framelet reconstruction and 3D wavelet reconstruction methods, respectively. Figure 4(d) shows the RMSEλ values per wavelength,
while Figure 4(e) shows the PSNRλ values per wavelength, for the
monochromatic images obtained with the 2D framelet (blue) and 3D wavelet (dashed green) reconstruction methods.
(a) (b)
(c)
Figure 4. Five out of 33 monochromatic “Color Checker” images extracted from the spectral cubes at wavelengths 450nm, 540nm, 570nm, 610nm and 650nm: (a) reference measured with spectral filters; (b) reconstructed images using the 2D framelet and (c) 3D wavelet methods, respectively. (d) RMSEλ and (e)
PSNRλ values as functions of wavelength for the
monochromatic images that were CS reconstructed using the 2D framelet method (blue) and 3D wavelet method (dashed green).
Figures 5 and 6 show reference and reconstructed spectra and RGB values, respectively, at eight spatial sampling points, marked by the same numbers as in Figure 3(b).
4000 500 600 700
Figure 5. Spectra at chosen pixels of reference (red), 2D framelet (blue) and 3D wavelet reconstructed (dashed green) of
the “Color Checker” with the 33 spectral bands in the range of 400nm-720nm. Position of pixels as in Figure 3(b).
Some shifts and missing peaks in the spectra and RGB values could be caused by a mismatch between the measured sensing matrix and the actual physical sensing matrix of the optical system with the diffuser, as well as due to the presence of actual noise in the experimental system. The PSNRi,j (RMSEi,j in brackets) values of the spectra at the marked points 1-8 for the 2D framelet transform are 10.24 (0.31), 11.2 (0.28), 11.74 (0.26), 11.99 (0.25), 15.52 (0.17), 12.11 (0.25), 10.83 (0.29) and 10.48 (0.3), whereas for the 3D wavelet transform the values are 14.34 (0.19), 14.26 (0.19), 15.72 (0.16), 11.08 (0.27), 14.31 (0.19), 17.73 (0.13), 11.56 (0.26) and 10.21 (0.31). To conclude, the 3D wavelet method exhibits smaller error for the entire spectral cube compared to the 2D framelet method. In particular, it yields an improvement in the spectral reconstruction in certain spatial coordinates. It is, however, inferior in the reconstruction quality of some of the monochromatic
wavelength images, as well as in the quality of the reconstructed RGB image.
Figure 6. Calculated RGB values from spectra at chosen pixels of reference (cyan), 2D framelet reconstructed (purple) and 3D wavelet reconstructed (pink) of the “Color Checker" object.
Position of pixels as in Figure 3(b).
5. SIMULATIONS WITH SPECTRAL CUBE OBTAINED WITH VTT SPECTRAL IMAGER
In order to expand the analysis of the suggested concept, we have performed computer simulations using a spectral cube obtained with a VTT spectral imager prototype. This spectral imager, provided by Jyväskylä University (JyU), is integrated with a piezo-driven Fabri-Perot Interferometer (FPI), which enables time sequential scanning of the spectral domain, in the range of 400-1000 nm. The spectral cube was acquired from the human skin tissue with a suspected Melanoma tumor. A method to delineate the skin area affected by a tumor using the VTT spectral imager was reported in (Zheludev et al., 2015). The spectral cube's original dimensions, which was imaged in the 460-850nm range, were 1200´1920´120. In order to incorporate the skin spectral data into the above computational scheme and, at the same time, to significantly reduce the noise inherent in the data, the following preprocessing operations were carried out: 1) The original cube was spatially cropped to the size 1024´1024´120and padded by zeros to a cube of size sub-cube LLL, which presents a smoothed and down-sampled by factor of 4 copy of the cube CRC, was selected for further
processing. Recall that the last three planes of the sub-cube LLLcomprise all zeros.
(a)
(b)
(c)
450nm 540nm 570nm 610nm 650nm
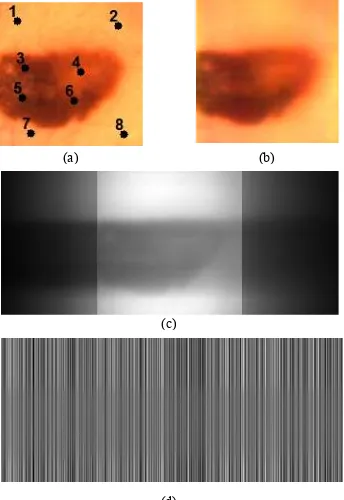
Figure 7. "Skin Tissue" with 30 spectral bands in the range of 460nm-850nm: (a) pseudo-color representation of the spectral cube measured with the VTT spectral imager; (b) pseudo-color
representation of the reconstructed spectral cube; (c), (d) simulated dispersed and diffused image with and without
Randomizer, respectively.
Figure 8. Five out of 30 monochromatic “Skin Tissue” images extracted from the spectral cubes at wavelengths 509.53nm, 609.16nm, 643.59nm, 763.86nm and 832.96nm: (a) reference
measured with the VTT spectral imager; (b) reconstructed monochromatic images from the simulation. (c) RMSEλ and (d)
PSNRλ values as functions of band number for the
monochromatic images.
The sensing matrix
A
was generated by performing theoretical PSF calculation in the wavelengths of interest, assuming that our system is equipped with a nominal phase profile diffuser. The sensor imageY
was calculated according to Equation (14) and multiplied with a matrixR
consisting of randomly distributed plus- and minus-ones. Correspondingly, columns of the sensing matrixA
were multiplied by the matrixR
. Ourassumption that the reduction of the sensing matrix coherency can improve the reconstruction results, was corroborated by the simulations. For the simulation, we used the 2D framelet reconstruction method. Figure 7(a) shows pseudo-color representation of the "Skin Tissue" reference spectral cube. Figure 7(b) shows the pseudo-color representation built from the reconstructed spectral cube, obtained with the 2D framelet reconstruction method. Figure 7(c) shows the simulated DD image
Y
=
A
X
,
while Figure 7(d) shows the randomized DD imageRY
.
The calculated PSNR (RMSE values in brackets) values of the spectral cube are 27.59 (0.042). Figure 8 shows five out of 30 non-zero monochromatic images extracted from the spectral cube at wavelengths 509.53nm, 609.16nm, 643.59nm, 763.86nm, 832.96nm. Figure 8(a) shows the original and Figure 8(b) shows the reconstructed images. Figure 8(c) shows the RMSEλ values per wavelength, while Figure 8(d) shows the PSNRλvalues per wavelength.
500 600 700 800
Figure 9. Spectra at chosen pixels of reference (red) and reconstructed (dashed black) of the “Skin Tissue” with the 33 spectral bands in the range of 460nm-850nm. Position of pixels
as in Figure 7(a).
Figure 9 shows reference and reconstructed spectra at eight spatial sampling points, marked by same numbers as in Figure 7(a). The PSNRi,j (RMSEi,j in brackets) values of the spectra at the marked points 1-8 are 25.07 (0.056), 26.77 (0.046), 21.86 (0.081), 24.78 (0.058), 20.61 (0.093), 25.11 (0.056), 30.27 (0.03) and 26.99 (0.045).
6. DISCUSSION AND CONCLUSIONS
We showed experimentally and by simulations the feasibility of snapshot spectral imaging with a regular digital camera complemented by a minor hardware addition in the form of a single phase-only static diffuser. Our phase-modulation architecture removes the need for intermediate image plane optics and/or spatial light modulators. This can lead to a real miniaturization of SSI cameras, thus providing significant advantages in applications where weight, volume and/or price are critical. The key element of our optical system is a diffuser designed to create a randomized sensing matrix built from calibration measurements of the PSF. The use of a monochromatic sensor, instead of a regular mosaic color sensor, increases the captured light amount and, therefore, the sensitivity of the camera. Successful acquisition of RGB images by a fully monochromatic image sensor is another important result.
Our method relies substantially on spatial and spectral mixing at the image sensor and subsequent reconstruction of the spectral cube with CS-based algorithms. It demonstrated the ability to reconstruct both spectral and spatial data from spatial-only data acquired by a monochromatic image sensor. This is achieved by proper use of the sparsity property, naturally attributed to photographic images. We believe that one of the major advantages in our reported development is the resorting to specific wavelet and frame transforms designed in
500 550 600 650 700 750 800 0
(Averbuch et al., 2014), which provide the efficient conversion of the spectral cubes into their sparse representation.
Results of this work may have applications in miniaturized snapshot spectral imagers of dynamic objects in such fields as remote sensing and astronomy, biology, environmental studies, agriculture, food and drug inspection, automotive and vehicle sensors, medical diagnostics, photographic and video cameras, smartphones, wearable devices and augmented reality.
ACKNOWLEDGEMENTS
This research was partially supported by the Israel Ministry of Science, Technology and Space no. 3-13601.
REFERENCES
Aptina Imaging Demo kits, 2015.
https://www.onsemi.com/PowerSolutions/product.do?id=MT9P 031 (30 July, 2017).
Averbuch A., Neittaanmäki, P. and Zheludev .V., 2014. "Spline and spline wavelet methods with applications to signal and image processing" Vol. 1: Periodic splines, Springer.
Brady, D. J., 2009. Optical Imaging and Spectroscopy, Wiley-Interscience.
Cai, J. F., Osher, S. and Shen, Z., 2009. "Split Bregman methods and frame based image restoration", Multiscale Modeling and Simulation: A SIAM Interdisciplinary Journal 8, 337-369.
Carlsohn, M. F., 2006. "Spectral image processing in real-time," J. Real Time Image Processing 1, 25-32.
Candès, E. J., Romberg, J. K. and Tao, T., 2006. "Stable signal recovery from incomplete and inaccurate measurements", Communications on Pure and Applied Mathematics 59, 1207–1223.
Dabov, K., Foi,A., Katkovnik,V. and Egiazarian,K., 2007. “Image denoising by sparse 3D transform-domain collaborative filtering,” IEEE Trans. Image Process., vol. 16, no. 8, pp. 2080-2095.
Donoho, D. L.. 2006. "Compressed sensing", IEEE Trans. Inform. Theory, 52, 1289–1306.
Foster, D. H., Amano, K., Nascimento, S.M.C. and Foster, M.J., 2006. "Frequency of metamerism in natural scenes", Journal of the Optical Society of America, A 23, 2359-2372.
Foster, D. H., 2017.
http://personalpages.manchester.ac.uk/staff/d.h.foster/Tutorial_ HSI2RGB/Tutorial_HSI2RGB.html (July 10, 2017).
Garini, Y., Young, I. T. and McNamara, G., 2006. "Spectral imaging: Principles and applications", Cytometry Part A, Special Issue: Spectral Imaging. 69A, pp 735-747.
Goldstein., T. and Osher, S., 2009. "The split Bregman method for l1 regularized problems", SIAM Journal on Imaging Sciences, 2, 323-343.
Golub, M. A., Averbuch, A., Nathan, M., Zheludev, V. A., Hauser, J., Gurevitch, S., Malinsky, R. and Kagan, A., 2016. "Compressed sensing snapshot spectral imaging by a regular
digital camera with an added optical diffuser", Applied Optics 55 (3), 432-443.
Gorman, A., Fletcher-Holmes, D. W. and Harvey, A. R., 2010. “Generalization of the Lyot filter and its application to snapshot spectral imaging,” Opt. Express 18, 5602–5608.
Lang, H., 2012. "Advances in multispectral and hyperspectral imaging for archaeology and art conservation", Applied Physics 106, 309-323.
Long, R. L., Walsh, K. B. and Greensill, C. V., 2005. "Sugar imaging of fruit using a low cost charge-coupled device camera," J. Near Infrared Spectroscopy 13, 177-186.
López-Álvarez, M. A., Hernández-Andrés, J. and Romero, J., 2008. "Developing an optimum computer-designed multispectral system comprising a monochrome CCD camera and a liquid-crystal tunable filter," Appl. Opt. 47, 4381-4390.
Rueda-Chacon, H., Calderón, G. A. R. and Fuentes, H. A., 2013. “Spectral selectivity in compressive spectral imaging based on grayscale coded apertures”, IEEE XVIII Symposium of Image, Signal Processing, and Artificial Vision (STSIVA), Bogota, Colombia, 978-1-4799-1121-9/13.
Shen, Z., 2010. “Wavelet frames and image restorations”, Proceedings of the International Congress of Mathematicians, R. Bhatia, Hindustan Book Agency, Vol. IV, pp. 2834–2863.
Stern, A., Rivenson, Y., and Javidi, B., 2008. "Optically compressed image sensing using random aperture coding", in Proceedings of the SPIE, 6975, 69750D-69750D-10.
Themelis, G., Yoo, J., and Ntziachristos, V., 2008. “Multispectral imaging using multiple-bandpass filters”, Opt. Lett. 33, 1023–1025.
Uhr, J. W., Huebschman, E.P. Frenkel, Lane, N.L., Ashfaq, R., Liu, H., Rana, D.R., Cheng, L., Lin, A.T., Hughes, G.A., Zhang, X.J. and Garner, H.R., 2012. "Molecular profiling of individual tumor cells by hyperspectral microscopic imaging", Translational Research 159, 366-375.
Wagadarikar, A., John, R., Willett, R. and Brady, 2008. D., "Single disperser design for coded aperture snapshot spectral imaging",. Appl. Opt. 47, B44-B51.
Willet, R. M., Marcia, R. F., and Nichols, J. M., 2011. "Compressed sensing for practical optical imaging systems: a tutorial", SPIE, Optical Engineering 50, 072601-1-13.
Yuan, X., Tsai, T. H., R. Zhu, Llull, P., Brady, D. J., and Carin, L., 2015. “Compressive Hyperspectral Imaging with Side Information,” IEEE J. of Selected Topics Signal Processing 9, 964-976.