Volume 24, Number 1, 2009, 1 – 21
GLOBAL RECESSION AND ASIAN GROWTH:
EXPERIENCE AND PROSPECTS
1John Malcolm Dowling
University of Hawaii ([email protected])
ABSTRACT
The paper outlines current macroeconomic developments in industrial countries and explains how slower growth in these economies is being transmitted to developing economies in Asia. The macroeconomic outlook for industrial countries in 2009 is discussed along with the transmission mechanism that has brought the global downturn to the Asian economies. Monetary and fiscal policy adjustments in Asian economies have been implemented to address the downturn in economic activity and these policies are discussed in some depth. All the major countries in East Asia, Southeast Asia and South Asia are analysed. The paper concludes with a brief review of the outlook for 2010. Keywords: global recession, monetary and fiscal policy, Asian economies, economic
outlook
INTRODUCTION1
The rapid deterioration in economic growth in industrialized countries that began in late 2007 and continued and intensified in 2008 has created additional challenges for the developing economies of Asia. Further economic stress in the industrial world is anticipated in 2009 and 2010. The IMF (IMF, 2009) has recently made a downward revision in its forecast for economic growth in industrial countries for 2009. All the major industrial countries will experience negative growth according to the IMF. -2.8 percent for the UK, -2.6 percent for Japan, -2.5 percent for Germany and -1.6 percent for the United States. This would be the first time since World War II that GDP in the major advanced economies declined. While inflationary forces have moderated in industrial countries there has been a continued deterioration in
employ-1 Editorial assistance of Maribeth Boritzer and Yap Chin
Fang is appreciated.
ment, consumption and investment. The unemployment rate in the United States has increased in the past year from 4.2 percent in January 2008 to 7.6 percent in January 2009 and some economists are predicting that it could reach 10 percent. Stock market averages have declined. The Dow Jones has fallen nearly 50 percent in the 16 months, closing in mid February 2009 at below 7500, down from a peak of over 14,164 on October 9, 2007. In Japan, fourth quarter 2008 growth was the weakest since 1974 and a sharp rise in unem-ployment toward 5 percent is anticipated com-bined with low rates of capacity utilization.
inventory and downward pressure on housing prices does suggest a revival in the housing sector toward the end of 2009 or early 2010. A package announced by the government in the middle of February should also lower mortgage costs for those who are experiencing the stress of mortgage payments which are unsustainable relative to income.
When combined with the consumer debt bubble and toxic asset challenge that developed over the past few years, the housing crisis highlights the complicated nature of the recession in the United States and, to a lesser extent, in the rest of the industrial countries. The problems are potentially more intractable than the crisis in Sweden which is often alluded to as a successful bank clean up. Not only is there a crisis in the US banking sector but also in non bank financial intermediaries including hedge funds and investment banks that were part of the securitization of these home mortgages. The unwinding of this securitization bubble has been a major challenge that has yet to be fully resolved. While $668 billion in mortgages were securitized in 2007 the figure dropped to only $40 billion in 2008. Many of these bundled assets are risky and, more troubling, the extent of that risk is hard to determine. This makes valuation of these assets and clearing the balance sheets of banks more difficult. While households accumulated debt at a rapid rate since 2000 the rate of accumulation of private sector financial debt was even more rapid . In order to adjust to this debt build up of households, consumption has to decline and savings have to increase. This process has already begun as the household savings rate has rise to nearly 4 percent in 2008 after being negative in 2007. For much of the pos-war period it was 8 percent in the United States and it could go even higher in 2009 and 2010 (see Economist 2009). While this rebalancing will improve the balance sheet of consumers, it does not help corporate America with the
process of undertaking new investment. This is where government fiscal stimulus comes in to take up the slack with infrastructure and other spending programs as well as tax relief to convince businesses and consumers to begin spending again.
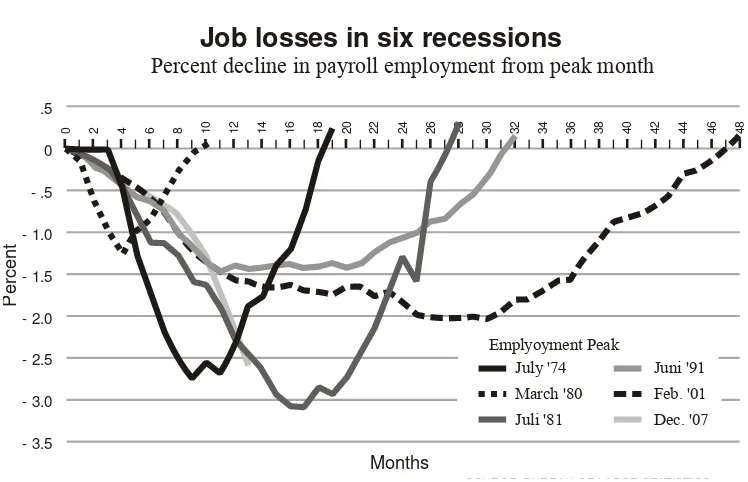
It is difficult to predict how low this recession will last; when it will bottom out and when industrial economies will return to full employment of labor and capital resources. If it follows the pattern of the 1981 – 1982 recessions, the deepest but not the longest post war recession, it will be 28 months from the beginning of the decline in employment until the economy reaches its pre- recession level of payroll employment. It could be as long as 4 years (see Figure 1). In the analysis that follows we focus on 2009, with a short anecdote on possible developments in 2010.
Job losses in six recessions
Percent decline in payroll employment from peak month
0 2 4 6 8 10 12 14 16 18 20 22 24 26 28 30 32 34 36 38 40 42 44 46 48
.5
0
- .5
- 1.0
- 1.5
- 2.0
- 2.5
- 3.0
- 3.5
P
e
rcent
Months
SOURCE: BUREAU OF LABOR STATISTICS Emplyoyment Peak
July '74 March '80 Juli '81
Juni '91 Feb. '01 Dec. '07
Figure 1. Job losses in the current and five previous United States recessions
IMPACT ON DEVELOPING ASIA
As this paper is being written in early March 2009 the global financial crisis continues to deepen. While Asian banks have limited exposure to the toxic mortgage assets that have undermined confidence in industrial countries, slower growth in the USA and Europe are expected to take a toll on growth in developing economies of Asia. According to the IMF 2008 export growth of emerging economies, including other economies in Latin America, Africa and Middle East, is also expected to falter to -0.8 percent in 2009 after growing at a rate of 9.6 percent in 2007 and 5.6 percent in 2008, primarily as a result of reduced import demand in industrial countries. This translates into slower growth in Asia in 2009 and perhaps 2010.
In its analysis of the unfolding crisis in October 2008 IMF 2008 did not believe that this slowdown in Asia will be as severe as the 2001/2002 recession and certainly not as severe as the Asian financial crisis of 1997/98 which took a much larger toll on economic growth. If the fallout from the ongoing global
financial crisis is of similar magnitude to the Asian crisis, then poverty and chronic poverty in Asia will escalate sharply.
Some observers believe the global recession will have a modest impact on Asia. Even the most pessimistic projections of global growth by the IMF in late 2008 (IMF, 2008a) still showed expected global growth of 3 percent and a 70 percent confidence interval of growth between 2 percent and 4 percent. While this is not business as usual it does not reflect a serious downgrading of growth pros-pects in 2009. And if growth is not going to be that much slower then other macroeconomic variables including unemployment, tax revenues and spending on poverty reduction are also not likely to be seriously threatened.
However recent developments in the early part of 2009 suggest that the global recession is more serious that previously believed. The recession has deepened sharply in the United States toward the end of 2008 and in the first months of 2009. James et al., 2008, Appendix scenario 3 made a forecast at the end of 2008 which presents a scenario showing negative
growth in the US, Japan and the Eurozone. The implications for growth in Asia are shown in Column 4 of Table 1. The Asian Develop-ment Bank (2008) notes that the slowdown in the import demand of the US, Europe and Japan is particularly acute for clothing, footwear and computers. At the beginning of November 2008 the IMF further lowered its forecast for global economic growth from 3 percent to 2.2 percent (IMF, 2008a). Further revisions are possible and the more recent forecasts by Citibank (Citibank 2008 and a management consulting firm, CLSA (CLSA 2008) as well as Consensus Economics (Con-sensus Economics, 2008), a firm that compiles forecasts by many different companies. These forecasts are shown in Columns 5, 6 and 7 in Table 1. The consensus forecast reported for data compiled in December 2008 predicts somewhat higher growth than James et al.,(2008), CLSA (2008) and Citibank (2008) forecasts are somewhat lower, with forecasts of negative growth for many countries in Asia in 2009. Whereas James et al., (2008) shows only Singapore with negative growth, all of the East Asian NICs are predicted to expe-rience negative growth in 2009 by both CLSA (2009) and Citibank (2009) whereas Southeast
Asia will fare a little better. Only Thailand and Malaysia are forecast to experience negative growth in the CLSA forecast. There are few forecasts for South Asia, which will probably do reasonably well because of their relative trading isolation from the rest of the world. The IMF recently made revisions of its forecasts made in its World Economic Outlook in October 2008 (IMF, 2009). The forecast contains country forecasts for China, India and Asean-5 (Indonesia, Malaysia Phi-lippines, Singapore, Thailand and Vietnam) for 2009 and 2010. The 2009 forecasts are displayed in the final column of Table 1 and the 2010 forecasts are displayed in Table 5.
While it is still unclear how severe the global recession will be as well as the extent of the downturn in developing Asian economies, some additional insights can be gained by considering the relationship between labor market outcomes in the current downturn and previous recessions. These are displayed for the United States in Chart 1. The current downturn tracks well with the severe recession which began in July 1981. In that recession, it was more than two years before payroll employment returned to its pre-recession level.
Table 1. Projected Macroeconomic GDP Growth in Selected Asian Economies
Country 2006 2007 2008 2009 ADB
2009 Citibank
2009 CLSA
2009 Consensus Economics
2009-IMF
China 11.7 11.9 10.0 6.12 7.6 5.5 8.1 6.7 Korea 5.1 5.0 4.6 0.96 -1.8 -1.7 2.8 Taiwan 4.9 5.7 4.2 4.6 -0.7 -2.7 2.5 Hong Kong 7.0 6.4 4.5 1.30 -2.2 -1.7 1.4 Indonesia 5.5 6.3 6.2 3.36 3.8 2.2 4.7 Malaysia 5.8 6.3 5.6 3.05 0.5 -1.2 3.3 Philippines 5.4 7.2 4.5 2.31 3.0 1.2 3.6
Thailand 5.1 4.8 5.0 5.0 1.0 -1.4 3.4 Singapore 8.2 7.7 4.2 -1.52 -2.8 -2.6 -1.0
India 9.6 9.0 7.4 5.65 5.5 5.3 6.6 5.1 Vietnam 8.2 8.5 6.5 6.0* 5.2 3.5 5.7
ASEAN-5 2.7
TRANSMISSION TO DEVELOPING COUNTRIES IN ASIA
What are the ways that recession in industrial countries is transmitted to deve-loping countries in Asia? There are three major ways. The first is investment in toxic assets that arose from the sub-prime lending crisis in the United States and to a lesser extent in Great Britain. High risk mortgages were bundled and sold with other mortgages to banks and other investors around the world. As the home loan mortgage bubble burst in the United States the riskiness of these assets increased and their prices fell. Banks and other investors holding these assets suffered large losses and confidence in financial systems around the world was shaken. Stock market values tumbled. The second is by withdrawal of investments in Asian equity markets by US firms as a strategy for reducing portfolio risk. The third is by a general decrease in import demand in industrial countries which trans-lates into a decline in Asian exports (See James et al., 2008 for detailed discussion of these three transmission mechanisms).
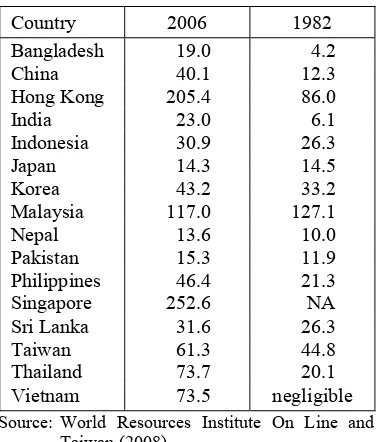
Developing Asian economies have been most affected by a decline in demand for its exports as well as withdrawal of funds from equity markets. Both have created stress throughout the region. To appreciate the extent of this impact on Asia it is important to recognize that the Asian region is even more closely integrated with the global economy than it was a decade or two ago (see Table 2). Many countries now have export to GDP ratios of over 40 percent (China, Korea, Philippines, Thailand and Vietnam) and others over 100 percent (Hong Kong, Malaysia and Singapore). This increased export dependence means that a slowdown in demand from industrial countries is having a strong negative impact on economic growth throughout the Asian region.
The island states of Hong Kong and Singapore will be hit particularly hard. Smaller countries with lower levels of per
capita income and large trade exposure such as Malaysia, Thailand and Vietnam could also be hard hit as will countries with already large budget deficits including India and the Philippines. South Asia is less likely to be affected since its export dependence is smaller and countries in this region are large enough to compensate for a loss of export revenue by an increase in consumption supplemented by fiscal stimulus.
Table 2. Exports as % of GDP
Country 2006 1982 Bangladesh 19.0 4.2
China 40.1 12.3
Hong Kong 205.4 86.0
India 23.0 6.1
Indonesia 30.9 26.3
Japan 14.3 14.5
Korea 43.2 33.2
Malaysia 117.0 127.1
Nepal 13.6 10.0
Pakistan 15.3 11.9 Philippines 46.4 21.3 Singapore 252.6 NA Sri Lanka 31.6 26.3
Taiwan 61.3 44.8 Thailand 73.7 20.1 Vietnam 73.5 negligible Source: World Resources Institute On Line and
Taiwan (2008)
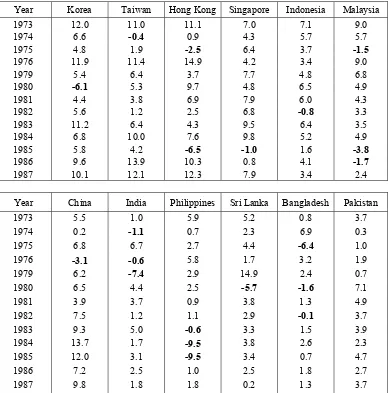
largely a function of political problems as well as the US recession. However these years of negative or very low growth were usually followed by the resumption of strong growth after a year or two.
What pattern will the current recession follow in Asian countries and what will be the likely evolution of growth in the next few years? What is the likelihood of a strong rebound?
There are several factors to consider in answering these questions. First most Asian economies have already taken steps to provide monetary and fiscal stimulus to deal with further anticipated weaknesses in the foreign sector. Most countries have cut interest rates in last four months of 2008 and falling energy and food prices that have resulted from the slowdown should ameliorate any tendencies toward inflation. Furthermore most countries have already or will soon put into motion
Table 3. Growth in GDP per Capita
Year Korea Taiwan Hong Kong Singapore Indonesia Malaysia 1973 12.0 11.0 11.1 7.0 7.1 9.0 1974 6.6 -0.4 0.9 4.3 5.7 5.7 1975 4.8 1.9 -2.5 6.4 3.7 -1.5
1976 11.9 11.4 14.9 4.2 3.4 9.0 1979 5.4 6.4 3.7 7.7 4.8 6.8 1980 -6.1 5.3 9.7 4.8 6.5 4.9 1981 4.4 3.8 6.9 7.9 6.0 4.3 1982 5.6 1.2 2.5 6.8 -0.8 3.3
1983 11.2 6.4 4.3 9.5 6.4 3.5
1984 6.8 10.0 7.6 9.8 5.2 4.9 1985 5.8 4.2 -6.5 -1.0 1.6 -3.8
1986 9.6 13.9 10.3 0.8 4.1 -1.7
1987 10.1 12.1 12.3 7.9 3.4 2.4
Year China India Philippines Sri Lanka Bangladesh Pakistan 1973 5.5 1.0 5.9 5.2 0.8 3.7 1974 0.2 -1.1 0.7 2.3 6.9 0.3 1975 6.8 6.7 2.7 4.4 -6.4 1.0
1976 -3.1 -0.6 5.8 1.7 3.2 1.9 1979 6.2 -7.4 2.9 14.9 2.4 0.7 1980 6.5 4.4 2.5 -5.7 -1.6 7.1
1981 3.9 3.7 0.9 3.8 1.3 4.9 1982 7.5 1.2 1.1 2.9 -0.1 3.7
1983 9.3 5.0 -0.6 3.3 1.5 3.9 1984 13.7 1.7 -9.5 3.8 2.6 2.3 1985 12.0 3.1 -9.5 3.4 0.7 4.7 1986 7.2 2.5 1.0 2.5 1.8 2.7 1987 9.8 1.8 1.8 0.2 1.3 3.7
some fiscal stimulus, the most notable being China’s projected $850 billion additional spending on infrastructure over the next few years (see Table 4). This stimulus along with relaxed monetary policy should help to boost domestic demand. For example at the end of October 2008 the central banks of Korea
lowered its key lending rates as their stock market indices have retreated further. There have also been VAT rebates for exporters and some tax rebates and some efforts to boost both current and capital spending in Thai-land’s 2008 budget (see World Bank 2009c).
Table 4. Fiscal Policy Responses Across Developing Asia
China, People’s Rep. of Economic stimulus package worth $586 billion, which includes spending on various areas such as roads, airports and other infrastructure, health and education, environmental protection, high technology, and housing; also covers tax deductions for exporters.
India Economic stimulus package of around half a percent of GDP that includes additional government spending worth 200 billion rupees (US$4 billion), a cut on value-added tax, credit support for textile, leather, handlooms and other labor-intensive sectors, and infrastructure financing. An additional stimulus could be forthcoming in 2010.
Indonesia Economic stimulus package for 2009 that includes spending for $6.1 billion (about 1.4 percent of GDP) as a stimulus package in 2009, including about $1 billion for infrastructure and around $ 850 million to create new jobs and to bring nearly a million unemployed back to work. The fiscal stimulus will be continued in 2010 amounting to 2 percent of GDP or nearly $9 billion.
Korea, Rep. of Economic stimulus package worth at least 14 trillion won ($11 billion), which covers spending on regional infrastructure and providing tax benefits, mainly on investment in factories.
Malaysia Economic stimulus package worth 7 billion ringgit ($2 billion) to be spent on “high-impact” construction projects including roads, schools, hospitals, and low-cost housing. This was followed by a $16 billion package in March 2009 which extended the stimulus to investment guarantees and a new airport.
Phillippines Ttax breaks for consumers and business as well as increased physical and social infrastructure spending
Taipei,China Economic stimulus package of NT$500 billion ($15 billion), which includes a shopping voucher program, launch of public construction projects, urban renewal plans, and incentives to encourage private investment and industrial upgrading.
Thailand Economic stimulus package of $3.3 billion which will package, which includes supplements to low income earners, students and the unemployed, provisions for better health care, aid to rural communities and senior citizens. The package also includes infrastructure projects and support for the tourism industry and the financial sector.
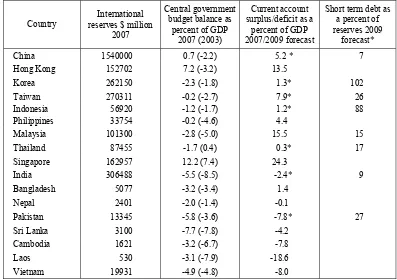
Table 5. International Reserves, Government Deficits and Current Account Balances in Asian Economies
Country
International reserves $ million
2007
Central government budget balance as
percent of GDP 2007 (2003)
Current account surplus/deficit as a
percent of GDP 2007/2009 forecast
Short term debt as a percent of reserves 2009
forecast*
China 1540000 0.7 (-2.2) 5.2 * 7
Hong Kong 152702 7.2 (-3.2) 13.5
Korea 262150 -2.3 (-1.8) 1.3* 102
Taiwan 270311 -0.2 (-2.7) 7.9* 26
Indonesia 56920 -1.2 (-1.7) 1.2* 88
Philippines 33754 -0.2 (-4.6) 4.4
Malaysia 101300 -2.8 (-5.0) 15.5 15
Thailand 87455 -1.7 (0.4) 0.3* 17
Singapore 162957 12.2 (7.4) 24.3
India 306488 -5.5 (-8.5) -2.4* 9
Bangladesh 5077 -3.2 (-3.4) 1.4
Nepal 2401 -2.0 (-1.4) -0.1
Pakistan 13345 -5.8 (-3.6) -7.8* 27
Sri Lanka 3100 -7.7 (-7.8) -4.2
Cambodia 1621 -3.2 (-6.7) -7.8
Laos 530 -3.1 (-7.9) -18.6
Vietnam 19931 -4.9 (-4.8) -8.0
Source: Asian Development Bank (2008) and Economist (2009a)
Generally, Asian economies have current account surpluses and all countries in the region have ample foreign exchange reserves (see Table 5). There are three potential problem economies. Korea and Indonesia have a high level of short term debt as a percent of reserves and Pakistan has current account imbalances that need to be addressed. Combined with a highly leveraged banking system and the weakness of the won which has fallen 40 percent against the US dollar in the past year, this creates a potential problem for Korea in financing its foreign debt obligations. Korea does have a number of currency swap agreements that should help enable it to roll over nearly $200 billion debt which falls due in 2009 (see Economist 2009a). Indonesia is less at risk because it has a current account surplus and its banking
system has been conservative, having a low loan to deposit ratio. Pakistan, on the other hand has a very large current account deficit and also a high bank loan to deposit ratio. Its level of non-performing loans is 7.4%, and has increased slightly since 2006. This is higher than the other poor countries in Asia. For example in Q32008 the IMF estimated the NPL ratio of non-performing loans to gross loans among the poorest Asian economies was under 3 percent in Cambodia, India and Vietnam (Burke 2009).
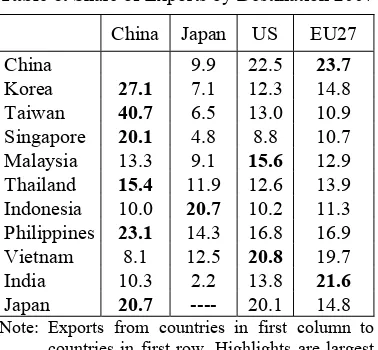
on exports to industrial countries than it was a decade ago, it now finds itself in a more favorable position to address the current global slowdown. What is clear from the forecasts in Table 1 combined with the recog-nition that China is now the primary export destination of other Asian economies, having pulled ahead of the United States (see Table 6), is the importance of China and India as the star performers in Asia. While some of these exports to China may involve intermediate products, the emerging role of China can not be underestimated. India stands out for other reasons. It does not trade as much as the ASEAN and East Asian economies and to some extent it has been more insulated from the global downturn. Secondly, India’s economy is more driven by services than manufacturing and this further protects it from the business cycle. It is also benefiting from lower commodity prices and the beneficial impact on the balance of payments has allowed the central bank to cut interest rates without fear of deterioration in its external balance.
Table 6. Share of Exports by Destination 2007
China Japan US EU27
China 9.9 22.5 23.7 Korea 27.1 7.1 12.3 14.8 Taiwan 40.7 6.5 13.0 10.9 Singapore 20.1 4.8 8.8 10.7 Malaysia 13.3 9.1 15.6 12.9 Thailand 15.4 11.9 12.6 13.9 Indonesia 10.0 20.7 10.2 11.3 Philippines 23.1 14.3 16.8 16.9 Vietnam 8.1 12.5 20.8 19.7 India 10.3 2.2 13.8 21.6 Japan 20.7 ---- 20.1 14.8 Note: Exports from countries in first column to countries in first row. Highlights are largest destinations
Source: Nomura Securities (2009)
If the global downturn is severe then the likely negative impact on international trade
both intra-regionally and on industrial coun-tries will be much stronger than anticipated. From export and industrial production downturns in late 2008 and 2009 this seems increasingly more likely. In Japan exports fell 35 percent in December from a year earlier and industrial production plunged a record 9.6 percent, month on month, in December of 2008. Chinese exports declined for the third consecutive month in January, falling 17.5 percent from a year earlier, after a 2.8 percent decline in December. Imports plunged even further in January 43.1 percent. More than 20 million Chinese migrant workers have lost their jobs in recent months with some analysts warning of 50 million more job losses if the economy deteriorates further. In India exports fell 24 percent in January and one million Indian workers in the export sector have lost their jobs since September, 2008. Experts are expecting another half a million workers to lose their jobs by March. New Delhi's public debt stands at 75 percent of its GDP, com-pared to just 18.5 percent in China, leaving less room for large a stimulus package. South Korea's exports, the main driving force of the economy, plunged 32.8 percent in January 2009. Finance minister Yoon Jeung-hyun warned on Tuesday that the fourth largest economy in Asia would shrink by about 2 percent this year while Credit Suisse has projected as much as a 7 percent contraction. In Taiwan, the sixth largest Asian economy exports fell by 44.1 percent in January from a year earlier—the biggest fall since records began in 1972. Imports plunged 56.5 percent in the same month. For an economy where exports account for 70 percent of GDP, the impact is devastating (data in this paragraph reported by Market Oracle 2009).
chronically rural poor as well as other rural residents. Remittances from international migrants will also be adversely affected by the global slowdown. The Philippines is likely to be heavily impacted.
Governments need to prepare further for this contingency by setting aside some funds to protect the poor should this negative scenario materialize. They also need to adopt appro-priate countercyclical macroeconomic policies to compensate for the slowdown in exports. Governments also need to be ready to provide resources to protect the chronically poor from further deterioration in their living standards. In our view a deeper recession scenario beco-mes more probable every day the global crisis persists and the possibility of further conta-gion spreading to stock markets and banking systems in Asia increases.
On the positive side, even if the recession in industrial countries does deepen, deve-loping Asia is now generally much better positioned to withstand this external shock than it was during the Asian financial crisis of a decade ago. International reserves have been built up, economic growth has accelerated in many countries, and financial systems have been restructured. Furthermore lower oil prices should have a beneficial impact on the external balance of the regions oil importers – basically the entire region with the exception of Indonesia and Malaysia. Malaysia, South Korea and Thailand have already announced stimulus packages and Singapore announced a stimulus package equivalent to about 9% of GDP at the end of January 2009 (see also Table 4). However there are still large budgets deficits in several countries although they have come down in several countries including China, India and the Philippines. Current account deficits are still large, particularly in parts of South Asia and financial inflows from private sources are
likely to dry up. The Institute of International Finance expects a 30 percent decline in global private capital flows to developing countries compared with 2007 (see Economist 2009a). Despite potential weak spots, recent strong economic growth has been recorded in South Asia. In India export dependence is much lower than in China and Southeast Asia. However it has other difficulties in financing its investments because of weak local equity markets and lack of willing overseas lenders. It already has high debt to GDP ratio which constrains its options to provide further fiscal stimulus.
As the global crisis has intensified assis-tance is being offered by donors. The IMF has recently approved a loan of $7.6 billion to Pakistan to rebuild its economy and expand its safety net for the poor and it is not unlikely that similar requests will be made from other countries. In late October 2008 the IMF also said it will create a Short-Term Liquidity Facility (SLF) that comes with no conditions attached and offers large upfront financing to help countries restore confidence and combat financial contagion.
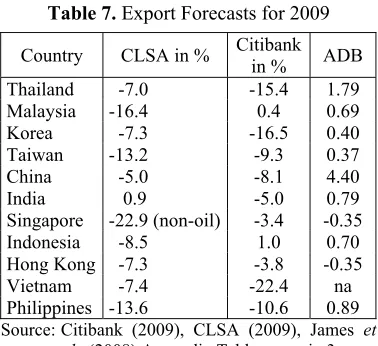
Table 7. Export Forecasts for 2009
Country CLSA in % Citibank
in % ADB
Thailand -7.0 -15.4 1.79
Malaysia -16.4 0.4 0.69
Korea -7.3 -16.5 0.40
Taiwan -13.2 -9.3 0.37
China -5.0 -8.1 4.40
India 0.9 -5.0 0.79
Singapore -22.9 (non-oil) -3.4 -0.35
Indonesia -8.5 1.0 0.70
Hong Kong -7.3 -3.8 -0.35
Vietnam -7.4 -22.4 na
Philippines -13.6 -10.6 0.89
Source: Citibank (2009), CLSA (2009), James et al., (2008) Appendix Table scenario 3
INDIVIDUAL COUNTRY RESPONSES AND PROSPECTS
As the details of individual country res-ponses to the global crisis will vary, this section is designed to provide more details regarding individual country prospects.
China. Toward the end of 2008 and in early 2009 there have also been reports of subs-tantial layoffs in the export processing zones in Southern China and some recent migrants to the cities have been returning to their homes in rural villages. The extent of the recession-ary buildup is reflected by recent estimates of export shipments. After falling by 2.2 percent in late 2008, exports declined much more rapidly in January 2009. Shipments were down by 17.5 percent while imports fell even further by 43 percent. This suggests that further export contraction is likely since a lar-ge fraction of imports are for inputs to exports. Recently the IMF has downgraded Chinese growth to 6.9 percent for 2009 and Euroframe (2009) also is predicting slower growth in 2009 and 2010 of 7.6 percent and 7.1 percent respectively. The Consensus Economics forecast (Consensus Economics, 2009) is somewhat higher at 8.1 percent (see Table 1). Remittance income is also expected to decline slightly. China is now the second largest recipient of overseas remittances after India
with over $25 billion remitted in 2007. Unem-ployment is rising and many migrant workers are being forced to return to their villages. China has recently taken steps to shore up its economy by announcing a US$586 billion infrastructure investment program to be implemented over 2009 and 2010 (about 7.5 percent of GDP where GDP is measured by purchasing power parity and much more using the exchange rate method). The projects will include low income housing, electricity, water, rural infrastructure, environmental protection and technological innovation. This package is intended to boost consumer confidence as well as to provide jobs and additional spending to offset the anticipated slowdown in exports. China can well afford such a large stimulus package since government debt is less than 20 percent of GDP.A similar though smaller package was implemented following the 1997 Asian financial crisis. By comparison this package is slightly larger than the $700 billion financial sector bailout in the United States when measured as a percent of income (the U.S. bailout package is about 5 percent of GDP see Table 10). In additional exporter tax rebates which were suspended in 2008 have been restored and new laws on wages and work rules that added to costs have been relaxed. If GDP growth slows to the range of 6-7 percent it will probably entail further layoffs and could result in social unrest in adversely affected areas, probably in Shenzen and other coastal cities. If this happens further stimulus may be needed to provide relief for affected families. If the fiscal stimulus measures undertaken in industrial countries are effective the recession could bottom out toward the end of 2009 with recovery in 2010. China would benefit and growth could accelerate to the range of 8 percent.
policies were undertaken in late 2008 and early 2009 that served to stabilize interest rates, increase domestic liquidity and contained the outflow of capital. Forecasters expect growth to be in the range of 7 percent, consistent with the ADB forecast reported in Table 1. Banks are still tightly regulated in India, resisting the trend toward deregulation followed in many other developing countries. As a result Indian banks were not heavily invested in the assets and derivatives backed by sub-prime mortgages issues in the US. According to Panagaria (2009), only about a billion dollars out of total banking assets of 500 billion fall into the toxic asset category. However there have been withdrawals by US firms and a sharp decline in US imports of Indian products. Foreign exchange reserves fell by nearly $40 billion in October 2008 alone resulting in a tightening of liquidity in India. Merchandise exports demand also softened in the fourth quarter of 2008 following a tripling between 2002 and the first part of 2008. Direct foreign and portfolio investment has also moderated as foreign firms have retrenched and remittance income has also been adversely affected. Some economists are predicting that remittance flows, which comprise about 3 percent of India’s GDP, will also decline. The World Bank is predicting a slight decline in global remittance flows in 2009. However a recent World Bank report (World Bank, 2008) argues that non resident Indian remittances (NRI) will hold up well despite the slowdown in the global economy. In 2007 India was the largest recipient of remittances at $27 billion followed by China at $25.7 billion and the Philippines at $17 billion. In response to these developments the Indian government has loosened monetary policy by cutting interest rates and reserve requirements. Constrained by a large fiscal deficit and debt to GDP ratio of more than 80 percent, India has been able to mount only a modest fiscal stimulus package which amounts to about half a percent of percent of GDP in 2009, somewhat lower than
other countries in Asia (refer to Table 10). There is, however, the hope that the upcoming elections in May 2009 will accelerate government spending independently of the fiscal stimulus. Will these measures be enough to help the Indian economy sustain growth in the range of 7 percent or higher? Chances are good, if only because India has not globalized as rapidly as other countries in the region. However it must continue to deregulate its domestic economy and pursue measures to increase economic efficiency, particularly with respect to industrial policy and by relaxing labor market restrictions.
export value would fall by 6 percent in 2009 and non oil exports would fall by 20 percent. Nevertheless, the financial sector remains healthy and the level of nonperforming loans has been reduced as a result of reforms undertaken following the Asian crisis a decade ago. To address the crisis the government has taken a series of policy measures. Initially there was concern that the balance of payments would be adversely affected. More recently there has been greater emphasis on the potential decline in output and rising unemployment. To offset the negative impact of the crisis the government has allocated the equivalent of $6.1 billion (about 1.4 percent of GDP) as a stimulus package in 2009, about $1 billion for infrastructure and around $ 850 million to create new jobs and to bring nearly a million unemployed back to work. The fiscal stimulus will be continued in 2010 and a proposed 2 percent of GDP or nearly $9 billion will be allocated for that purpose. The amount of the stimulus distribute over 2 years is the equivalent of 3.4 percent of GDP, is the same magnitude of the fiscal stimulus provided in the United States and China. It seems appropriate given the strain that it will put on the budget. Monetary policy has been relaxed to provide additional stimulus to the economy. By early March 2009 the bench-mark interest rate has been cut four times since December 2008. However commercial bank lending rates have not followed suit and they are being pressured to lower rates further, particularly in light of a moderation in inflation as a result of the weaker economy and lower oil prices. There is also concern that liquidity has been adversely affected by concern that the crisis will deepen. This also suggests that further monetary stimulus is needed. Some bank deposits are guaranteed by the government but coverage needs to be increased to achieve blanket coverage and to reassure the public. The stimulus packages this year and in 2010 will put pressure on the budget and the deficit is projected to be 2.6 percent of GDP in 2009 compared with a
deficit of 1 percent of GDP last year. To cover the deficit Indonesia will need to raise capital from both domestic and foreign sources. Given the evolving outlook for the global economy and export prospects for manufac-tured goods, the rather optimistic forecast of 6.2 percent growth for 2009 made at the end of 2008 has been reduced to the range of 4 percent by many economists including Bank Indonesia which reduced its forecast in March to 4.5 percent.
Kong interbank lending rate (Hibor) to provide additional liquidity for banks that have to borrow in the interbank market. Lower interest rates will also ease debt repayment for households. The property market slumped in 2008 as transaction fell by around 20 percent compared with 2007. Further declines are expected in 2009 although low mortgage rates and price declines could attract some buyers in 2009. However the chances of a further decline in prices are still high. Unemployment rose in 2008 and is expected to increase further to over 6 percent in 2009. Given constraints on monetary and fiscal policy and the anticipated lack of stimulus to the Hong Kong economy from the recently announced fiscal stimulus by the Chinese authorities it is difficult to see how Hong Kong can salvage a positive growth outcome in 2009. The most recent forecasts reported in Table 2 suggest negative growth in the range of -2 percent in 2009.
Korea To address rapidly deteriorating export performance and the end of 2008 and early 2009 Korea had a stimulus package of around $10 billion at the end of 2008 and planned another $100 billion package in early 2009 (about 1 percent of GDP, see Table 10). This has so far done little to slow the downturn as forecasts of modest growth by the KDI of 0.7 percent and central bank of 0.3 percent bad enough for an economy used to growth in excess of 5 percent have been replaced by a negative growth rate of 4 percent projected by the IMF (see Table 1). The level of household debt is high and this could slow the economy further if it was not for the two fiscal stimulus packages and currency depreciation of around 30 percent in 2008 which might boost exports. However recent trade figures show exports contracted by over 17 percent in 2008 and capital investment is also projected to fall by 7.7 percent in 2009. Export prices for their key products are falling as competition to maintain global market share intensifies. CLSA projects a decline in export volume of 5.4 percent in 2009, particularly to China, Korea’s largest
export market. In November shipments were down nearly 30 percent including a wide array of products such as PCs, home appliances, semiconductors, automobiles and petrochemi-cals. The central bank has cut the policy interest from 5.25 percent to 2.5 percent since the beginning of October 2008 and is expected to lower it further during the first quarter of 2009. Economists doubt that this will keep the economy from falling into recession. Employ-ment growth has slowed and unemployEmploy-ment is expected to reach nearly 5 percent in 2009 up from 3.2 percent in 2008. In addition to the hardship created for the families of the unemployed this will also put a damper on consumption. The housing sector is also weak. The inventory of unsold apartments has increased putting downward pressure on prices. The government has announced various measures to prop up the property market including buying ten thousand to fifteen thousand units and land from cons-truction companies as well as extending loans to construction companies. These measures will help to soften the downturn but unlikely to reverse it in the short run. At best growth might be flat in 2009 but it is more likely to be a 1 or 2 percent negative.
stimulus package to boost aggregate demand in the face of a deteriorating export environ-ment (MIER, 2008). This package, announced to be $16 billion in early March 2009, would follow on a $ 1.9 billion (7 billion ringgit) package announced in November 2008 which was designed to focus on high impact projects including roads, schools and low cost housing. Together these two packages amount to around 4.5 percent of GDP (see Table 10). The stimulus will be accompanied by gene-rally looser monetary policy and lower interest rates and would imply an increase in the budget deficit to over 7 percent of GDP (see Pacific Basin Economic Council Limited 2009). Whether these policies will be effective or not will depend not only on the response of private sector demand in Malaysia but also on the recovery in exports to industrial countries. Electrical machinery and products comprise nearly 40 percent of Malaysian exports and shipments of office machines and other machines and parts fell rather dramatically in the last quarter of 2008. To offset weakness in traditional markets in industrial countries Malaysia is focusing on new and emerging markets as well as providing financial support for small and medium sized enterprises. MIER is also concerned about the secondary effects on a slowdown in China which will have an adverse impact on Malaysia suppliers of intermediate products to this large market. Despite the large stimulus package that has recently been announced I t is difficult to see how Malaysia will be able to avoid a recession in 2009,
Philippines In 2008 the Philippine economy performed very well through the first three quarters of the year, following on from successively strong years in 2005 through 2007 when the economy grew from 5 percent to 7.2 percent, one of the highest in the Asian region. In the third quarter GDP growth was 4.6 percent year on year led by rapid growth in government spending. However fourth quarter results for 2008 and early 2009 performance suggest that the global downturn that has
to fall. It is possible that remittances will remain strong and this could help maintain growth at a reasonable level. Most recent forecasts show growth for 2009 in the range of 3 percent although CLSA 2009 is predicting only 1.2 percent. In our view an estimate at the upper end of this range is more likely.
Singapore Singapore is the most volatile of the open economies in Asia. Its exports are over 200 percent of GDP and as a result the economy is sensitive to the global trading climate. In the 2001 recession growth was -2.4 percent following growth of over 10 percent the previous year. The turnaround in 2009 from 2008 is not going to be as dramatic since the economy was already feeling the signs of the recession. Growth was 1.5 percent following a strong 7.7 percent growth in 2007. As expected, exports are going to be most adversely affected. All sectors are likely to be hit hard. Non-oil exports including electronics and other goods fell by 34.8 percent in January, 2009 and electronics shipments feel even more by 38.4 percent. This followed on a slow fourth quarter of 2008 where GDP fell by 2.6 percent compared with the same quarter a year earlier and manufacturing (accounting for 25 percent of GDP) by 9 percent. Construction and services grew slightly in the fourth quarter but are not expected to hold up well in 2009. A weaker real estate market and the negative wealth effects that accompany it are an additional downside development that is widely anticipated. A lower value for the Singapore dollar is also likely as the Monetary Authority of Singapore is expected to adopt such a policy as it would be consistent with a trade weighted band anticipating the depre-ciation of other Asian currencies vis a vis the US$. The government has announced a stimulus of $13.7 billion (about 9 percent of GDP) at the end of January which will help to save jobs, provide tax breaks and build infrastructure, stimulate bank lending and enhance international competitiveness through tax relief and grants to businesses. $1.7 billion will also be allocated to infrastructure and
upgrading of health and educational facilities. The stimulus may also help to shore up capital formation which could decline by more than 10 percent in 2009. It is likely that the government will dip into its ample govern-ment reserves to pay for the stimulus. This should help to keep the recession from being severe but not enough to keep it out of negative growth territory.
by at least 5 percent and perhaps by as much as 20 percent in 2009 compared with an increase of 12 percent in 2008. Export demand for gems, furniture and toys is also expected to soften in 2009, although toy exports could pick up some as product safety and recalls dampens demand for Chinese toy exports. Tourism is also expected to decline. Arrivals fell in the last few months of 2008. Private investment flows will also be adversely affected by the global slowdown. Board of Investment approvals fell dramatically in the second half of 2008. The Thai banking system remains sound and exposure to foreign assets is limited and nonperforming loans were only 3.3 percent of total loans in the third quarter of 2008.Growth in other markets including Eastern Europe and the Middle East may offer some offset to weaker demand in industrial countries and lower oil prices will reduce the import bill. To offset lower exports and reduced financial inflows Thailand needs to speed up the pace of public investment to reduce overhead costs and increase productive efficiency. It also must improve the invest-ment climate to attract foreign capital and upgrade its human capital resources. To address the weaknesses in the Thai economy that have resulted from the ongoing global recession the government announced the details of a fiscal stimulus package of 116.7 billion baht ($3.3 billion) which is a little less that 1 percent of GDP (see Table 10). The package, which will be paid for by domestic and international borrowing includes supple-ments to low income earners, students and the unemployed. There are also provisions for better health care, aid to rural communities and senior citizens. The package also includes infrastructure projects and support for the tourism industry. Tax measures will be taken to reduce the tax burden on the real estate sector, venture capital companies, small and medium industries and the tourism sector. Liquidity support for the financial sector is also envisioned. It is envisioned that the package will increase GDP by at least 1
percent and ensure positive growth in 2009. The government also plans to spend 2 trillion baht on infrastructure projects over the next three to four years to increase economic efficiency and create jobs (see Kingdom of Thailand 2009). To offer further support to the economy monetary policy has been further eased as the policy interest rate has been lowered to 1.5 percent. While the recession will put a damper on the amount of deficit spending that can be sustained these measures should work to raise income growth.. Programs to aid the poor are particularly welcome. Nevertheless the outlook for overall growth in 2009 remains muted. A recent World Bank report projects GDP growth at only 2 percent for 2009 (World Bank 2008a).
far fiscal stimulus for 2009 has been modest at around 2 percent of GDP from a multiyear infrastructure package and issuance of consumption coupons (see Table 10). The former is expected to bolster the construction sector which declined by 14 percent in the fourth quarter of 2008. Additional fiscal stimulus is needed and well within the ability of the government to provide. International reserves are huge, the current account is in surplus and expected to remain so despite the crisis, public debt is around 35 percent of GDP and until last year the government deficit was less than 1 percent of GDP. Investment spending has also fallen although not as far as in the 2001 recession. However there is not much evidence that fiscal stimulus is directed to supporting private sector capital formation. Unemployment is also increasing, is much higher than in other NIEs and could reach 7 percent by the end of 2009.. Putting all of this information together it appears that without further fiscal stimulus the Taiwan economy will sink further into recession with GDP growth somewhere between -2 percent and -3 percent.
Vietnam From one perspective Vietnam is in a similar situation to other countries in the region. Export revenue, foreign direct investment and remittance income has been falling and are expected to fall further in 2009. However from the perspective of possible government policy actions to provide stimulus to offset the fall in demand Vietnam is under more constraint than its neighbors. It has lower levels of international reserves and ballooning current account and fiscal deficits, both of which constrain further fiscal expan-sion. In addition firms who have borrowed abroad to finance local investment find themselves in a bind as the dong continues to depreciate. Taking these factors into account it is unlikely that the government’s goal of maintaining growth of 6.5 percent in 2009 can be realized. Looking at the components of GDP and international trade it is more likely that Vietnam may be able to grow at around 3
income tax and deferred tax on dividends. As the stimulus will require additional borrowing there will be pressure on the external balance and the current account deficit which will be compounded by falling remittances, weaker exports and tourism revenues as well as the planned fiscal stimulus. If the saving – investment gap is financed by foreign direct investment then Vietnam will be able to sustain a fairly large current account deficit of close to 15 percent of GDP in 2009. If not there is a threat of further currency deva-luation, reduce fiscal support and even greater decline in aggregate activity.
A QUICK LOOK AT 2010
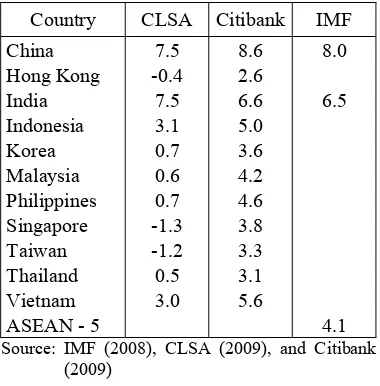
Economic growth prospects will improve in 2010 according to recent forecasts made by CLSA and Citibank. However CLSA projects negative growth to continue in 3 of the NIEs while Citibank is more optimistic. The IMF (IMF, 2009) has made a forecast for India, China and ASEAN-5 which are broadly consistent with the Citibank forecasts and slightly above CLSA.. Income in Southeast Asia should improve, although growth will still be below the historical trend. China and India will continue to outpace the rest of the region and will be joined by Indonesia and Vietnam as strong performers in 2010 according to both CLSA and Citibank (see Table 8). Citibank expects export growth is expected to resume in 2010 throughout the region while CLSA is less optimistic. Exports continue to fall year on year in the CLSA forecast for most countries in the region (see Table 9). CLSA projects international reserves to remain steady or increase in 4 countries and to decrease slightly in the rest while Citibank projects a rise in reserves throughout the region. The Citibank forecast assumes a U shaped recovery with the region resuming strong growth, export performance and build up of reserves in 2010 while CLSA envisions a longer recovery with a more prolonged trough in the cycle.
ANALYSIS OF FISCAL AND MONE-TARY STIMULUS PACKAGES
stimulus measures may be put in place as events unfold.
Table 8. Economic Growth in 2010 in Percent
Country CLSA Citibank IMF China 7.5 8.6 8.0 Hong Kong -0.4 2.6
India 7.5 6.6 6.5 Indonesia 3.1 5.0 Korea 0.7 3.6 Malaysia 0.6 4.2 Philippines 0.7 4.6 Singapore -1.3 3.8 Taiwan -1.2 3.3 Thailand 0.5 3.1 Vietnam 3.0 5.6 ASEAN - 5 4.1 Source: IMF (2008), CLSA (2009), and Citibank
(2009)
Table 9. Export Growth in 2010 in Percent - Year on Year
Country CLSA Citibank
China -10.0 9.5
Hong Kong -8.8 3.6
India 2.3 10.0
Indonesia 0.2 8.0
Korea -9.9 17.5
Malaysia -4.8 15.0 Philippines -11.8 4.8 Singapore -21.4 15.0 Taiwan -15.0 7.0 Thailand -1.0 7.2
Vietnam 1.6 14.0
Source: CLSA (2008) and Citibank (2008)
Table 10. Stimulus Packages as a Percent of GDP
Country
Total fiscal stimulus 2009 and 2010 as
percent of GDP
China 7.5 India 0.5 Indonesia 1.1 Korea 0.4 Malaysia 4.5 Philippines 2.0
Taiwan 2.0 Thailand 0.8
Vietnam 2.5 Canada 2.7 France 1.3 Germany 3.4 Italy 0.3
Japan 2.2 United States 4.8
Source: Table 4 and Economist Magazine March 14:75 (2009) for estimates for OECD countries based on IMF estimates, CIA Factbook on line for GDP of Asian countries
REFERENCES
Asian Development Bank, 2008. Asian Development Outlook 2008 update. Manila: Asian Development Bank. Burke, Maureen, 2009. “Poor Countries Need
Extra Help to Get Through Global Crisis”, IMF Survey Online, In http://www.imf. org/external/pubs/ft/survey.
Chowdhury, A., and I. Islam, 1993. Newly Industrialized Economies of East Asia. London: Routledge.
Citibank, 2008. Asian Economic Outlook and Strategy – Asia’s Disturbing GDP Trends. New York.
CLSA, 2008. EoAE Forecasts 1Q09. Hong Kong: CLSA.
Diokno, B. E., 2009. “Understanding the Global Economic Crisis”, University of Philippines Forum, 10 (1) Jan.-Feb. 1-5. Economist, 2009. “America’s Banking Crisis
Worse than Japan?”, February 14, p. 81-82.
Economist, 2009a. “Economic Focus, Domino Theory”, February 28, p. 82.
Euren-News #1 2009, February 18.
James, W. E., D. Park, S. Jha, J. Jongwanich, A. Terada-Hagiwara, and L. Sumulong, 2008. “The US Financial Crisis, Global Financial Turmoil, and Developing Asia: Is the Era of High Growth at an End?” ADB Economics Working Paper Series No. 139 December. Manila: Asian Development Bank.
Kingdom of Thailand, 2009. Fiscal Stimulus Package, Ministry of Finance.
Klein, Laurence R., and W. Mak, 2009. Current Quarter Model of the United States Economy, February 27, University of Pennsylvania.
International Monetary Fund, 2008. World Economic Outlook, October. Washington, D.C.: IMF.
International Monetary Fund, 2009. World Economic Outlook update, January 28. Washington, D.C.: IMF.
Malaysian Institute of Economic Research, 2008. Quarterly Surveys. Kuala Lumpur, Malaysia: Malaysian Institute of Economic Research (MIER).
Market Oracle, 2009. In http://www. Market-oracle.co.uk/Article 8895.html.
Nomura Securities, 2009. Nomura Economics Asia February. Tokyo, Japan.
Panagaria, A., 2009. “India’s Financial Secret Weapon, Foreign Policy”. In http://www. foreignpolicy.com.
Taiwan Government, 2008. Taiwan Statistical Yearbook 2008. Taipei, Taiwan.
World Bank, 2008. Migration and Remittances Fact Book. Washington D.C.: World Bank.
World Bank, 2008a. Thailand Economic Monitor December. Bangkok, Thailand: World Bank.
World Bank, 2008b. World Development Indi-cators Online. Washington, D.C.: World Bank.