PCR Primer Specific CaMV 35S Promoter to Detect Transgenic Soybean
in Indonesia Commercial Soybean and Tempeh
Tri Joko Raharjo
1,2,*and Surajiman
21Department of Chemistry, Faculty of Mathematics and Natural Sciences, Universitas Gadjah Mada, Sekip Utara, Yogyakarta 55281, Indonesia
2Integrated Research and Testing Laboratory, Universitas Gadjah Mada, Sekip Utara, Yogyakarta 55281, Indonesia
Received April 4, 2017; Accepted July 10, 2017
ABSTRACT
In the framework of the supervision and enforcement of the regulation regarding the content of soybean transgenic in food and processed foods such as tempeh, a reliable testing method is indispensable. The performance of primer specific PCR targeting CaMV 35S promoter were tested to detect the presence of transgenic soybean. The parameters tested were specificity, precision and cut off detection using transgenic soybean certified reference material (CRM). The method is reliable to detect transgenic soybean specifically and has the annealing temperature at 59 °C during the 30 cycle standard PCR condition. The method did not show any false positive and false negative results meaning good precision. The cut off the methods is up to 2 copies total DNA of soybean or less than 104 copies of the CaMV 35S promoter. Observation to the commercial soybeans and tempeh found that
most of the commercially available soybean in Indonesia are transgenic (8 of 10 sample) while all tested tempeh sample were detected have been fermented from transgenic soybeans.
Keywords:transgenic; tempeh; soybeans; PCR; CaMV 35S promoter
ABSTRAK
Dalam rangka pengawasan dan penegakan peraturan mengenai kandungan kedelai transgenik dalam makanan dan makanan olahan seperti tempe, metode pengujian yang handal sangat diperlukan. Kinerja metode PCR primer spesifik yang mengamplifikasi promotor CaMV 35S diuji untuk mendeteksi keberadaan kedelai trangenik. Parameter yang diuji adalah spesifisitas, presisi dan cut off deteksi menggunakan kedelai CRM transgenik. Metode ini dapat diandalkan untuk mendeteksi kedelai transgenik secara spesifik dengan kondisi suhu annealing pada 59 °C untuk kondisi PCR standar 30 siklus. Metode ini tidak menunjukkan hasil positif palsu dan negatif palsu, serta memiliki presisi yang baik. Metode ini mampu mendeteksi sampai dengan 2 kopi DNA total kedelai atau kurang dari 104 kopi dari promotor CaMV 35S. Pengamatan terhadap kedelai komersial dan tempe
menemukan bahwa sebagian besar kedelai yang tersedia secara komersial di Indonesia adalah transgenik (8 dari 10 sampel) sementara semua sampel tempe diuji terdeteksi telah difermentasi dari kedelai transgenik.
Kata Kunci:transgenik; tempe; kedelai; PCR; promotor CaMV 35S
INTRODUCTION
Tempeh has been known as a major side dish in the Indonesian food since a very long time. Tempeh is made from soybean by fermentation using the fungus
Rhizopus oligosporus. However, due to the reduced production and poor quality of local soybean, tempeh now rely on imported soybeans. Soy products are imported mostly are from developed countries such as the United States, Canada, and China which are already implementing advanced agricultural technology including transgenetic [1]. At the same time, the rules on Genetically Modified Organism (GMO) foods or food
ingredients have not been strong in Indonesia, making it very vulnerable to import transgenic soybean used for Tempeh production.
plants involves the bacteriumAgrobacterium tumefacient
using the Ti plasmid as a gene transfer vector. Ti plasmid is a plasmid that contains a tumor inducer (Ti) gene. Although vectors for gene transfer to agricultural purposes already deleted the gene that induces a tumor, concerns about food safety of GM crops can not just disappear.
Food safety authority in many countries has issued labeling regulation of GMO products and set a minimum level of the presence of GMO in a food product which is labeled as GMO. Australia and New Zealand have a maximum limit of 1%, and Japan has a maximum limit of 5%. In Indonesia currently evaluating four varieties of genetically modified seeds to be commercialized to the market and according to Indonesian FDA the labeling of GMO required for the content of maximum 5% GMO [5].
In line with the purposes of labeling as well as for safety oversight, the detection of the presence of GMOs in agriculture and food products are very important. GMO created by involving the transfer of a wide variety of genes in plants with a variety of destinations in improving the quality of agricultural products. There will be a different gene for each transgenic plants for any superior properties expected. The usage of the various gene used makes it difficult to use the genes as a target for the detection of the presence of GMOs. Fortunately, the gene transfer always involves a promoter needed for the gene being transferred can be expressed in transformant plant. These promoters are usually strong promoter, different with gene promoter in plants so that its presence in a plant can be used as a marker of the presence of the genes are transferred which have given the crop as GMO.
The 35S CaMV promoter is a promoter that is used in a gene transfer to almost all GMO crops because it is capable of inducing strong and long-term expression of the gene. The CaMV 35S promoter derived from cauliflower mosaic virus has a size of 343 bp with the introduction region CAAT and TATA box as in Fig. 1.
Identification of the existence of CaMV 35S promoter can be performed by PCR (Polymerase chain reaction). Primer at position -52 through -71 and -129 through -147 positions as shown in Fig. 1 is the primer used for PCR to identify GMOs via the detection of CaMV 35S promoter. There are two techniques that can
be applied PCR for detection of CaMV 35S promoter, conventional PCR and real-time PCR (RT-PCR). Several PCR methods using simplex as well multiplex has been performed for the analysis of GMO [7-8]. The method using real-time PCR has also been widely reported for the same purpose [8-11]. Real-time PCR (RT-PCR) has proved to be the most reliable and versatile [12-13] and is used in all EU control laboratories.
Although RT-PCR offers advantages regarding specificity and ease of quantification, RT-PCR application for a screening of GMOs in developing countries will be constrained by the availability of instrument as well as the reagent costs. On the other hand, conventional PCR offers a cheaper cost and its validity has been proven in the results of previous studies [7-8]. This report presents the performance of the performance of conventional PCR techniques for detection of promoter 35SCaMV to determine the presence of transgenic soybean in Indonesia and its application to a screening of commercial soybeans on the market following tempeh processed food products.
EXPERIMENTAL SECTION
Materials
The standard of soybean GMO was provided by Quarantine Office Semarang Indonesia. The primer of PCR was synthesized based on the sequence of CaMV 35 promoter (Fig. 1). The forward primer (For) has the nucleotide sequence of 5’-GCT CCT ACA AAT GCC ATC A-3’ while the reversed primer (Rev) has a sequence of 5’-GAT AGT GGG ATT GTG CGT CA-3’ sequence. Both of the primers were synthesized by Genetika Science Indonesia. PCR Supermix was purchased from BioRad. The materials used for DNA isolation are phenol solution (in HCl pH 8), Tris-HCl pH 8 solution of 0.5 M, 0.5 M EDTA, 1 M NaCl solution, chloroform, isoamyl alcohol, sodium acetate pH 5, absolute ethanol, a solution of proteinase K, SDS solution 10%, while the material for electrophoresis are agarose, TBE solution, ethidium bromide, loading buffer (5% glucose; 0.1 M EDTA; 0.1% Bromophenol blue), and DNA marker 100 bp.
Procedure
Soybean DNA isolation
Isolation of soybean DNA was performed using DNA isolation method Phenol-CIAA (chloroform-isoamyl alcohol), a modified method of base DNA extraction method developed by Sambrook’s method [14]. Soybean seeds are destroyed using pollinators to become a soy powder. As much as 100 mg of soy powder was added by 1 mL lysis buffer (50 mM Tris-HCl pH 8, 100 mM EDTA, 100 mM NaCl and 1% SDS) while crushing with mortar porcelain. The results are transferred into micro-tubes 2 mL add with 30 mL solution of proteinase K then incubate at 37 °C for overnight. The mixture was then homogenized by vortexing for approximately 2-3 min, add the same volume of phenol-CIAA solution. The mixture was then shake 30 min at medium speed and then centrifuged for 5 min at 12,000 x g at 4 °C. The treatment using phenol-CIAA solution was repeated to the supernatant. The supernatant of second treatment was transferred to a new 1.5 mL tubes and add with 2.5 M sodium acetate pH 5.2 as much as 0.1 x volume of supernatant and cold absolute ethanol as much as 2.5 x volume of supernatant. The mixture is shaken until well blended then centrifuged for 5 min at 12,000 x g at a temperature of 4 °C. The precipitant DNA then washed with 70% ethanol two times aerated to remove the remaining ethanol. The isolated DNA dissolved in 100 µL of TE solution with a suspended manner. Isolate DNA solution is kept in the refrigerator temperature is -20 °C. Ten µL of DNA solution diluted ten times with TE solution and analyzed using UV spectrophotometer at λ 260 nm and λ 260 nm to determine the concentration and purity of the DNA. A part of DNA solution was also subjected to electrophoresis analysis.
Polymerase Chain Reaction (PCR)
For each sample, 50 ng of DNA add with one µL For and Rev primer (10 mM), 10 µL Supermix PCR (TaqDNA polymerase, dNTP, and PCR buffer) and nuclease free water until the volume 20 µL. The mixture was homogenized using micropipes. The PCR reaction was performed using Biorad CFX96 thermal cycler using this following condition: predenaturation at of 95 °C for 30 sec, followed by 35 cycles of denaturation at 95 °C for 2 sec, annealing, and elongation at an optimized temperature for 5 sec. The optimized temperature for annealing and elongation were 50.1, 50.8, 52.1, 54, 56.4, 58.4, 59.5 and 60.1 °C. The result of PCR was analyzed using agarose gel electrophoresis.
Electrophoresis analysis
The agarose gel used was a 2% agarose gel which prepared by dissolving 1 g of agarose powder in 50 mL of 1x TBE is heated in a microwave oven for 70 sec add
with 5 µL ethidium bromide was then poured into gel cast and a comb was installed to print wells for the sample application. Gel waited until hardened then move to the electrophoresis chamber and fill with a solution of 1x TBE until the entire surface gel covered by the solution. The sample application was prepared by mixing 4 µL of loading buffer, and 8 µL of isolated DNA or PCR product then pipetted into the well. The DNA ladder 100 bp was applied at separated well. The electrophoresis then with a voltage of 100 V for 50 min. The result of DNA bands was seen with the aid of UV light and photographed.
Method performance confirmation
Specificity test. DNA was isolated from both non-transgenic soybeans (negative control) and CRM transgenic soybeans (positive control). The isolated DNAs were used as a template of PCR under the optimized condition of the method. The specificity of the method concludes based on the PCR results; method is specific if PCR of positive control gives positive results and PCR of negative control gives negative result.
Determination of the method cut off. Since the soybean with various content of GMO was not available, the method cut-off was determined using serial dilution of isolated DNA from CRM transgenic soybean. The range of amount DNA to be used as PCR template was 50000, 5000, 500, 50 and 5 pg. The cut off was concluded from the lowest amount of DNA which gave a positive result with good precision. Precision of the method.Precision represents by the repeatability of the method was determined by performing ten times replication of the method using the same sample. The tested method covered not only PCR step under optimized condition but also the DNA isolation step. As PCR is a qualitative method, the precision was concluded if the method was able to give consistent positive results for positive control and a negative result for negative control for or replication.
Detection of GMO in commercial soybean and tempeh
Commercial soybean samples were randomly taken from shops or traditional market. DNA of all samples of soybeans and tempeh were isolated using the validated methods followed by PCR using optimized condition.
RESULT AND DISCUSSION
including of many commercially available isolation kit is rooted to phenol extraction methods developed by Sambrook et al. [14]. The modification of the Sambrook method of using repeat phenol extraction followed by protein precipitation using sodium acetate instead of ammonium sulfate has given good results.
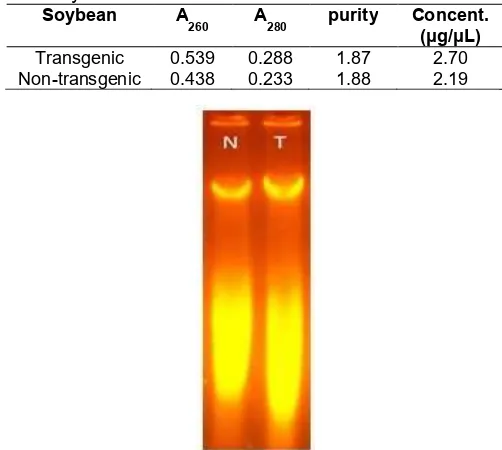
Isolation of DNA from soybeans using this modified method results in the good quality of the DNA as shown by UV absorbance ratio at λ 260 nm to 280 nm (Aλ 260/λ 280). As shown in Table 1, the isolated DNA of transgenic
and non-transgenic soybeans have absorbance ratio 1.871 and 1.880, respectively. Both values are slightly higher than standard 1.800 for pure DNA mean that the DNA still contain some RNA. It is confirm by electrophoresis result (Fig. 2) where DNA of the soybean is shown as a band on the top while the RNA appear as broad smear band at the bottom. The presence of RNA in isolated DNA for PCR template could interfere the result, since the RNA, especially mRNA could inhibit the binding of the primer to the DNA template as well as the elongation process [15]. Fortunately, the PCR for transgenic detection reported here, targeted the promoter of the gene (Promotor 35S) where no mRNA will bind, therefore the presence of RNA in the template will not cause serious problem to the amplification process.
The amount of the DNA need as PCR template depends on the size of the genome of the species. The soybeans have 1.115 Gb diploid [16-17] meaning that for single copy genome in one cell equal to 2.4 pg. To be detected by PCR with 30 standard cycles, the minimum template should be 104copies equal to 24 ng in the case
of soybean genome. However, the P35S could be present in more than one copy in each genome since in
plant transformation the number of a transformed gene expected to be more than one copy. It concludes that protocol of PCR using 50 ng DNA templates is more than enough. Table 1 also shown the data regarding the concentration of isolated DNA where the concentrations of the obtained DNA are 2.70 µg/µL and 2.19 µg/µL for transgenic and non-transgenic soybeans respectively. These amounts of isolated DNA
Table 1. UV-Vis spectroscopy data of isolated DNA from soybeans
Soybean A
260 A280 purity Concent. (μg/μL)
Transgenic 0.539 0.288 1.87 2.70
Non-transgenic 0.438 0.233 1.88 2.19
Fig 2. Electrophoresis analysis result of soybeans isolated DNA (T: CRM transgenic, N: non transgenic negative control)
are much than needed for PCR template since the amount of the template still can be set by dilution of isolated DNA.
Specificity of the Method
The key of specificity PCR is that the primer will attach to the target, in this case, the sequence of CaMV 35S promoter sequence, but will not attach to another sequence. The annealing temperature (Ta) of the PCR also determine the specificity, the higher Ta more specific of the method. The initial experiment usually uses Ta that set based on the melting temperature (Tm) of the primers, where the Ta set not more than 5 °C than the lower primer Tm [18]. Theoretical Tm of For and Rev primers are respectively 56 and 60 °C if calculated by the formula of Marmur [19]. Therefore the initial PCR was done using Ta at 52 °C with the result shown at Fig. 3a. It is shown that PCR only amplify the DNA isolated from transgenic soybeans. Fig. 3b show the PCR results using different annealing temperature in order to get optimum Ta. It shown that even in very low Ta, no amplification appear to be happen for non-transgenic DNA, means that the primers are very specific. Meanwhile, the optimum Ta is 59 °C indicated by the strongest PCR product band represent the number of the amplicon. It also proves that the calculation of theoretical is not always accurate. From this result, it can be concluded that the primers 35S promoter has excellent specificity in detection of transgenic soybeans.
Precision of the Method
PCR is a qualitative analysis, and according to Eurachem guide for method validation [20], a qualitative method should show consistent result through
reproducibility or repeatability test. In this report, the precision test was conducted by repeatability test covering a method of DNA isolation and PCR targeted transgenic and non-transgenic soybeans with ten times replication. The result shows consistent positive amplification for all ten replicates of transgenic soybean and no amplification for all replicates of negative control non-transgenic soybean. This data conclude the performance of the laboratory in running method of RT-PCR test with transgenic soybean using P35S primer has excellent precision and meet the criteria of Codex [21] as well as another reference [22].
Cut off the Methods
Two different cut-off value are determined, the minimum copy number of DNA that can be detected and the minimum content of transgenic in the soybean. The first cut-off was determined without taking count of
Table 2. Test result of commercial soybean and tempeh
No Sample Test result
1 Soybean 1 +
2 Soybean 2 +
3 Soybean 3 +
4 Soybean 4 +
5 Soybean 5
-6 Soybean 6
-7 Soybean 7 +
8 Soybean 8 +
9 Soybean 9 +
10 Soybean 10 +
11 Tempeh 1 +
12 Tempeh 2 +
13 Tempeh 3 +
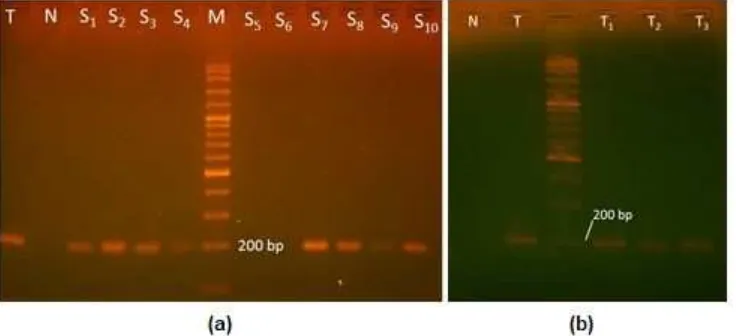
Fig 4.Electrophoresis analysis result of PCR: (a) commercial soybeans (T = transgenic; N = negative control; M = marker; S1-S10= commercial soybeans sample 1 to 10), (b) tempeh sample (T = transgenic; N = negative control; M
the DNA isolation process since nowadays there are many reagent and kit that guarantee of success of DNA isolation. As much as 5 pg of isolated DNA could still give positive amplification. Based on the previous calculation at DNA isolation section it is equal to 2 copies of the soybean genome. If a theoretical calculation is based on the minimum number of the template to give positive detection using electrophoresis is 10,000 then each genome should have 5000 copies of CaMV 35S promoter present in the genome, much higher than any other report of the transgenic plant [23]. Instead, it seems that the method is able to give positive amplification for template less than 10,000 copies, leading to the conclusion that the method has a good performance in term of sensitivity.
The second cut off related to the real content of transgenic in soybeans sample. A tighter regulation with the minimum required performance limit of 0.1% was established for feed containing transgenic had been requested in EU countries [24], however, Indonesian FDA has set the maximum content of transgenic in food is up to 5% [5]. Therefore the minimum requirement for performance limit of the test could be higher as long as less than 5%. The method used control positive of soybean with the transgenic content less than 5% and gave a consistent result. Therefore the method is reliable to be used to monitor or to screen the presence of soybean in Indonesia.
Commercial Transgenic Soybean and Tempeh
Ten sample of soybean was observed, and eight of the samples were tested to be positive as shown in Table 2. Fig. 4a confirmed that the positive sample gave same fragment size of PCR with the positive control of transgenic soybean. This result demonstrates the essential of the regular inspection on the presence of transgenic soybean in the market since many commercial soybeans proven tested as transgenic. As mention earlier that most of the soybeans in Indonesian market are predominantly imported one, therefore there is no surprise to see the results. Fig. 4b shows that three samples of tempeh contain the component transgenic. Considering tempeh producers prefer using imported soybean as raw material which by this study are proven as transgenic soybean.
CONCLUSION
PCR primer specific targeted 35S CaMV promoter is reliable to detect specific transgenic soybean specifically. The optimum annealing temperature is 59 °C can be employed at the 30 cycle standard PCR condition. The method has good precision up without any false positive and false negative results. The cut off
the methods is up to 2 copies of soybean total DNA. The methods are also proven to perform well in detecting the presence of transgenic soybeans in commercial soybeans and tempeh samples.
REFERENCES
[1] Ramessar, K., Capell, T., Twyman, R.M., Quemada, H., and Christou, P., 2008, Trace and traceability-a call for regulatory harmony, Nat. Biotechnol., 26 (9), 975–78.
[2] Key, S., Ma, J.K.C., and Drake, P.M.W., 2008, Genetically modified plants and human health, J. R. Soc. Med., 101 (6), 290–298.
[3] Malatesta, M., Boraldi, F., Annovi, G., Baldelli, B., Battistelli, S., Biggiogera, M., and Quaglino, D., 2008, A long-term study on female mice fed on a genetically modified soybean: Effects on liver ageing,Histochem. Cell Biol., 130 (5), 967–977. [4] Kaur, J., Radu, S., Ghazali, F.M., and Kqueen,
C.Y., 2010, Real-time PCR-based detection and quantification of genetically modified maize in processed feeds commercialised in Malaysia,
Food Control, 21 (11), 1536–1544.
[5] Peraturan Kepala Badan Pengawas Obat Dan Makanan Republik Indonesia, Pedoman Pengkajian Keamanan Pangan Produk Rekayasa Genetik, Nomor Hk.03.1.23.03.12.1563 Tahun 2012.
[6] Benfey, P.N., and Chua, N.H., Plant Promoters, U.S. Patent 5097025A, March 17, 1992.
[7] Berdichevets, I.N., Shimshilashvili, H.R., Gerasymenko, I.M., Sindarovska, Y.R., Sheludko, Y.V., and Goldenkova-Pavlova, I.V., 2010, Multiplex PCR assay for detection of recombinant genes encoding fatty acid desaturases fused with lichenase reporter protein in GM plants, Anal. Bioanal. Chem., 397 (6): 2289–2293.
[8] Tian, F., Wang, X., Teng, D., Yang, Y., Guan, Q., Ao, C., and Wang, J., 2011, Optimization of a multiplex PCR assay for detecting transgenic soybean components in feed products, Appl. Biochem. Biotechnol., 165 (5-6), 1225–1234. [9] Pansiot, J., Chaouachi, M., Cavellini, L.,
Romaniuk, M., Ayadi, M., Bertheau, Y., and Laval, V., 2011, Development of two screening duplex PCR assays for genetically modified organism quantification using multiplex real-time PCR master mixes, Eur. Food Res. Technol., 232 (2), 327–334
[10] Gerdes, L., Busch, U., and Pecoraro, S., 2012, Parallelised real-time PCR for identification of maize GMO events,Eur. Food Res.Technol., 234 (2), 315–322
Determination of the present of transgenic soybean in Indonesian commercial soybean and tempeh using 35S promotor primer by real-time polymerase chain reaction,Int. Food. Res. J., in press.
[12] Miraglia, M., Berdal, K.G., Brera, C., Corbisier, P., Holst-Jensen, A., Kok, E.J., Marvin, H.J.P., Schimmel, H., Rentsch, J., van Ried, J.P.P.F., and Zagon, J., 2004, Detection and traceability of genetically modified organisms in the food production chain, Food Chem. Toxicol., 42 (7), 1157–1180.
[13] Holst-Jensen, A., Bertheau, Y., de Loose, M., Grohmann, L., Hamels, S., Hougs, L., Morisset, D., Pecoraro, S., Pla, M., Van den Bulcke, M., and Wulff, D., 2012, Detecting un-authorized genetically modified organisms (GMOs) and derived materials,
Biotechnol. Adv., 30 (6), 1318–1335.
[14] Sambrook, J., Fritsch, E.F., and Maniatis, T., 1989,
Molecular Cloning: A Laboratory Manual, Cold Spring Harbor Laboratory Press.
[15] Yuen, P.S.T., Brooks, K.M., and Li, Y., 2001, RNA: A method to specifically inhibit PCR amplification of known members of a multigene family by degenerate primers, Nucleic Acids Res., 29 (6), e31.
[16] Shultz, J.L., Kurunam, D., Shopinski, K., Iqbal, M.J., Kazi, S., Zobrist, K., Bashir, R., Yaegashi, S., Lavu, N., Afzal, A.J., Yesudas, C.R., Kassem, M.A., Wu, C., Zhang, H.B., Town, C.D., Meksem, K., and Lightfoot, D.A., 2006, The Soybean Genome Database (SoyGD): a browser for display of duplicated, polyploid, regions and sequence tagged sites on the integrated physical and genetic maps of Glycine max,Nucleic Acids Res., 34, D758–D765. [17] Schmutz, J., Cannon, S.B., Schlueter, J., Ma, J.,
Mitros, T., Nelson, W., Hyten, D.L., Song, Q., Thelen, J.J., Cheng, J., Xu, D., Hellsten, U., May, G.D., Yu, Y., Sakurai, T., Umezawa, T., Bhattacharyya, M.K., Sandhu, D., Valliyodan, B., Lindquist, E., Peto, M., Grant, D., Shu, S., Goodstein, D., Barry, K., Futrell-Griggs, M.,
Abernathy, B., Du, J., Tian, Z., Zhu, L., Gill, N., Joshi, T., Libault, M., Sethuraman, A., Zhang, X.C., Shinozaki, K., Nguyen, H.T., Wing, R.A., Cregan, P., Specht, J., Grimwood, J., Rokhsar, D., Stacey, G., Shoemaker, R.C., and Jackso, S.A., 2010, Genome sequence of the palaeopolyploid soybean,Nature, 463, 178–183.
[18] Lorenz, T.C., 2012, Polymerase chain reaction: Basic protocol plus troubleshooting and optimization strategies,J. Vis. Exp., 63, e3998. [19] Marmur, J., and Doty, P., 1962, Determination of
the base composition of deoxyribonucleic acid from its thermal denaturation temperature, J. Mol. Biol., 5 (1), 109–118.
[20] Magnusson, B., and Örnemark, U., 2014,
Eurachem Guide: The Fitness for Purpose of Analytical Methods – A Laboratory Guide to Method Validation and Related Topics, 2nd ed.,
ISBN 978-91-87461-59-0.
[21] CAC/GL 74, 2010, Codex Guidelines on Performance Criteria and Validationof Methods for Detection, Identification, and Quantification of Spesific DNA Sequences and Spesific Proteins in Foods.
[22] Broeders, S., Huber, I., Grohmann, L., Berben, G., Taverniers, I., Mazzara, M., Roosens, N., and Morisset D., 2014, Guidelines for validation of qualitative real-time PCR methods, Trends Food Sci. Technol., 37 (2), 115–126.
[23] Gadaleta, A., Giancaspro, A., Cardone, M.F., and Blanco, A., 2011, Real-time PCR for the detection of precise transgene copy number in durum wheat,
Cell. Mol. Biol. Lett., 16 (4), 652–668.