Who dominates the trade in
Brazilian soy?
NOVEMBER 2017
TRASE.EARTH | [email protected]
FIGURE 1 Land use by biome in 2015
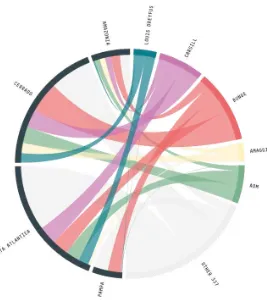
Just ive companies dominated the Brazilian soy trade between 2010 and 2015. In a market comprised of hundreds of traders, the operations of these ive spanned 90% of soy-exporting municipalities, accounting for over half the trade by volume, value and land use. This brief explores the dominance of these top traders, and reveals the unique patterns of procurement that underpin their soy supply chains.
INFOBRIEF | 1
Dimensions of Dominance
The international trade of Brazilian soy is marked by a shifting and expanding group of exporters. Between 2010 and 2015 hundreds of individual companies were involved in the trade.
Less than 100 maintained their presence
throughout the period. Of these, ADM, Amaggi, Bunge, Cargill and Louis Dreyfus (the “ABCD” companies) stood apart as the only traders to have accounted for more than ive percent of the trade in any given year.
Taken together, the collective supply chains of these ive companies comprised 56% of the trade by volume and 57% by value over the six-year period in question.
The unique value in Trase data comes from its ability to link supply chain actors to sub-national sourcing regions, and do so at scale. The map reveals that not only did the top ive traders procure soy from 90% of the soy-exporting municipalities between 2010 and 2015, but also that they were the sole buyers for 247 of these municipalities.
Insights such as these provide the ground for a wide ranging analysis of the potential risks and opportunities facing actors associated with a given supply chain. The traders identiied here not only have a dominant market share, but are uniquely responsible for trade across more than ten percent of Brazil’s soy exporting municipalities.
A JOINT INITIATIVE OF:
MADE POSSIBLE BY:
INFOBRIEF | 1
NOVEMBER 2017
TRASE.EARTH | [email protected]
Patterns of Procurement
The analysis presented here on soy volumes, values and land use is only scratching at the surface of what is possible when linking global commodity supply chains to sub-national sourcing regions. Trase combines municipality-level data sets on sustainability indicators – including territorial deforestation and water scarcity – with company-speciic information such as zero deforestation commitments and other commodity-speciic policies. This makes Trase an unparalleled entry point for understanding the dynamics and sustainability of agricultural commodity supply chains.
NOTES