LAMPIRAN 1
PROGRAM PADA MIKROKONTROLER ATMEGA 8535 /******************************************************* Chip type : ATmega8535
Program type : Application Clock frequency : 11,059200 MHz Memory model : Small
External SRAM size : 0 Data Stack size : 128
*****************************************************/ #include <mega8535.h>
#include <stdio.h> //tambahkan library stdio.h #include <delay.h> // tambahkan library delay disini #define fosc 4000000
#define baud 19200
#define ubrr_val (fosc/(16*baud))-1 #define RXEN 4
#define TXEN 3 #define USBS 3 #define UCSZ0 1 #define USEL 7 #define RXC 7
void usart_init(unsigned int baudr) { //set baud rate
UBRRH=((unsigned char) (baudr>>8)) & (0x7f); UBRRL=(unsigned char) (baudr);
//--- UCSRA=0x00; //aktifkan tx
UCSRB=((1<<RXEN) | (1<<TXEN)); //set frame format: 8 bit, 2 stop bit
UCSRC=(1<<USBS) | (3<<UCSZ0) | (1<<USEL); }
unsigned char Data;
unsigned int i;
{
PORTA=0x00; DDRA=0x00;
PORTB=0x00; DDRB=0xFF;
PORTC=0x00; DDRC=0x00;
PORTD=0x00; DDRD=0x3C;
UCSRA=0x00; UCSRB=0x18; UCSRC=0x86; UBRRH=0x00; UBRRL=0x0C;
usart_init(ubrr_val);
while (1) {
if ((UCSRA & (1<<RXC))){ Data = UDR;
if (Data == 49) {for (i=0;i<10;i++){PORTB.0 = 1; delay_ms(2);PORTB.0 = 0;delay_ms(20); }
delay_ms(5000);
for (i=0;i<10;i++){PORTB.0 = 1; delay_ms(1);PORTB.0 = 0;delay_ms(20); }}
LAMPIRAN 2
PROGRAM PADA VISUAL BASIC Class face recognizer
Public imageWidth As Integer Public imageHeight As Integer
Public NoOfFaces As Integer
Dim Face(1000) As classImageProcessing Dim EigenFace(1000) As classImageProcessing Dim NameOfFace(1000) As String
Dim faceTemplate() As Single
Dim testFace As classImageProcessing Dim testEigenFace As classImageProcessing
Public Identity As classImageProcessing
Public Sub init(image_Width As Integer, image_Height As Integer) imageWidth = image_Width
imageHeight = image_Height
ReDim faceTemplate(imageWidth, imageHeight) End Sub
Public Sub addFace(facePicture As PictureBox, faceName As String) Set Face(NoOfFaces) = New classImageProcessing
Set EigenFace(NoOfFaces) = New classImageProcessing Set testFace = New classImageProcessing
Set testEigenFace = New classImageProcessing Call Face(NoOfFaces).init(imageWidth, imageHeight) Call EigenFace(NoOfFaces).init(imageWidth, imageHeight) Call testFace.init(imageWidth, imageHeight)
Call testEigenFace.init(imageWidth, imageHeight)
Call Face(NoOfFaces).update(facePicture) NameOfFace(NoOfFaces) = faceName NoOfFaces = NoOfFaces + 1
Call updateFaceTemplate Call updateEigenFaces End Sub
Private Sub updateFaceTemplate() 'calculates an average face template Dim i As Integer
Dim x As Integer Dim y As Integer
For i = 0 To NoOfFaces - 1 For x = 0 To imageWidth - 1 For y = 0 To imageHeight - 1 If (i > 0) Then
faceTemplate(x, y) = faceTemplate(x, y) + Face(i).getPoint(x, y) Else
faceTemplate(x, y) = Face(i).getPoint(x, y) End If
Next Next Next
For x = 0 To imageWidth - 1 For y = 0 To imageHeight - 1
faceTemplate(x, y) = Int(faceTemplate(x, y) / NoOfFaces) Next
Next End Sub
Private Sub updateEigenFaces() 'updates all the eigenfaces Dim i As Integer
Dim x As Integer Dim y As Integer Dim df As Integer
For i = 0 To NoOfFaces - 1 For x = 0 To imageWidth - 1 For y = 0 To imageHeight - 1
If (df < 0) Then df = 0
End If
Call EigenFace(i).setPoint(x, y, CByte(df)) Next
Next Next End Sub
Public Function Identify(facePicture As PictureBox) As String 'identifies the given image
Dim i As Integer Dim x As Integer Dim y As Integer Dim df As Integer Dim Distance As Long Dim minDistance As Long Dim retval As String Dim a As Integer Dim b As Integer
retval = ""
Call testFace.update(facePicture)
'calculate the eigenface For x = 0 To imageWidth - 1 For y = 0 To imageHeight - 1
df = testFace.getPoint(x, y) - faceTemplate(x, y) If (df < 0) Then
df = 0 End If
Call testEigenFace.setPoint(x, y, CByte(df)) Next
Next
'compare it to other eigenfaces
minDistance = ((100 - MinimumEigen) * 5000#)
'Form1.Text1.Text = Form1.Text1.Text & "mindistance" & minDistance & vbCrLf
For i = 0 To NoOfFaces - 1 Distance = 0
For x = 0 To imageWidth - 1 For y = 0 To imageHeight - 1 a = EigenFace(i).getPoint(x, y) b = testEigenFace.getPoint(x, y) df = Abs(a - b)
Distance = Distance + df Next
Next
If (Distance < minDistance) Then minDistance = Distance
retval = NameOfFace(i) Set Identity = Face(i)
' Form1.Text1.Text = Form1.Text1.Text & Distance & " redval " & retval & " " & vbCrLf
End If Next
'Form1.Text1.Text = Form1.Text1.Text & vbCrLf Identify = retval
End Function
Class Image Processing Option Explicit
Public width As Integer Public height As Integer Dim image() As Byte
Dim edgeTraced() As Boolean Dim temp() As Boolean
Dim angleHistogram(18) As Integer
Public edgesWidth As Integer Public edgesHeight As Integer Dim Edges() As Byte
Public processType As Integer
Public EdgeThreshold As Single Dim averageContrast As Double
Const IMAGE_RAW = 0 Const IMAGE_RED = 1 Const IMAGE_GREEN = 2 Const IMAGE_BLUE = 3 Const IMAGE_EDGES = 4 Const IMAGE_MOVEMENT = 5
'masks used for edge detection Const NO_OF_EDGE_MASKS = 14 Dim EdgeMask(NO_OF_EDGE_MASKS) Const NO_OF_EDGE_TYPES = 5
Dim EdgeHistogram(NO_OF_EDGE_TYPES) As Integer
Const EDGE_VECTOR_LENGTH = 200
Dim EdgeVector(5, EDGE_VECTOR_LENGTH) As Single Dim currEdgeVector As Integer
Dim maxEdgeVectorIntensity As Integer
Private Function traceSearch(Optional beginSearch As Boolean) As Boolean 'move the trace point in a curcular motion until a new feature is found
'returns TRUE when a new feature is located
Dim tx As Integer Dim ty As Integer
If (beginSearch) Then traceDirection = 0 traceRadius = 90 End If
traceX = traceX + Cos((traceDirection / 180) * 3.14) traceY = traceY + Sin((traceDirection / 180) * 3.14) traceDirection = traceDirection + traceRadius If (traceDirection > 360) Then
traceDirection = 0
traceRadius = traceRadius - 1 If (traceRadius < 0) Then traceRadius = 0
End If End If
If (traceX < 0) Then traceX = 0
End If
If (traceX >= width) Then traceX = width - 1 End If
If (traceY < 0) Then traceY = 0
End If
If (traceY >= height) Then traceY = height - 1 End If
tx = Int(traceX) ty = Int(traceY)
If ((image(tx, ty) > TraceEdgesThresh) And (Not edgeTraced(tx, ty))) Then traceSearch = True
End If End Function
Private Sub calcAngleHistogram()
'calculates a histogram from the angles of edge traces Dim i As Integer
Dim dy As Integer Dim length As Integer Dim angle As Single Dim intensity As Single
For i = 0 To 17
angleHistogram(i) = 0 Next
For i = 0 To currEdgeVector - 1
dx = EdgeVector(0, i) - EdgeVector(2, i) dy = Abs(EdgeVector(1, i) - EdgeVector(3, i)) length = Sqr((dx * dx) + (dy * dy))
If (length > 0) Then
angle = (Cos(dy / length) / 3.14) * 180 If (dx < 0) Then
angle = 180 - angle End If
angle = Int(angle / 10)
intensity = 1 'EdgeVector(4, i) / 255
angleHistogram(angle) = angleHistogram(angle) + (length * intensity) End If
Next End Sub
Private Sub initEdgeMasks() Dim mask
Dim i As Integer Dim mstr As String
'Lines -
EdgeMask(0) = Array(1, 1, 1, _ 0, 0, 0, _ 0, 0, 0, _ 1)
EdgeMask(1) = Array(0, 0, 0, _ 1, 1, 1, _ 0, 0, 0, _ 1)
0, 0, 0, _ 1, 1, 1, _ 1) 'Lines |
EdgeMask(3) = Array(1, 0, 0, _ 1, 0, 0, _ 1, 0, 0, _ 2)
EdgeMask(4) = Array(0, 1, 0, _ 0, 1, 0, _ 0, 1, 0, _ 2)
EdgeMask(5) = Array(0, 0, 1, _ 0, 0, 1, _ 0, 0, 1, _ 2) 'Diagonals
EdgeMask(6) = Array(0, 0, 1, _ 0, 1, 0, _ 1, 0, 0, _ 3)
EdgeMask(7) = Array(0, 1, 0, _ 1, 0, 0, _ 0, 0, 0, _ 3)
EdgeMask(8) = Array(0, 0, 0, _ 0, 0, 1, _ 0, 1, 0, _ 3)
EdgeMask(9) = Array(1, 0, 0, _ 0, 1, 0, _ 0, 0, 1, _ 4)
EdgeMask(10) = Array(0, 1, 0, _ 0, 0, 1, _ 0, 0, 0, _ 4)
EdgeMask(12) = Array(1, 0, 1, _ 0, 1, 0, _ 1, 0, 1, _ 5)
EdgeMask(13) = Array(0, 1, 0, _ 1, 1, 1, _ 0, 1, 0, _ 5)
Dim mask Dim i As Integer Dim mstr As String
'Lines -
EdgeMask(0) = Array(1, 1, 1, _ 0, 0, 0, _ 0, 0, 0, _ 1)
EdgeMask(1) = Array(0, 0, 0, _ 1, 1, 1, _ 0, 0, 0, _ 1)
EdgeMask(2) = Array(0, 0, 0, _ 0, 0, 0, _ 1, 1, 1, _ 1) 'Lines double -
EdgeMask(3) = Array(1, 1, 1, _ 1, 1, 1, _ 0, 0, 0, _ 1)
EdgeMask(4) = Array(0, 0, 0, _ 1, 1, 1, _ 1, 1, 1, _ 1) 'Lines |
EdgeMask(5) = Array(1, 0, 0, _ 1, 0, 0, _ 1, 0, 0, _ 2)
0, 1, 0, _ 2)
EdgeMask(7) = Array(0, 0, 1, _ 0, 0, 1, _ 0, 0, 1, _ 2)
EdgeMask(8) = Array(1, 1, 0, _ 1, 1, 0, _ 1, 1, 0, _ 2)
EdgeMask(9) = Array(0, 1, 1, _ 0, 1, 1, _ 0, 1, 1, _ 2) 'Diagonals
EdgeMask(10) = Array(0, 0, 1, _ 0, 1, 0, _ 1, 0, 0, _ 3)
EdgeMask(11) = Array(0, 0, 1, _ 0, 1, 1, _ 1, 1, 0, _ 3)
EdgeMask(12) = Array(0, 1, 1, _ 1, 1, 0, _ 1, 0, 0, _ 3) EdgeMask(13) = Array(1, 0, 0, _ 0, 1, 0, _ 0, 0, 1, _ 4)
EdgeMask(14) = Array(1, 1, 0, _ 0, 1, 1, _ 0, 0, 1, _ 4)
EdgeMask(15) = Array(1, 0, 0, _ 1, 1, 0, _ 0, 1, 1, _ 4) 'Crosses
1, 0, 1, _ 5)
EdgeMask(17) = Array(0, 1, 0, _ 1, 1, 1, _ 0, 1, 0, _ 5) 'nothing
EdgeMask(18) = Array(0, 0, 0, _ 0, 0, 0, _ 0, 0, 0, _
0) 'last number indicates edge type EdgeMask(19) = Array(1, 1, 1, _
1, 1, 1, _ 1, 1, 1, _ 0) End Sub
Public Sub traceEdges() 'traces edges within the image Dim finished As Boolean Dim x As Integer
Dim y As Integer Dim traced As Boolean
finished = False traced = False x = 0
y = 0
While (Not finished) x = x + 1
If (x = width) Then y = y + 1
x = 0 End If
If (y < height) Then
If ((edgeTraced(x, y) = False) And (image(x, y) > TraceEdgesThresh)) Then traced = traceEdgesFromPoint(x, y, 0)
If (Not traced) Then finished = True End If
traced = False End If
Wend
Call sortEdgeVector Call calcAngleHistogram
End Sub
Public Sub traceEdges_old() 'traces edges within the image
Dim x As Integer Dim y As Integer
traceX = 0 traceY = 0
Call traceSearch(True) While (traceRadius > 0) If (traceSearch()) Then traceRadius = 90 x = Int(traceX) y = Int(traceY)
If (traceEdgesFromPoint(x, y, 0)) Then traceX = x
traceY = y End If End If Wend
'Call sortEdgeVector Call calcAngleHistogram
End Sub
'this allows edge tracing to be more noise tollerant Dim x As Integer
Dim y As Integer Dim i As Integer Dim value As Integer
For i = 0 To 1
For x = 1 To width - 2 For y = 1 To height - 2
If (image(x, y) > TraceEdgesThresh) Then image(x, y) = 255
End If Next Next Next
End Sub
Public Function traceEdgesFromPoint(ByRef x As Integer, ByRef y As Integer, ByRef edgeLength As Integer) As Boolean
'traces along edges starting at the given point Dim i As Integer
Dim j As Integer Dim sx As Integer Dim sy As Integer Dim xx As Integer Dim yy As Integer
Dim pathFound As Boolean Dim initialEdgeLength As Integer Dim mindirection As Single Dim maxdirection As Single Dim initialX As Integer Dim initialY As Integer Dim max As Integer Dim value As Integer Dim intensity As Single Dim direction As Integer
Static averagedirection As Single Dim directionDifference As Integer Dim thresh As Integer
initialX = x initialY = y xx = initialX yy = initialY
initialEdgeLength = edgeLength intensity = 0
thresh = 0 ' TraceEdgesThresh / 2
If (initialEdgeLength = 0) Then For i = 0 To width - 1
For j = 0 To height - 1 temp(i, j) = False Next
Next End If
averagedirection = 0
traceEdgesFromPoint = False
While ((image(xx, yy) > thresh) And (temp(xx, yy) = False)) sx = xx
sy = yy
temp(xx, yy) = True
edgeLength = edgeLength + 1
If (edgeTraced(xx, yy) = False) And (edgeLength > minEdgeLength) Then traceEdgesFromPoint = True
End If
pathFound = False max = 0
If (sy > 0) Then
value = image(sx, sy - 1)
If ((value > thresh) And (temp(sx, sy - 1) = False)) Then
If (value > max) And ((averagedirection > 270) Or (averagedirection < 90)) Then
max = value xx = sx yy = sy - 1 direction = 0 End If
If (sx < width - 1) Then
If (sy > 0) Then
value = image(sx + 1, sy - 1)
If ((value > thresh) And (temp(sx + 1, sy - 1) = False)) Then
If (value > max) And ((averagedirection > 315) And (averagedirection < 135)) Then
max = value xx = sx yy = sy - 1 direction = 45 End If
End If End If
value = image(sx + 1, sy)
If ((value > thresh) And (temp(sx + 1, sy) = False)) Then
If (value > max) And ((averagedirection > 0) And (averagedirection < 180)) Then
max = value xx = sx + 1 yy = sy direction = 90 End If
End If
If (sy < height - 1) Then value = image(sx + 1, sy + 1)
If ((value > thresh) And (temp(sx + 1, sy + 1) = False)) Then
If (value > max) And ((averagedirection > 45) And (averagedirection < 225)) Then
max = value xx = sx yy = sy + 1 direction = 135 End If
End If End If
If (sy < height - 1) Then value = image(sx, sy + 1)
If ((value > thresh) And (temp(sx, sy + 1) = False)) Then
If (value > max) And ((averagedirection > 90) And (averagedirection < 270)) Then
max = value xx = sx yy = sy + 1 direction = 180 End If
End If End If
If (sx > 0) Then
If (sy < height - 1) Then value = image(sx - 1, sy + 1)
If ((value > thresh) And (temp(sx - 1, sy + 1) = False)) Then
If (value > max) And ((averagedirection > 135) And (averagedirection < 315)) Then
max = value xx = sx - 1 yy = sy + 1 direction = 225 End If
End If End If
value = image(sx - 1, sy)
If ((value > thresh) And (temp(sx - 1, sy) = False)) Then
If (value > max) And ((averagedirection > 180) Or (averagedirection = 0)) Then
max = value xx = sx - 1 yy = sy
direction = 270 End If
End If
If (sy > 0) Then
value = image(sx - 1, sy - 1)
If (value > max) And ((averagedirection > 225) Or (averagedirection < 45)) Then
max = value xx = sx - 1 yy = sy - 1 direction = 315 End If
End If End If End If
If (averagedirection > 0) Then intensity = (intensity + max) / 2
directionDifference = Abs(averagedirection - direction) If (directionDifference > 180) Then
directionDifference = 360 - directionDifference End If
averagedirection = averagedirection - (directionDifference / 2) If (averagedirection < 0) Then
averagedirection = 360 + averagedirection End If
If (averagedirection > 360) Then
averagedirection = averagedirection - 360 End If
If ((edgeLength > 3) And (directionDifference > 20) And (traceEdgesFromPoint)) Then
Call addEdgeVector(initialX, initialY, xx, yy, intensity) initialX = xx
initialY = yy End If
Else
intensity = max
averagedirection = direction End If
Wend
If (traceEdgesFromPoint = True) Then
If (initialEdgeLength = 0) Then
'If (edgeLength > minEdgeLength) Then For i = 0 To width - 1
For j = 0 To height - 1 If (temp(i, j) = True) Then edgeTraced(i, j) = True End If
Next Next 'End If End If x = xx y = yy
traceDirection = direction
End Function
Private Sub addEdgeVector(x1 As Integer, y1 As Integer, x2 As Integer, y2 As Integer, intensity As Single)
'adds a new edge vector
If (currEdgeVector < EDGE_VECTOR_LENGTH) Then EdgeVector(0, currEdgeVector) = x1
EdgeVector(1, currEdgeVector) = y1 EdgeVector(2, currEdgeVector) = x2 EdgeVector(3, currEdgeVector) = y2 EdgeVector(4, currEdgeVector) = intensity If (intensity > maxEdgeVectorIntensity) Then maxEdgeVectorIntensity = intensity
End If
currEdgeVector = currEdgeVector + 1 End If
End Sub
Private Sub sortEdgeVector() 'sorts the edge vector by distance
Dim dy As Integer Dim length As Long Dim mindist As Long Dim closest As Integer Dim vect As Single Dim i As Integer Dim j As Integer
For i = 0 To currEdgeVector - 2 mindist = 99999
closest = 0
For j = i + 1 To currEdgeVector - 1 dx = EdgeVector(2, i) - EdgeVector(0, j) dy = EdgeVector(3, i) - EdgeVector(1, j) length = (dx * dx) + (dy * dy)
If (length < mindist) Then mindist = length
closest = j End If Next
If ((closest > 0) And (closest <> i + 1)) Then 'swap
For j = 0 To 4
vect = EdgeVector(j, i + 1)
EdgeVector(j, i + 1) = EdgeVector(j, closest) EdgeVector(j, closest) = vect
Next End If Next End Sub
Private Function dist(x1 As Single, y1 As Single, x2 As Single, y2 As Single) As Single
Dim dx As Single Dim dy As Single
dx = x1 = x2 dy = y1 - y2
Public Sub getEdges() 'updates the edges
Dim mask Dim i As Integer Dim j As Integer Dim x As Integer Dim y As Integer Dim xx As Integer Dim yy As Integer Dim diff As Long Dim thresh As Integer Dim diff2 As Long Dim estr As String Dim minDiff As Long Dim winner As Integer Dim ex As Integer Dim ey As Integer Dim av As Integer
thresh = 100
For i = 0 To NO_OF_EDGE_TYPES - 1 EdgeHistogram(i) = 0
Next x = 0 ex = 0
While (x < width - 2) y = 0
ey = 0
While (y < height - 2) Edges(ex, ey) = 0 minDiff = 9999999 winner = -1
For i = 0 To NO_OF_EDGE_MASKS - 1 mask = EdgeMask(i)
diff = 0 j = 0 av = 0
For xx = x To x + 2 av = av + image(xx, yy)
diff2 = Abs((mask(j) * 255) - image(xx, yy)) diff = diff + diff2
j = j + 1 Next Next
If (av / 9 > 30) Then
'edge
diff = diff / 9
If (diff < minDiff) And (diff < thresh) Then winner = mask(9)
minDiff = diff
Edges(ex, ey) = winner End If
Else 'blank winner = 0
Edges(ex, ey) = winner
End If Next
'Edges(ex, ey) = Rnd * 5 'test If (winner > 0) Then
EdgeHistogram(winner - 1) = EdgeHistogram(winner - 1) + 1 End If
ey = ey + 1 y = y + 2 Wend ex = ex + 1 x = x + 2 Wend
'fill in the gaps
Call getEdges_secondary
Public Sub getEdges_secondary()
'fills in edges where they "should" appear Dim x As Integer
Dim y As Integer
For x = 1 To edgesWidth - 1 For y = 1 To edgesHeight - 1 'horizontal
If ((Edges(x - 1, y) > 0) And (Edges(x + 1, y) > 0)) Then Edges(x, y) = 1
Else 'vertical
If ((Edges(x, y - 1) > 0) And (Edges(x, y + 1) > 0)) Then Edges(x, y) = 2
Else 'diagonal
If ((Edges(x - 1, y - 1) > 0) And (Edges(x + 1, y + 1) > 0)) Then 'Edges(x, y) = 4
Else 'diagonal
If ((Edges(x + 1, y - 1) > 0) And (Edges(x - 1, y + 1) > 0)) Then 'Edges(x, y) = 3
End If End If End If End If
If ((Edges(x + 1, y) <> 1) And (Edges(x + 1, y) = Edges(x, y))) Then Edges(x, y) = 0
End If
If ((Edges(x, y + 1) <> 2) And (Edges(x, y + 1) = Edges(x, y))) Then Edges(x, y) = 0
End If
'surrounded by edges
If ((Edges(x - 1, y - 1) > 0) And (Edges(x - 1, y) > 0) And (Edges(x - 1, y + 1) > 0) And (Edges(x, y - 1) > 0) And (Edges(x, y + 1) > 0) And (Edges(x + 1, y - 1) > 0) And (Edges(x + 1, y) > 0) And (Edges(x + 1, y + 1) > 0)) Then
Edges(x, y) = 0 End If
Next Next
End Sub
Public Sub init(imageWidth As Integer, imageHeight As Integer) width = imageWidth
height = imageHeight ReDim image(width, height)
ReDim edgeTraced(width, height) ReDim temp(width, height) minEdgeLength = 10
edgesWidth = width / 2 edgesHeight = height / 2
ReDim Edges(edgesWidth, edgesHeight) EdgeThreshold = 0
processType = 0 Call initEdgeMasks averageContrast = 1
ReDim picked(width, height) End Sub
Private Sub calcEdgeVector()
'calculates the edge vector for the image Dim i As Integer
For i = 0 To EDGE_VECTOR_LENGTH - 1
Next
End Sub
Public Sub whiteNoise() Dim x As Integer Dim y As Integer
For y = 0 To height - 1 image(x, y) = Rnd * 255 Next
Next End Sub
Public Function getPoint(x As Integer, y As Integer) As Byte getPoint = image(x, y)
End Function
Public Function setPoint(x As Integer, y As Integer, value As Byte) image(x, y) = value
End Function
Public Sub update(canvas As PictureBox, Optional left As Variant, Optional top As Variant, Optional wdth As Variant, Optional hght As Variant)
'import a picture
'processtype = 0 greyscale ' 1 red
' 2 green ' 3 blue ' 4 edges ' 5 movement
Dim screenLeft As Single Dim screenTop As Single
If (Not IsMissing(left)) And (Not IsMissing(top)) Then screenLeft = left
screenTop = top screenWidth = wdth screenHeight = hght Else
screenLeft = 0 screenTop = 0
screenWidth = canvas.ScaleWidth screenHeight = canvas.ScaleHeight End If
w = CInt(screenWidth / width) If (w < 1) Then
w = 1 End If
h = CInt(screenHeight / height) If (h < 1) Then
h = 1 End If
pixels = w * h
maxCol = RGB(255, 255, 255) For x = 0 To width - 1
For y = 0 To height - 1 edgeTraced(x, y) = False
screenX = screenLeft + ((x / width) * screenWidth) screenY = screenTop + ((y / height) * screenHeight) value = 0
For xx = screenX To screenX + w - 1 For yy = screenY To screenY + h - 1
RGBval = canvas.Point(xx, yy) Select Case processType Case 0 'greyscale
value = value + (RGBval / maxCol) Case 1 'red
value = value + ((RGBval And 65280) / 65280) Case 3 'blue
value = value + ((RGBval And 16711680) / 16711680) End Select
Next Next
value = (value / pixels) * 255
image(x, y) = value Next
Next
End Sub
Public Sub getImageEdges(rawImage As classImageProcessing) 'extracts edges from the given image
Dim x As Integer Dim y As Integer Dim value As Single Dim scalex As Single Dim scaley As Single Dim xx As Integer Dim yy As Integer Dim p1 As Integer Dim p2 As Integer
Dim avContrast As Double
scalex = rawImage.width / width scaley = rawImage.height / height
currEdgeVector = 0
maxEdgeVectorIntensity = 0
avContrast = 0
For x = 1 To width - 1 For y = 1 To height - 1 edgeTraced(x, y) = False xx = x * scalex
yy = y * scaley
p1 = rawImage.getPoint(xx, yy) p2 = rawImage.getPoint(xx - 1, yy) value = Abs(p1 - p2)
p2 = rawImage.getPoint(xx, yy - 1) value = value + Abs(p1 - p2) value = value / (255 * 2)
avContrast = avContrast + value
'If (Abs(value - averageContrast) < EdgeThreshold) Then If (value < EdgeThreshold) Then
value = 0 Else
value = 255 * value End If
image(x, y) = value End If
Next Next
'calc average contast
avContrast = avContrast / (width * height) averageContrast = avContrast
If (averageContrast < 0.01) Then averageContrast = 0.01
End If
'calc threshold used for tracing along edges
TraceEdgesThresh = (averageContrast * 255) * 0.1
'Call diffuseEdges
'Call getEdges Call traceEdges
End Sub
Public Sub getImageContours(rawImage As classImageProcessing) 'extracts edges from the given image
Dim scaley As Single Dim xx As Integer Dim yy As Integer Dim p1 As Integer Dim p2 As Integer Dim value2 As Single Dim max As Single
scalex = rawImage.width / width scaley = rawImage.height / height
currEdgeVector = 0
maxEdgeVectorIntensity = 0 max = 1 - EdgeThreshold
For x = 1 To width - 1 For y = 1 To height - 1 edgeTraced(x, y) = False xx = x * scalex
yy = y * scaley
If ((xx >= 1) And (yy >= 1)) Then p1 = rawImage.getPoint(xx, yy) p2 = rawImage.getPoint(xx - 1, yy) value = Abs(p1 - p2)
p2 = rawImage.getPoint(xx, yy - 1) value = value + Abs(p1 - p2) value = value / (255 * 2)
value2 = value - EdgeThreshold If (value2 < 0) Then
value = 0 Else
value = 255 - (255 * (value2 / max)) End If
image(x, y) = value End If
Next Next End Sub
Dim y As Integer
Dim screenX(2) As Single Dim screenY(2) As Single Dim value As Byte
Dim c As Long Dim i As Integer
If (processType <> 4) Then
canvas.FillStyle = 0 For x = 0 To width - 1 For y = 0 To height - 1 value = image(x, y) Select Case processType Case 1 'red
c = RGB(value, 0, 0) Case 2 'green
c = RGB(0, value, 0) Case 3 'blue
c = RGB(0, 0, value) Case 4 'edges
value = 255 - value
c = RGB(value, value, value) Case Else
c = RGB(value, value, value) End Select
canvas.FillColor = c
screenX(0) = (x / width) * canvas.ScaleWidth screenY(0) = (y / height) * canvas.ScaleHeight screenX(1) = ((x + 1) / width) * canvas.ScaleWidth screenY(1) = ((y + 1) / height) * canvas.ScaleHeight
canvas.Line (screenX(0), screenY(0))-(screenX(1), screenY(1)), c, B Next
Next Else
'Call showEdges(canvas) canvas.Cls
Call showEdgeTraces(canvas)
End Sub
Public Sub showEdgeTraces(canvas As PictureBox) Dim x As Integer
Dim y As Integer
Dim screenX(2) As Single Dim screenY(2) As Single Dim value As Byte
Dim c As Long Dim i As Integer
'canvas.Cls
canvas.FillStyle = 0 For x = 0 To width - 1 For y = 0 To height - 1
If (edgeTraced(x, y) = True) Then c = RGB(230, 230, 230)
canvas.FillColor = c
screenX(0) = (x / width) * canvas.ScaleWidth screenY(0) = (y / height) * canvas.ScaleHeight screenX(1) = ((x + 1) / width) * canvas.ScaleWidth screenY(1) = ((y + 1) / height) * canvas.ScaleHeight
canvas.Line (screenX(0), screenY(0))-(screenX(1), screenY(1)), c, B End If
Next Next
Call showEdgeVector(canvas)
End Sub
Public Sub showEdgeVector(canvas As PictureBox) Dim x1 As Integer
Dim y1 As Integer Dim x2 As Integer Dim y2 As Integer
Dim screenX(2) As Single Dim screenY(2) As Single Dim value As Byte
Dim i As Integer Dim radius As Integer
'canvas.Cls
canvas.FillStyle = 0 canvas.DrawWidth = 1
radius = (canvas.ScaleWidth / width) / 2 For i = 0 To currEdgeVector - 1
x1 = EdgeVector(0, i) y1 = EdgeVector(1, i) x2 = EdgeVector(2, i) y2 = EdgeVector(3, i)
'c = RGB((EdgeVector(4, i) / maxEdgeVectorIntensity) * 255, 0, 0) c = RGB(i, 0, 0)
canvas.FillColor = c
screenX(0) = (x1 / width) * canvas.ScaleWidth screenY(0) = (y1 / height) * canvas.ScaleHeight screenX(1) = (x2 / width) * canvas.ScaleWidth screenY(1) = (y2 / height) * canvas.ScaleHeight If (i > 0) Then
canvas.Line -(screenX(0), screenY(0)), c End If
canvas.Line (screenX(0), screenY(0))-(screenX(1), screenY(1)), c 'canvas.Circle (screenX(0), screenY(0)), radius, c
'canvas.Circle (screenX(1), screenY(1)), radius, c Next
End Sub
Public Sub showEdges(canvas As PictureBox) Dim x As Integer
Dim y As Integer
Dim screenX(2) As Single Dim screenY(2) As Single Dim edgeType As Byte Dim c As Long
Dim i As Integer
canvas.FillStyle = 0 c = RGB(0, 0, 0)
For x = 0 To edgesWidth - 1 For y = 0 To edgesHeight - 1
screenX(0) = (x / edgesWidth) * canvas.ScaleWidth screenY(0) = (y / edgesHeight) * canvas.ScaleHeight screenX(1) = ((x + 1) / edgesWidth) * canvas.ScaleWidth screenY(1) = ((y + 1) / edgesHeight) * canvas.ScaleHeight
edgeType = Edges(x, y) Select Case edgeType Case 1 'horizontal line
canvas.Line (screenX(0), screenY(0))-(screenX(1), screenY(0)), c Case 2 'vertical line
canvas.Line (screenX(0), screenY(0))-(screenX(0), screenY(1)), c Case 3 'diagonal /
canvas.Line (screenX(0), screenY(1))-(screenX(1), screenY(0)), c Case 4 'diagonal \
canvas.Line (screenX(0), screenY(0))-(screenX(1), screenY(1)), c Case 5 'cross
canvas.Line (screenX(0), screenY(0))-(screenX(1), screenY(0)), c canvas.Line (screenX(0), screenY(0))-(screenX(0), screenY(1)), c End Select
Next Next
End Sub
Public Sub showEdgeHistogram(chart As Object) 'displays edge histogram using MS chart control
Dim i As Integer Dim estr As String
chart.chartType = 7
chart.RowCount = NO_OF_EDGE_TYPES chart.ColumnCount = 1
estr = ""
chart.Row = i + 1
chart.Data = EdgeHistogram(i) estr = estr & EdgeHistogram(i) & ", " Next
chart.Refresh 'MsgBox estr
End Sub
Public Sub showAngleHistogram(chart As Object) 'displays angle histogram using MS chart control
Dim i As Integer Dim estr As String
chart.chartType = 7 chart.RowCount = 18 chart.ColumnCount = 1
estr = ""
For i = 0 To chart.RowCount - 1 chart.Row = i + 1
chart.Data = angleHistogram(i) estr = estr & angleHistogram(i) & ", " Next
chart.Refresh 'MsgBox estr
LAMPIRAN 3
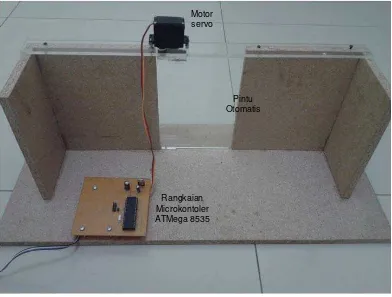
GAMBAR SISTEM PERALATAN
Foto Alat :
Pintu Otomatis Motor
servo
Rangkaian Microkontoler ATMega 8535
Rangkaian Mikrokontroler ATMega 8535
Pintu Otomatis Mikrokontroler
ATMega8535
PC
Motor Servo