C ons truc t iotl M ate rial s and St ructu re s S.O. Ekolu et al. (Eds.)
IOS Press,2al4
@ 2014 The authors arul IOS Press. All rights reserved. do i : I 0. 32 3 3.O78- l -6 I 499-466-4- I 445
Comparison
of
simple linear
regression
and
multiple
linear
regression
for
estimating
fuel
use and
emission
rates
for
excavators
Heni
FITRIANI'r
and Ptrit LgWlSb.
^Civil Engineering Deparlment. University of Sriwija.va, lndonesiaoschool
of Civil and Environmental Engineering, Stillwater, Oklahoma, USA
Abstract. Healy-duty diesel (HDD) construction equipment consumes a significant amount
of
fuel and subsequently emitsa
substantial amount of pollutants into the environment. ln most construction activities, HDD construction equipment is the primary source of emissions. The purpose of this paper is to denlonshate the comparative models for estimating fuel use and emission rates for HDD construction equipment specifically excayators. Second by second data were collected from portable emission measurement system (PEMS), containing fuel use and emiss'ion rates datasets along with engine performance data from tlrree excavators. Emission pollutants include nitrogen oxides (NO*). hydrocarbons (HC), carbon monoxide (CO), carbon dioxide (CO:). and particulate matter (PM). For each excavator, predictive models were developed using simple l:inearregression (SLR) and multiple linear regression (MLR). Results yieided that the MLR accounted for the highest percentage of variability in the data compared to SLR based on the values of coefficient of determination (R:) for each model. ln order to exhibit the significant impact of which engine data that may afl'ect the emission rates, the variable impact analysis was also conducted.
Kepvords. Healy-duty diesel (HDD) construction equipment, fuel use, emission, portable emission measurement system (PEMS)
Introduction
The construction sector plays an essential role
in
improving climate change due to theimpact
of
greenhouse gas (GHG) emissionsprimarily
causedby its
major activities. Construction activities consume a significant amountof
fuel and consequently emit asubstantial amount of pollutants into the environment. According to the United States
Environmental Protection Agency
[2],
there are approximatelytwo million
itemsof
construction and mining equipment
in
the United States that spend aboutsix billion
gallons of diesel fuel annually. Furthermore, in most consfruction activities, heavy-duty
diesel (HDD) consfuction equipment is the primary source of emissions. The EPA also estimates that in 2005, HDD construction vehicles produced U.S. national annual totals of 657,000 tons of NO^, 1,100,000 tons of CO, 63,000 tons of PM10 and 94,000 tons
of
so,
[2].tCorrespondin g author:
1446
H. Fitriani and P. Lewis / Simple Linear Regression and Multiple Linear RegressionOf
these pollutants,NO,
and PM are the most prominent amongHDD
equipment[3].
Other pollutantsfound
in
diesel exhaust(DE)
include hydrocarbons(HC)
andcarbon
dioxide (COl).
In
order
to
quantifu and
characterizethe
HDD
emissionsproblem, reliable prediction models are needed; however, most emission prediction tools are based on engine dynamometer data and not real-world data [1]. The objective
of
this paperis to
demonstratetwo
different predictive modeling methodologiesfor
estimating
fuel
use and emission ratesfor HDD
construction equipment, specificallyexcavators, based on real-world data.
l.
Previouswork
As
the need
of
conforming
to
emission standardshas been largely
increasing,numerous studies have been extensively piloted to quanti$r and characterize emissions
and energy consumption
of
HDD
construction equipment.Many
studies have been completed using experimental desigrs such as dynamometer tests and real-world in-use measurements. Dynamometer tests are commonly usedin
quantifuing emissions atsteady-state
conditions
in
the
iaboratory.
Other
studies conducted
emissionquantification by engaging Portable Emission Measurement Systems (PEMS), models,
and simulations. The Environmental Protection Agency (EPA) and other government agency also develop other models such as the Nonroad model, the Offroad model, and the Urbemis model.
PEMS
is
generally usedto
gatherfuel
use and emissionsfield
dataof
vehiclesbased
upon real-world
measurement. In-use emissions quantification enables datacollection by capturing the actual duty cycle on second
by
second basis measurement.Commercial PEMS are obtainable for any kinds of applications as well as for different types
of
fuel
use. Someof
the most prominent real-world emissions measurementsfrom
HDD
construction equipmentwere
completedby
the
researchersat
NorthCarolina
StateUniversity
[1,
5,6,7,8].
Other
researchersfrom West Virginia
University and the University
of
California-
Riverside aiso directed their studies onthe use of on-board emission measurement for particular construction equipment.
2. Methodology
This paper presents
two
different predictive modeling methodologiesfor
estimating fuel use and emissions rates based on the real-world dataqet frqm the research team atNorth
Carolina State University. Simple linear regression(SLR)
andmultiple
linearregression
(MLR)
models were developed and comparedfor
three excavators. Engineperformance data
from
the excavators, including manifold absolute pressure (MAP), revolutions per minute (RPM), and intake air temperature(IAT),
were used to developprediction models for fuel use and emission rates of NO,, HC, CO, CO2, and PM.
Table
I
displaysthe
summaryof
engineattribute data
for
each
excavator,rncluding engine size (HP), displacement, model year, and EPA engine tier. The rated engine horsepower (HP) ranged from 93 HP to 254
IIP
and the model year ranged fromt
H- l-itriani and P. Izwis / Simple Linear Regressiorz tuttl Multiple Linear Regression
'I'able 1. Surnrnary ofengine attribute data
Equipment Horsepower Displacement Model
(HP) (Liters) Year Tier
I 254 8.3 2001 I
Excavator 2 138 6.4 2003 2
Excavator 3 93 3.9 1998 I
3. Simple
linear
regressionSimple linear regression models were developed to determine the relationship between
a single response variable and a single predictor variable. Since
it
has been shown by others thatMAP
ishighly
correiatedto fuel
use and emission rates[4, 5, 7],
simple linear regression models were formulated based on the reiationship betweenMAP
as apredictor variable and
fuel
use as a response variable, aswell
asMAP
and mass pertime (grams per second) emission rates of
NO,,
HC, CO, CO2, andPM.
These SLRmodels take the form of:
Yt-a
:ax*c
where: Yr-o a
x
c
(1)
= Fuel use or emission rate of NO*, HC, CO, CO2, or PM (y's)
:
slopeofthe
regression line:
MAP (kilopascal):
y-intercept ofregression line4.
Multiple linear
regressionMultiple
linear regression was usedto
model the relationship between three predictorvariables based
on
engine performance data(MAP, RPM,
IAT)
and one responsevariable (either fuel use or emission rate of NO,, HC, CO, CO2, and PM).
The
MLR
equationsfor fuel
use and emission ratesfor
each pollutant take theform of:
Yr.a
:
/lo +FXr
+/$z+
ll{:
where:Yt-o :
Fuel use or emission rate of NO", HC, CO, CO2, or PM(ls)
Xi
:
MAP
(kilopascal)X2
:
Revolutions Per Minute (RPM)Xr
:
IntakeAir
Temperature (Celsius degrees) 00, 9,,0r. p3:
Coefficients of linear reiationship1448
IL Fitriani and P. Lewis / Simple Linear Regression and Multiple Linear Reg,ression5. Results
This section presents the results fr:r two predictive modeling methodologies
-
SLR andMLR-
for excavators, as well as variable correlations and modei comparisons for thosemodels. The validation results for the models
for all
three excavators are presented inTable 5.
Table
2
shows the summaryof
the Pearson correlation coefficientsfor all
threeexcavators, indicating the relationship between engine data,
fuel
use, and emissionrates.
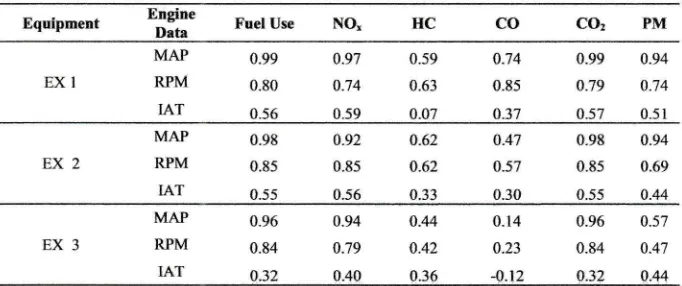
MAP
has a strong positive relationshipwith
fuel use and emission rates ofNO,,
CO2, and
PM, but
a moderate positive relationshipwith HC
and CO.RPM
has the second strongest relationship with fuel use and emission rates. Meanwhile,IAT
has theweakest relationship
with
'uel use and emission rates as indicatedby
the lower (and sometimes negative) values of correlation to the specified response variables.Table 2. Summary ofPearson correlations coefficients
Equipment
E-ngne
Fuel LjseData
gx1
MAP RPM IAT
0.99 0.80 0.56
0.97
0_74 059
0.59 0.63 0.07
0.74 0.85
o.3'7
0.99 0.79
0.5'7 0_94
0.74
0.51 MAP
RPM tAT
0.98 0.85 0.55
0.92
0.85 0.56
0.62 4.62
0.33
0.98 0.8s 0.55
4.94 0.69 0.44
0-47
0.57 0.30
EX3
5.1 Simple linear regression models
Based on their high correlation values, SLR models were deveioped using
MAP
as apredictor variable
to
predictfuel
use and emission ratesof
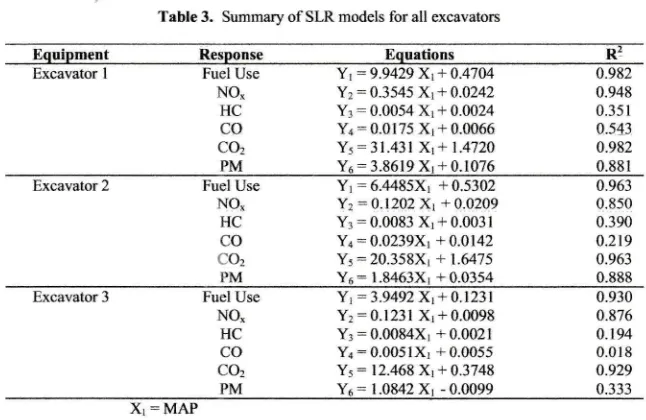
each pollutant. Table 3 presents the results of the SLR models for all three excavators. These models are basedon
more
than
19,000 observationsof
second-by-second,real-world
fuel
use andemissions data
for
excavator2
and3, and around 7,000 observationsfor
excavator 1.Based
on the
coefficientof
determinatiol (R2), these models accountedfor
a
highpercentage
of
the variabilityin
the data for fuel use, NOx, CO2 andPM.
HC and COhad the lowest R2 value, indicating much
variability in
the data, and therefore were moredifficult
to predict.MAP RPM IAT
0.96 0.84 0.32
0.94 0.79 0.40
0. l4
0.23
-0.12
0.96 0.84 o.32
0.57 0.47 o.44 0.44
&a
H. Fitriani and P. Lewis / Simple Linear Regression and Multiple Linear Regression 1449 Table 3. Summary of SLR models for all excavators
Equipment
Response
Equations
R2Excavator
I
FuelUse
Yt:9.9429 Xr+0.47M
0.982NO,
Y::0.3545X1+0.0242
0.948HC
Y:-
0.0054 Xr +0.0024
0.351co
Y4:0.0175 Xr +0.0066
0.543cou
Y5:
31.431 Xt+1.4'720
0.982Y6
-
3.8619 Xr+ 0.1076 0.881Excavator 2 Fuel Use
Nc}_.
a.963 0.850 0.390 0.219 0.963 0.888 HC
CO
-o:
PM
Yl :6.4485X1 + 0.5302 Y2:0.1202 Xi + 0.0209 Yr
-
0.0083 xr + 0.0031 Y4-0.0239Xr +0.0142 Y5 :20.358X1 + 1.6475Ye
:
l.846lXr +0.0354Excavator 3 Fuel Use
NO.
0.910 0.876 0.194 0.018 0.929 0.333
rlc
CO CO: PM
Y 1:3.9492 Xr + 0.l23l Y:
-
0.123 1 Xr + 0.0098 Yr :0.0084X1 + 0.0021 Yi:
0.005 1xr + 0.0055Y5: 12.468 Xr + 0.3748
Y6
-
t.0842 Xr - 0.0099XT:MAP
s.2 Mukiple linear regression madels
Based on the correlation matrix in Table 2, MAP and RPM are highly correlated to fuel
use and emissions rate for most of pollutants. Even though
IAT
has a lower correlationto fuel
use and emissions rate,IAT
wasstill
used as an input variablefor
theMLR
models because it may still have some predictive power.
Table
4
sunmarizesthe
modelsfor
fuel
use and emissions ratesfor all
threeexcavators. Overall, the
MLR
models yielded higherRf
values than the SLR modelsfor their respective response variables. The
MLR
R2 valuesfor
fuel use and emission rates forNO.,
HC, CO2 and PM indicate that the models performwell.
The model for CO, however, accounted for less than 50o/o of the variability in the data; thus, theMLR
models also indicate that emission rates of CO are more
difficult
to predict compared toFuel Use NO, HC CO CO: h,
1450 H. Fitriani and P [-e',vis / Simple Linear Regression and Multiple Linear Regression
Table 4. Summary of MLR models for all excavators
Excavator l Yr
:
-5.7.18 + 0.0728 Xr + 0.000301Xr - 0.0296X3Yr
:
-0.2093 * 0.00247Xr - 0.00002 X, + 0.000176XJY; = 0.0056 + 0.000034 Xt + 2.648-6 X? - 0.00021Xr Y4
:
-0.00003 + 0.000041 Xr + 0.00001 tX: - 0.00018x3 Y5:
-18.21 +0.230Xr+ 0.00093 xr - 0.093xrvit Y6 = -2.2I + 0.0291Xr - 0.0116X3
Use Yr : -5.07 + 0.0524 X1 t Q.QQQ$9 Xr- 0.0085 Xl
0.985 0.95.{ 0.582 0.80r 0.985 0,880 L9n Iixcavator
NO.
Y: = - 0.089 + 0.00082 xr {.000024 X:+0.000134Xr
0.8tt4HC
yr:
{.0024+ 0.000048xr +3.14E-6x, -0.00008xr
0.402co
Y4:
4.0004 + 0.000013 xr + 0.0000 t 9 xr- 0.00024xr
0.340co:
Yj:-16.05+0.166xr +0.00213x:-0.0262xr
0.917PM
Y6: -1.53 + 0.021X1- 0.00026X' -0.0064X3
0.913NO,
Y?: -0.079 + 0.00096Xr - 5.33E-6X: +0.000096X:
0.880HC
Yr:
-0.0071 +0.000034Xr +1.578-6X: +0.000094X3
0.250CO
Yr = 0.0094 - 0.00005Xr +9.92E-6X, -0.00018X:
0.096CO:
Ys = -7.409 +0.0932Xr + 0.00017X1 -0.022Xr
0.934PM
Yo = -1.i42 +0.0081Xr - 0.00013X:+0.0104X:
0.390Table 5. Comparison of validation results for SLR and MLR
Equiprcnt Pollutants ExcaYator 1 Fuel Use
xr
tr
NO, HC CO CO, PM 0.982 0.948 0.352 0.542 0.982 0.88 r0.045 0.005 0.002 0.005
0.1 43
0. t07
0.982 0.948 0.351 0.-{43 0.982 0.88 r
0.981 0.944 0.573 0.773 0.98 r
0.873 0.044 0.004 0.002 0.003 0.107 0.099 0.985 0.9s1 0.575 0.159 0.985 0.886 Excavator 2 Fuel Use
NO_ HC CO CO: 0,963 0.850 0392 0.220 0.963 0_074 0.007 0.003 0.015 a.B4 0.963 0.850 0.390 0.219 0.963 0.974 0.887 0.441 0.322 0.974 0.063 0.006 0.003 0.013 0.206 0.971 0.879 0.434 0.327 4.971 Excavator 3 Fuel Use
NO. HC CO CO: PM 0.930 0.875 0.193 0.018 0.930 0.333 0.120 0.007 0.004 0.008 0.38r 0.284 0.930 4.876 0.194 0.018 0.929 0.333 0.936 0.878 0.243 0.r05 0.933 0.384
0.1 13
0.007 0.004 0.007 0.354 0.252 0.935 0.878 0.239
0.1 00 0.934 0.387
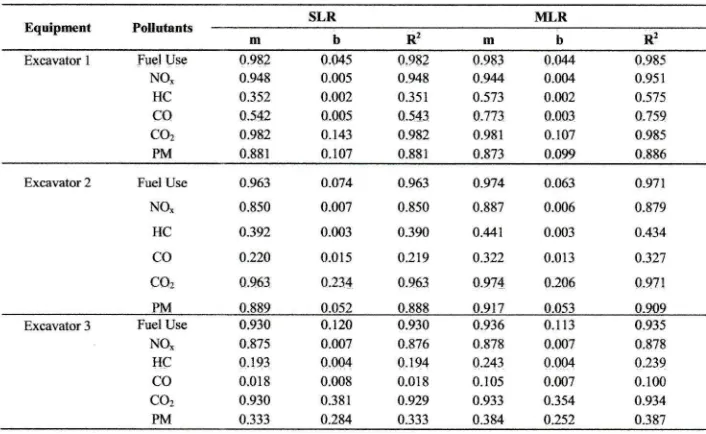
5.3 L[odel compdrisott
H. Fitriani and P. Lewis / Simple Linear Regression arul Multiple Linear
Regression
l4-51the
data.
For each trend line, the valuesof
accuracy (m), bias (b), and precision (R2)were determined. As shown
in
Table 5,MLR
produces higher R2 values compared to SLR for fuel use and all emissions rates. SLR has the lowest R2 value for fuel use and emissions rates. Overall,MLR
outperformed SLRwith
respect to precision, accuracy. and bias.In
most cases, theMLR
approach produced highly precise models for NO*, C02, and PM; while the modeisfor
HC and CO wereiikely
to be moderateiy precisewith R2 vaiues ranging from 0.50
-
0.87.5.4 Yariable impact analysis
Using the
MLR
models,a
variable impact analysis was conductedto
determine thepercentage
of
contributionof
the input
variables (1\{AP,RPM, and
IAT) to
theprediction
of
fuel
use and emission ratesof
each pollutant.Table
6
presents thesunmary
of
the variable impact analysisfor all
three excavators.MAP is
the mostsignificant variable for fuel use, CO, COz, and PM which are 63.96o/o, 53.1
l%,
10.48%and 59.509/o, respectively. RPM, however, has the most contribution for NO*.
IAT
had the highest impact for HC.Table 6. Variable impact analysis for average excavators Engine Data
MAP RPM IAT
Fuel Use
63.96%
2'7.210]0
8.83%
NO, 40.13% 43.20%
16.5'7%
HC 24.39% 25.91% 49.70%
CO 53.72%
3s.02%
11.26%
70_48%
s9.50%23.560/"
t9_6'70/.5.96%
20.83%6. Conclusions and recommendations
The
purposeof
this
paperwas
to
demonstratetwo
different predictive
modeling methodologies for estimating tuel use and emission rates of pollutants using real-world data. Basedon the
summaryof
Pearson correlation coefficients,MAP
hada
high positive correlationto fuel
use and emission ratesof NO,,
CO2, andPM,
but had amoderate positive relationship
with HC
and CO. Althoughnot
ashighly
correlated,RPM had a strong positive relationship with fuel use and emissions.
IAT
was shown tohave the least impact of the three engine performance variables on predicting fuel use
and emission
rates.
It
is
recommended that other engine performance data, such asengine load
or
throttle position,be
consideredfor
future studies. Fortwo
modelingapproaches, CO proved to be the most
difficult
pollutant emission rate to predict, as evidencedby
its low R2values.
Typically, there is high variabilityin
CO data which confounds the predictioneffort,
aswell
asthe fact that CO did not
havea
strongcorrelation
with
anyof
the engine data predictorvariables.
It
is
recommended thatstrong relationships between CO and other variables be considered. For example,
it
there exists a strong relationship between CO andfuel
use(which is
accurately andprecisely predicted
by
eachof
the three modeling approaches), then fuel use may be used as a predictor variable for CO.With
regardto
variable impact analysis,it
can be concluded thatMAP
has thehighest percentage
of
contributionin
the predictionof
fuel
use and emission rates,accounting for approximately 600/o of total impact, although for HC and CO
it
had the second highest impact. For these fwo pollutants, RPM had the highest impact but it was secondfor
fuel use,C0,
C02, andPM.
AlthoughIAT
had the lowest ranking impact1452
11. Fitriani and P. Lett:is / Simple Linear Regression and Multiple Linear Regressitttespecially
for
CO.
For strictly prediction purposes,it
is
recommended thatall
three engine performance variables be used to estimate fuel use and emissionrates.
Basedon the model comparisons,
MLR
models generally performed betterwith
respect toprecision, accuracy, and bias.
ln
most
cases,the
MLR
approach produced hrghly precise modelsfor NO,,
CO2, andPM; while the
modeisfor HC
and CO
weremoderately precise. These models are
stiil useful.
Thesimpiicity of
the one variable SLR models may be appealingto
some users, such asfleet
managers, that want toestimate the fuel use and emissions footprints of their equipment. Other users, such as
engine manufacturers, may
like
theMLR
approach becausethey would be
able toreasonably estimate each of the engine performance variables.
Overall, the results of this study help to quantify and characterize the air pollution problem from
HDD
equiprncnt usedin
construction. Althoughonly
excavators were addressed in this paper, the methodologies presented may certainly be used to developfuei
use and emissions modelsfor
othertlpes
of
equipment.
ln
orderto
furthercharacterize this emissions problem,
it
is recommended that other fypes of equipment, such as backhoes, bulldozers, motor graders, track loaders, wheei loaders, andoffroad
trucks, be targeted for future modeling efforts.
Acknowledgement
The authors acknowledge the use
of
the real-world non-road equipment and emission database that was developed at North Carolina State University by Dr.H.
Christopher Frey and Dr.William
Rasdorf.References
tll
Abolhasani, S., Frey, H. C.. Kim, K., Rasdorf, W., Lewis, P.,&
Pang, S.-H, Real-Worid In-Use Activity, F-uel Use, and Emissions for Nonroad Construction Vehicles: A Case Shrdy for Excavators. Journal of-the Air & llaste Management Associotion,Yol 58(8), pp. 1033 1046,2008.l2l
EPA, Users guide./br the.final NONROAD2005 model, EPA420-R-05-013, Ann Arbor, MI, 2005.t3l
Environmental hotection Agency CleanAir Act
Advisory Committee (EPA CAAAC),Recommendations for reducing emissions from the Legacy Diesel Fleet. U.S. Environmental Protection Agency, Washington D.C, 2006.
l4l
Fitriani. H, Development of Predictive Modeling Tools for Estimating Fuel Use and Emissions Rates lor Heavy-Duty Diesel Construction Equipment, Doctor oJ Philosophy, Oklahoma State University, Stillwater, OK 2014.[5]
Frey, H. C., Rasdorf, W., Kirn, K., Pang, S.-H., Lewis, P., & Abolhassani, S, Real-World Duty Cycles and Utilization for Consiruction Equipment in North Carolina, Dept. of Civil, Construction, andEnvironmental Engineering. No(h Carolina State University, Raleigh. NC, 2008.
t6l
Kim. K., Operational Evaluation of In-UseEmissions and F-uel Consumption of 820 Biodiesel versus Petroleum Diesel-Fueled Onroad Heavy-Duty Diesel Dump Trucks and Nonroad Construction Vehicles. Doctor of Philosaphy, Narth Carolina State Universitl;, Raleigh, NC, 2007.t1l
Lewis. P. Estimating Fuel Use and Emission Rates of Nonroad Diesel Construction Equipment Performing Representative Duty Cycles. Doctor of Philosophy, North Carolina State University, Raleigh, NC,2009.t8l
Rasdorl, W., Frey, C.. Lervis, P., Kim, K., Pang, S.-H., & Abolhassani, Field Procedures lor Real-World Measurements of Emissions Itom Diesel Construction Vehicles, Journal of Infrasmtcture