Abstract— This study is a continuation research of Sustainable Master plan Design in Residential Area Near the Airport which was previously conducted. In that study, it has been known that the angles of 135° and 180° towards the runway are the most effective angles which can reduce noise emitted from the airport. For reviewing the climate aspects, models are fitted in those angles, and then the observation of climatic aspects such as: temperature, humidity and wind speed should be conducted to review their influence to noise received by inhabitants. The research methods used were polynomial regressions of goniometric. And the results are correlation models of noise level to temperature, humidity and wind speed.
Keyword—Climate Assessment; housing master plan design; polynomial regressions of goniometric.
I. INTRODUCTION
HIS study concern with the climatic review of the housing master plan design close to the Airport.[1], [2] The background study is that many inhabitants are still annoyed by the airport noise, although there have been governments regulations about the building layout.[3], [4], [5], [6] Based on a rating of aspect orientation in the housing configuration of the previous studies [1], it can be concluded that the orientation of 135° and 180° towards the runway are the most effective orientation angle due to the shadowing noise, reflection and absorption. (See Fig. 1). Whereas the correlation models generated by polynomial regression analysis of goniometric in the previous study is as follows:
(
)
[
π α αc ω]
A L
L= 0+ sin − ... (1) [1] This study will examine the relationship between climate and the sound level in 2 blocks housing arrangement. The first is the orientation arrangement and the second is configuration as several houses in one block.
The noise level observation in each pattern will find out several graphs which represent the relationship between sound level and climate change in three aspects: temperature,
Manuscript received April 23, 2013. This work was supported in part by the Indonesian Government Grant 3299/UN7.3.3/PG.2011.
F. A. Erni Setyowati is with the University of Diponegoro, Faculty of Engineering, Chief of Building Technology Laboratory, Semarang 50275, Indonesia (corresponding phone: +62247473579; fax: +62247473579; e-mail: ernisyahdu@ gmail.com).
S. B. Hendro Trilistyo is with the University of Diponegoro, Faculty of Engineering, member of Building Technology Laboratory, Semarang 50275, Indonesia(e-mail: [email protected]).
humidity and wind speed. The research was conducted from 06.00 AM until 20.00 PM at a local time. It was done to determine the pattern of sound levels at different atmospheric conditions. Meanwhile, because of the location of housings are in the coastal area, so that is why the influence of the wind speed from and into the land will significantly determine the noise level received by inhabitants.
Fig. 1. Reflection and absorption at angles of 135ᵒ; 180ᵒ [1]
II. RESEARCHQUESTIONANDAIMS
A. Research Question
The correlation between the level of noise in models and the orientation angles has been known in previous studies. The method used in previous research was compare-means method which observed and compared the differences patterns of noise level between the rotated model and control model at certain angles. However, in this research, there is no rotation of models. This strategy is conducted because the orientation angles (α) of 135° and 180° have been established as the most effective angles to reduce noise. To make the observation much easier than researcher choose the angle of 180° towards the runway as an angle model. By this method, the researcher can easily observe correlation between the noisel level and climate change at the three aspects, temperature, humidity and wind speed. The research question in this study is how far the climate change will influence the patterns of received sound levels in housings.
Climate Assessment of Orientation Design in
the Housing Master Plan Close to the Airport
A.Erni Setyowati, B. Hendro Trilistyo
T
SOUND RADIATION WITHOUT REFLECTION
SOUND RADIATION TO THE SURFACE
B. OPENED-WINDOW CONDITION B. OPENED-WINDOW CONDITION
SOUND PROPAGATION
SOUND REFLECTION
SOUND RADIATION
HOUSING BLOCK REFLECTION IN FRONT OF MODEL
SOUND PROPAGATION
SOUND RADIATION
HOUSING BLOCK REFLECTION IN FRONT OF MODEL SOUND RADIATION
WITHOUT REFLECTION
B. Research’s Aims
Research's Aim in the study is to determine correlation model between noise level and aspects of the climate consisting temperature, humidity and wind speed.
III. RESEARCHMETHODS
In contrast to previous studies, there are no rotation models in this research. The models of housing are constantly put in place to position angle of 180° towards the airport runway.
As known that the buildings in tropical-humid requires natural ventilation, so that it can be created comfort and health atmosphere. Based on this point of view, the measurement of the sound level in the model is conducted in several conditions consisting:
(a)The model of housing.
(b)Measurements outside the building (Sound Level Meter at front of the door).
(c)Measurements inside the model (Sound Level Meter inside the model).
(d)Measurement at the open window conditions (Sound Level Meter inside the model)
(b)
(a) (c) (d)
Fig. 2. Placement of the Sound Level Meter in the model
Similar to the previous studies, this study uses a formula of sound level equivalent as follows: [7], [8], [9], [10]
i
L i
eq n
N
L 0,1
10 10
1 log
10
∑
= (dBA) (2)
i
L i
eq t
T
L 10 100,1
1 log
10
∑
= (dBA) (3)
with:
ni : the number of events with level Li
N : Total number of events
Ti : duration of sound level Li
T : total time span/duration
This formula is used to obtain the value of the average sound level within a certain time. The aircraft crossed the measurement location within a very limited time, therefore researchers used measurements span of 2 minutes per 3 seconds. This measurement method has more accurate result than the curve of measurement which has a span of 2 minutes per 5 seconds. See the picture below:
Fig. 3. Two minutes per 5 seconds duration of noise level measurements graph.
-20 0 20 40 60 80 100 120140 160 180200 30
40 50 60 70 80 90
B
A
Fig. 4. Two minutes per 5 seconds duration of noise level measurements graph.
Sound level results obtained by this method will be recorded along with the results of measurements consisting temperature, humidity and wind speed. The correlation model between the noise level with temperature as example, will be compared with the findings of a correlation between the level of sound with the orientation angle (α) of previous research. The Model between noise level and temperature will be analyzed by polynomial regression analysis goniometric through the processing data by software Origin-8.
The polynomial regression of goniometric analysis using Origin-8 has been popularly used in many researchs.77 In this research, the Origin-8 was used to obtain a mathematical model of the correlation between the noise level with temperature, humidity and wind speed as review of the conditions in the tropical climate.
Here are the positions of the models at the research’s location:
Fig. 5. The Configuration Model Fig. 6. The Orientation Model
IV. CORRELATIONBETWEENHOT-HUMIDTROPICAL CLIMATEANDNOISELEVEL
In the humid tropics, there are specific weather conditions and those are quite different compared to the conditions in the dry-tropics.11 In dry tropical climates, the daily temperature difference can be very volatile. But in tropical areas, it is moisture; daily temperatures have a mean difference of up to 8
°C, whereas the annual temperature difference is very low. At high humidity condition, the temperature is always nearly the same throughout the year.12
The tropical climate aspects influencing to building design consist of: air temperature, air humidity, wind direction, wind speed, solar radiation, sunlight and sky factor. During the observation of this study, several parameter: sunlight factors, solar radiation, as well as the sky factors are not discussed in detail, because these three factors are influenced by aspects of building orientation towards the sun path throughout the year.
TIME (SECOND) TIME (SECOND)
LE
Q (dB
)
LE
Q (dB
The terminology of orientation is limited in terms of aspect of orientation towards the building position to the airport runway.
To be able to observe the relationship between climate and noise levels more accurately, several step of studies are conducted with a fixed orientation angle of model position of 180°. Thus, there are no rotations of models.
V. RESEARCHMEASUREMENTDATA
This study will find out correlation model between climate and noise levels based on the results of a mathematical model that has been known in previous research (see Equation 1). Because the analysis of the preliminary study conducted within two (2) aspects: orientation (single building) and configuration aspects (block of housing), then study the correlation model between climate and even this level of noise measurements carried out in two stages consisting both the measurement of orientation aspect and configuration aspect.
A. The Orientation Aspects (O)
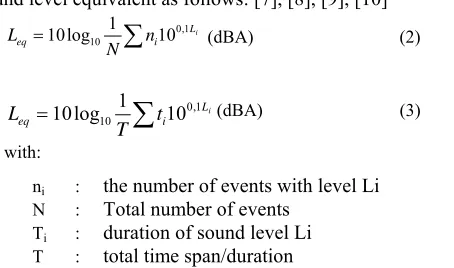
Measurements were taken at the time of aircrafts take-off (01) and landing (02). Whereas the model made in three measurement conditions consisting: outside the model (OS), inside the model (OI), and the condition of the open window inside the model (OW). The measurement results are as follows:
TABEL 01: CORRELATION OF CLIMATE AND NOISE LEVEL IN THE ORIENTATION ASPECT
The Correlation between Leq and temperature, the average
correlation value recorded was 0.53. [13] The highest correlation value was achieved by the measurement inside model (aircraft landed) which was equal to 0.72. This condition happened because the temperature rose due to the evaporation of sea water during the day that significantly moved to the land.
The correlation between Leq and humidity (RH), had an
average correlation value of 0.58. [13] The highest correlation value is 0.75 occurred during the aircraft landed and the model was opened-window. The humidity conditions are high enough density of airborne particles cause increases and causes the wind to move toward the building.
The correlation between Leq and wind speed has the
average value 0.54. [13] The highest value was 0.60 when the measurement condition inside the model, because the sea breeze moved into the land which brought the hot air particle density due to the evaporation of sea water during the day.
The correlation between sound level and wind direction, when the plane landed, the correlation value is 0.675 or 67.5%. [13] Sound level will increase if the wind moving towards to the south-east, or the sea breeze moved into the land.
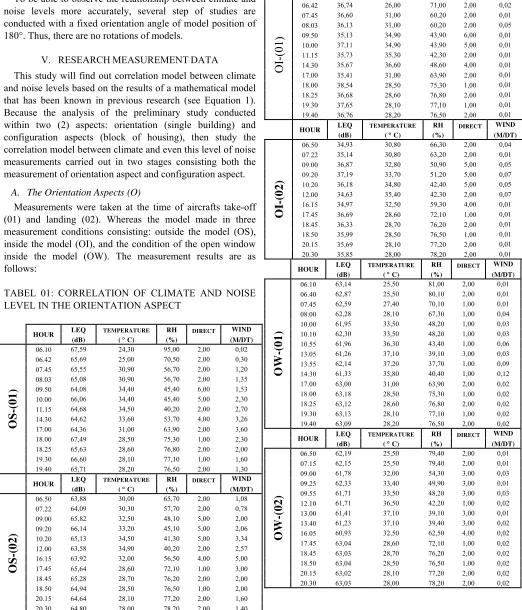
B. The Configuration Aspects (C)
The configuration represents several housing in one block. In this condition, the reflection factor is very significant to increase the noise level. Measurements were taken outside the building (CO), inside the building (CI) and when the window opens (CW). Here are the measurements:
TABEL 02: CORRELATION OF CLIMATE AND NOISE LEVEL IN THE CONFIGURATION ASPECT
The correlation between Leq and temperature.
The correlation value of the sound level with the average temperature recorded at 0.45 or 45%. [13] The highest value of the correlation coefficient occurs when the condition of opened-window. This is caused by the density of the air due to the high humidity resulted in significant increase in temperature around the building. The more noise level, the more wind speed to the land (west direction).
The correlation between Leq and humidity (RH).
The value of the average correlation between noise and humidity level is 48%. [13] The highest correlation value occurs in the condition of opened-window, because the humidity level was quite high, so the sound was moving toward housing significantly. The configuration structure factor reflected the strong noise waves toward the housing.
The correlation between Leq and wind speed. The value of the average correlation with the speed of sound level was recorded at 0.48%. [13] Whereas the highest value of the correlation coefficient of 0.61 occurred at the time of measurement inside the model. The effect of wind speed was not too high because the wind speed measurement period tends to quite slow.
The correlation between Leq and wind direction.
The analysis used in discussing the relationship between Leq and the wind direction was bivariate-Spearman correlation analysis because it is non-parametric term.[14]
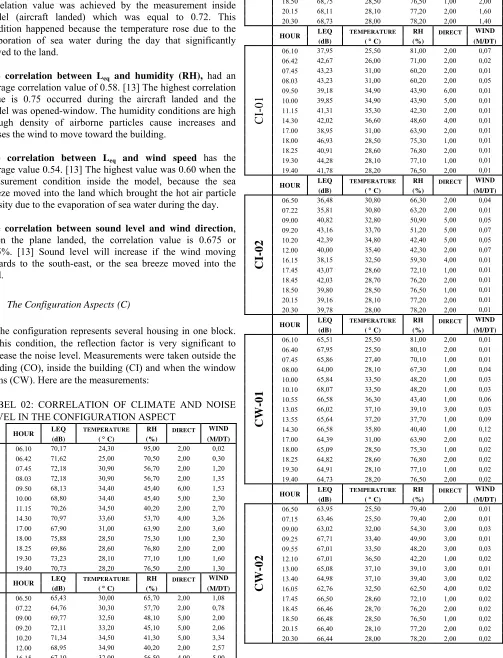
TABEL 03: CORRELATION DURING THE TAKE OFF PERIODS
During the aircraft took-off, the correlation coefficient was negative, it meat: "The noise level would be even greater if the winds tent to move towards the north-west. Therefore it could be said that the sound level would be greater if the wind was blowing towards the sea shore.
VI. THEPOLYNOMIALREGRESSIONANALYSISOF
HOT-HUMIDTROPICALCLIMATEANDNOISELEVEL Similar to the measured data part of research, the analysis of the relationship between climate and the sound level will be discussed in two (2) aspects consisting the orientation and configuration aspects.
A. The Orientation Aspects (O)
The value of the correlation between the humid tropical climate and noise level on the orientation aspect was range in the 0.53 to 0.69.[15], [16] This value was quite significant, but
quite different to the absolute correlation coefficient of 1. The curves of correlation model are: Non Linear Curve Sinus. [17], [18] For example, the bivariate correlation was non-linear curve Sinus below (only displayed on the extreme values only).
Fig. 7. The Temperature Correlation chart with sound level measured outside the model during the aircraft landed. [17], [18] The correlation shows the bivariate patterns showed non-linear sine curve with the temperature conditions are not at extreme conditions from 34.5 - 34.9° C. The sinusoidal pattern represents that there were virtually no obstacle to the propagation of sound waves to the housing except vegetation.
40 60 80
Fig. 8. The correlation chart between noise level and humidity measured inside the building (OI) during the aircraft landed. [17], [18] The bivariate relationship patterns showed non-linear sine curve with extreme conditions sound levels at 80% humidity. In the fittings Curve Analysis, it was found that the correlation value is 37% or 0.37.
30 40 50 60
Fig. 9. The Correlation between noise level and temperature chart measured in the open window conditions of model (OW) during the aircraft landed. [17], [18] The Bivariate correlationship patterns showed non-linear sine curve with extreme conditions sound levels at 37 °.
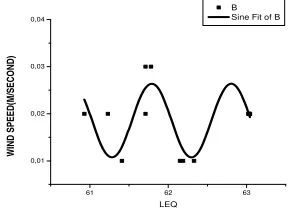
Fig. 10. The correlation between wind Speed and noise level chart measured in open window conditions of model (OW) during the aircraft landed. The bivariate correlation patterns showed non-linear sine curve with extreme conditions sound level at a speed of 0.01 m / sec. [17], [18] In the sine curve fitting was found that the correlation coefficient R2 is equal to 59%, it is
enough to prove that the effect of wind speed on the level of noise is very significant.
In the observation of correlation between the direction of the wind and noise level, this research had found out that there were two important things:[19], [20]
1. During the time of the aircraft take-off, the noise level is influenced by the wind direction of about 69.5%. The noise level increase if the wind blows into the sea, or wind moves towards the south-east, the opposite direction to the rate of aircraft.
2. During the aircraft landing, the noise level is influenced by the wind direction of about 67.5%. The noise level will increase if the wind moves towards the south-east, or the sea breeze moves into the land, or the direction of the landing airplane rate.
B. The Configuration Aspect (C)
The value of the correlation between the humid tropical climate and the noise level on the orientation aspect range at about 0.34 to 0.48. This figure is quite significant, but still quite far from the absolute correlation coefficient of 1. The Sinusoidal correlation pattern, on the configuration aspect, reduced if it compare with those pattern on the aspect of orientation. [17], [18] This is caused by the behavior of both reflection and diffraction of high-frequency noise and low frequency during the flight operations. For example, the bivariate correlation polynomial sinus curve patterns below:
24 30 36
Fig. 11. The polynomial sinus Graphs between the noise level and temperature in the condition of opened-window (CWJ) during the airplane taking off. [17], [18] Bivariate correlation patterns showed non-linear sine curve with temperature conditions which has R2 correlation value of 54.2%. The graph represents that there is the significant effect of temperature on the level of sound.
Fig. 12. The correlation graph between the temperature and the noise level in the opened-window condition (CW) during the airplane landing. [17], [18] Bivariate correlation patterns showed non-linear sine curve with temperature conditions which has R2 correlation association of 57.8%. The graph represent
that there is significant effect of temperature on the level of sound.
40 60 80 100
Fig. 13. The Correlation chart between the noise level and humidity (RH) in the measurement outside the model (CO) during the airplane taking off. [17], [18] The bivariate correlationship patterns showed non-linear sine curve which has R2 value of 41%. This figure is the largest among the results of
another analysis so that it can be concluded that when compared with the effect of temperature on the level of noise, the effect of moisture on the sound level is not very significant.
69 72 75
Fig. 14. The correlation chart between wind velocity and the noise level, in general has a number of correlation R2 of 14%. [17], [18] This figure is the
largest among the results of another analysis so that it can be concluded that the effect of wind speed on the sound level is not very significant.
In the observation of correlation between the direction of the wind and noise level, this research had found out that there were two important things: [19], [20]
1. At the time of take-off: "The sound level will be even greater if the winds tend to move towards the north-west. The west and north is the direction in which the sea is. Therefore it can be said that the sound level would be greater if the wind is blowing towards the sea shore, or the direction of the takeoff rate "
2. At the time of landing: "The level of noise will increase if the wind tends to blow towards the south-east. The south-east is the direction toward the ground. So it can be said that the operational plane landed, the sound level will increase if the sea breeze blows. The wind is blowing in the same direction at a rate of aircraft "
VII. CONCLUSION
From the results of measurement above, we find out that the differences in the configuration of the building mass patterns will greatly affect the level of sound received. Whereas, the climatic factors have a different effect if we compare to the results of analysis of orientation and configuration aspects of the building or model. On the aspect of orientation, the climatic factors such as temperature, humidity and wind speed have significant influence. However, on the configuration aspect, the correlation results obtained between climate and noise level showed the less significant value. This is caused by the configuration of the pattern which is very dominant in influencing the level of sound received. [21], [22] Aspects of reflection and absorption on the order of configuration causes the climate is not very significant influence on the value of the noise level.
ACKNOWLEDGMENT
The authors would like to thank the creating of the models by the contractors with the materials of Glass Reinforced Cements (Gresik cements plastered board) and glass wool sound-proof inside the models. The opinion and analysis presented in this paper are those of the authors.
REFERENCES
[1] E. Setyowati, 2013, Sustainable Master Plan Design in Residential Area Near the Airport, presented and published in International Conference Proceeding on the 1st Architecture and Civil Engineering 2013, Fort Canning Hotel, Clark Quay, 18th-19th March 2013, Singapore, GSTF (Global Science and Technology Forum) ISSN: 2301-394X.
[2] E. Setyowati, S. Soetomo, W. Setia Budi, Wahyu; E. Prianto, Housing Orientation and Transportation Noise in Residential Area Near The Airport, Dinamika Journal, Civil Engineering,University of Muhammadiyah Surakarta, Indonesia, Vol.10, No:3- September 2010, National Accredited Journal BAN DIKTI: 110/DIKTI/Kep/2009 (2010). [3] Government of Central Java Province, Dinas Pemukiman dan Tata
Ruang: Final Report “Penyusunan Rencana Tata Bangunan dan Lingkungan (RTBL) Kawasan Bandara Ahmad Yani Semarang, PT. Duta Citra Design Consultant, Semarang, Indonesia (2005).
[4] Regulation of Transportation Ministry No: KM.11 - 2010 about: Tatanan Kebandarudaraan Nasional
[5] Regulation of Public Work Ministry No 06/PRT/M/2007 datel 26 Maret 2007 about Pedoman Umum Rencana Tata Bangunan dan Lingkungan [6] Regulation of, Environment Minstry, Kep.Men. No.
48/MENLH/11/1996 about: Baku Tingkat Kebisingan Lingkungan [7] C.M. Harris, Handbook of Noise Control, Second Edition, Mc Graw –
Hill Book Company, New York, St. Louis, San Fransisco (1979). [8] K. Attenborough, K.M. Li, K. Horshenkov, Predicting Outdoor Sound,
Taylor & Francis, London, New York, ISBN: 0-203-08873-5 (2007). [9] M. Harrison, Vehicle Refinement – Controlling Noise and Vibration in
Road Vehicles, SAE International, Warrendale, USA, ISBN 0 7680 1505 7 (2004).
[10] S.V. Szokolay, Environmental Science Handbook for Architects and Builders, The Construction Press, Lancaster London New York (1980). [11] G. Lipsmear, Bangunan Tropis (Tropical Building), Translate Edition,
Erlangga Publishing, Jakarta (1994).
[12] Soegijanto, 1999: Bangunan di Indonesia dengan Iklim Tropis Lembab Ditinjau dari Aspek Fisika Bangunan (Building in Indonesia with the Hot-humid tropical Climate on the Building Physics point of view). Directorat General of Education and Culture Ministry of Indonesian Republic.
[13] K. Soetaert dan P.M.J. Herman, A Practical Guide to Ecological Modelling-Using R as Simulation Platform, Netherland Institute of
Ecology, Yerseke, The Netherland, Springer, Netherland, ISBN: 978-1-4020-8624-3 (2009)
[14] G. Casella, Statistical Design, Springer, New York, USA, ISBN: 978-0387-759654 (2008)
[15] H. Sanoff, Visual Research Methods in Design, Van Nostrand Reinhold, ISBN 0-4442-23827-4, New York (1991).
[16] C.M. Macal, Model Verification and Validation, workshop on : "Threat Anticipation: Social Science Methods and Models", The University of Chicago and Argonne National Laboratory, April 7-9 (2005).
[17] http://www.originLab.com, access on 9th October 2010.
[18] V. Dale,J. P. Edwin, R.E. Steven, Calculus, Erlangga Publishin, Jakarta (2007).
[19] J. Newman dan C.R. Benz, Qualitative – Quantitative Research Methodology : Exploring the Interactive Continuum, ISBN 0-8093-2150-5, Southern Illinois University Press, USA (1998).
[20] J.C. Snyder, Architectural Research – Environmental Design Series, Volume 6, ISBN 0-442-28211-7, Van Nostrand Reinhold, Melbourne , Australia (1984).
[21] C.C. Heng (1995), Sound Propagation in Housing Estates from a Passing Vehicle, J. Applied Acoustics, vol. 48, Issue 2, 175-183. [22] L. Xiaotu, Analysis of The Acoustical Environment of Urban Dwellings,
J. Applied Acoustics, vol. 65, Issue 4, halaman 557-581 (2003).
Erni Setyowati has become a Member of GSTF (Global Science and Technology Forum), Singapore since March 2013. She finished her study of Architectural undergraduate degree at University of Diponegoro, Semarang in 1990. Then in the same University, she finished her study for master’s degree in 2000 and doctoral degree in 2011. The major field of study which she concerns is Building Science and Technology.
She works at the Architecture Department, Engineering Faculty, University of Diponegoro in Prof. Sudharto Street, Tembalan Region, Semarang, Central Java Province, Indonesia. She is a lecturer and has become a Chief of Building Technology Laboratory since 2011. The previous publications which she has written consists of “ Sustainable Master Plan Design in Residential Area Near the Airport”, presented and published in International Conference Proceeding on the 1st ACE 2013, Singapore and “Housing Orientation and Transportation Noise in Residential Area Near the Airport, published in National Journal of Dinamika, Civil Engineering, University of Muhammadiyah Surakarta, Vol.10, No:3-September 2010, a National Journal Accredited by High Education Directorat General, BAN DIKTI: 110/DIKTI/Kep/2009. She also wrote the educational book in March 2013: “Thermal and Acoustics”, UNDIP Press Publisher. She has conducted research on Nano-material recently.