Factors affecting corn bunting Miliaria calandra abundance in a
Portuguese agricultural landscape
C. Stoate
a,∗, R. Borralho
b, M. Araújo
b,1aThe Game Conservancy Trust, Fordingbridge, Hampshire SP6 1EF, UK bERENA, Av. Visconde Valmor 11-3◦
, 1000 Lisbon, Portugal
Received 14 December 1998; received in revised form 18 June 1999; accepted 1 July 1999
Abstract
Breeding and wintering abundance of corn buntings in an agricultural landscape of Alentejo (southern Portugal) was assessed in relation to agricultural intensification and other environmental variables during 1994–1997, using distance sampling and multivariate regression. Bird abundance was lowest in intensively managed farmland in both seasons, and was related positively to fallow area in winter and to the presence of game management and oats in spring. Fallows and oats were associated with extensively managed farmland, but the implementation of a managed hunting regime was unrelated to agricultural intensification. The importance of extensive arable systems to corn bunting conservation is discussed. ©2000 Elsevier Science B.V. All rights reserved.
Keywords: Agricultural intensification; Breeding abundance; Fallow; Montado; Winter abundance; Portugal
1. Introduction
Corn buntings Miliaria calandra are associated, throughout their distribution range, with arable land-scapes. Their numbers have declined in northern Europe since the 1960s as a result of agricultural in-tensification (Tucker and Heath, 1994). This decline is attributed to increased winter mortality, caused by reduced abundance of winter food (Donald and Evans, 1994), and to poor breeding performance caused by increased use of agro-chemicals (Aebischer and Ward, 1997; Brickle and Harper, in press).
In-∗Corresponding author.
E-mail address: [email protected] (C. Stoate).
1Present address: Biogeography and Conservation Laboratory, The Natural History Museum, Cromwell Road SW7 5BD London, UK. Tel.:+44-1425-652381; fax:+44-1425-651026.
creased use of herbicides throughout northern Europe has resulted in the loss of many arable weeds, and hence of phytophagous invertebrates, which provided an essential source of food for many farmland birds, as Potts (1986) demonstrated convincingly for grey partridge Perdix perdix.
Corn bunting breeding densities are currently highest in Turkey, Spain and Portugal (Diaz and Telleria, 1997), where their numbers appear to be stable. Although cereal production has intensified in parts of these countries, there still are large ar-eas of extensively managed farmland (Bignal and McCracken, 1996). In Portugal, Alentejo is the main cereal growing region, and extensive systems are still widely adopted there. Corn bunting has a widespread distribution in this region, and is de-scribed as abundant (Rufino, 1989; Elias et al., 1999).
In these extensive arable systems, grazed fallow pro-vides a source of food in the form of seeds in winter and invertebrates in summer. Cereal crops also sup-port an invertebrate community with relatively large insects, such as caterpillars (Lepidoptera larvae) and grasshoppers (Orthoptera), taken by corn buntings dur-ing the breeddur-ing season in the north of their range (Brickle and Harper, in press). This study assesses the abundance of corn buntings in December and April in relation to three arable systems and other environ-mental variables in an agricultural landscape of Baixo Alentejo, southern Portugal, considering, in particu-lar, various levels of agricultural intensification, and the potential effects of fallow area and private game interests.
2. Methods
2.1. Study area
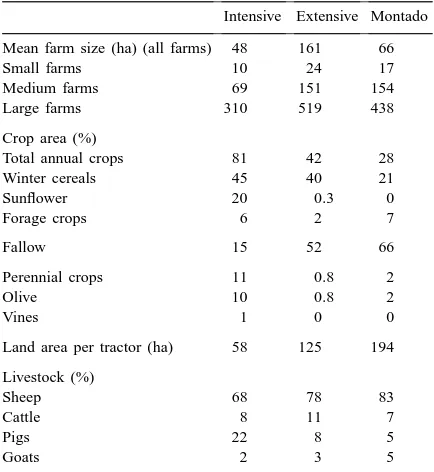
The study area included parts or all of five ad-ministrative regions in Baixo Alentejo (Ferreira do Alentejo, Aljustrel, Castro Verde, Ourique and Almodôvar), with a total area of 155,000 ha. Within this region, three land-use systems were recog-nised: intensive agriculture, extensive agriculture and ‘montado’ (Table 1).
The intensive agriculture category is characterised by a greater frequency (>55%) of heavy soils, much of the area being irrigated. Wheat Triticum aestivum and barley Hordeum distichum are the main cereal crops, and silage grass Lolium sp., sunflower
He-lianthus annuus, sugar beet Beta vulgaris and oilseed
rape Brassica napus are also grown. Wheat yields are 2.5–3.5 tonnes ha−1 without irrigation, but can be almost doubled with full irrigation (P. Eden, pers. comm., 1998). There are short rotations with little or no fallow (e.g., sunflower-1st cereal-2nd cereal). This system requires frequent use of fertiliser (130 units of N2per hectare (P. Eden, pers. comm., 1998)) and her-bicides relative to the other land-use categories. With the exception of some olive Olea europea groves, there is little tree cover.
The extensive agriculture category is characterised by thin soils and the largest average farm size of the three categories (Table 1). There is no
irriga-Table 1
Agricultural statistics for the three land-use categories considered in Alentejo, Portugal (source: Cordovil, 1993).
Intensive Extensive Montado
Mean farm size (ha) (all farms) 48 161 66
Small farms 10 24 17
Medium farms 69 151 154
Large farms 310 519 438
Crop area (%)
Total annual crops 81 42 28
Winter cereals 45 40 21
Sunflower 20 0.3 0
Land area per tractor (ha) 58 125 194
Livestock (%)
Sheep 68 78 83
Cattle 8 11 7
Pigs 22 8 5
Goats 2 3 5
tion, and fallow area is relatively high. A typical rotation takes the form: plough fallow-1st cereal-2nd cereal-fallow-fallow, with fallow periods often last-ing five years or more (Rio Carvalho et al., 1995). Wheat yields are 1.5–2.5 tonnes ha−1, with yields at the lower end of this range being more common (P. Eden, pers. comm., 1998). Triticale Triticum aestivum
×Secale cereale and oats Avena sativa are frequently
grown in the extensive category, and grazed or cut for silage. The incorporation of a fallow period into the rotation, and the relatively low potential yields are associated with considerably lower annual inputs than in the intensive category.
‘Montado’ (equivalent to the Spanish ‘dehesa’) is characterised by thin soils and tree cover, dominated by holm oak Quercus rotundifolia and cork oak Q.
suber. Like the extensive category, there is no
irriga-tion and the fallow area is high. A typical rotairriga-tion is similar to that of the extensive category, although the fallow stage is often longer and forage lupins Lupinus
luteus may be included.
Sheep Ovis aries, cattle Bos taurus and pigs Sus
scrofa are kept in all three land-use categories. Zero
cat-egory, but livestock normally graze fallows. Table 1 lists the proportion of crops and livestock in each cat-egory. Public hunting of wild game is open to all li-censed hunters over much of the area, with no control on the game bags taken and without any management. However, some areas are managed as private or asso-ciative game estates, implying a control on game bags and some management measures.
2.2. Field methods
A total of 115–250 m transects, starting in 1 km grid intersections and stratified by land-use categories, were walked along a random bearing. Transects were walked in the first three hours after dawn, or in the two hours before dusk, in December and April, from De-cember 1994 to April 1997. Perpendicular distances from the transect line to each detected bird were es-timated visually to the nearest 10 m. The number of birds seen together at an observation was recorded.
Tree density estimates were based on counts within a belt 25 m each side of the transect line. After each spring count, the crop type and vegetation structure was sampled over the first 50 m of each transect, by plotting vegetation height on millimetric paper, and proportional cover was determined for each of seven height classes (Table 2). A Shannon diversity index of these cover classes was computed for each transect. Table 2 gives sources of other environmental variables. In April 1997, broad-leaved weed cover within cereal crops in extensive and intensive categories was esti-mated within a 4 m2 quadrat at 50 m intervals along each transect. Lepidoptera larvae and Orthoptera were sampled using one sample of ten sweeps (of approxi-mately 3 m amplitude) along the start of each transect, using a 50 cm diameter net.
2.3. Analytical methods
2.3.1. Density estimates
Density estimates were calculated for each land-use category using line transect sampling and the com-puter program DISTANCE (Buckland et al., 1993; Laake et al., 1993). For the data gathered in Decem-ber, when birds were in flocks, flock size (mean 4.2, range 1–40) was accommodated within the analysis, and a hazard rate model with cosine adjustments was
selected by the program. In April, flocks were not present and individuals or pairs seen together were recorded as single units. A half-normal model with cosine adjustments was selected by the program and applied to the April data. Analyses used (i) clusters (≥1 individual) as analytical units, (ii) ungrouped data, and (iii) untruncated perpendicular distance data. A variety of recommended robust estimators im-plemented by DISTANCE was used, the final model selected in each case being the one with the lowest Akaike’s Information Criterion value (Buckland et al., 1993). Differences in log-transformed density estimates (weighed by 1/variance) between years and land-use categories were tested using one-way ANOVA.
2.3.2. Environmental models
In order to evaluate the main environmental factors affecting corn bunting abundance in the study area, two models (winter and spring) of corn bunting rela-tive abundance were computed using multivariate re-gression and the number of buntings detected in each transect as the dependent variable. As this could have been affected by differential habitat visibility between land-use categories, it was checked before analysis whether there was a significant correlation between the visibility-corrected line transect density estimates and the mean number of buntings detected in each survey/farming system, using: (i) all cases (n=18), and (ii) only significantly different line transect es-timates (n=6). These correlations were highly sig-nificant (rs=0.92, p<0.001, in the first case; rs=1,
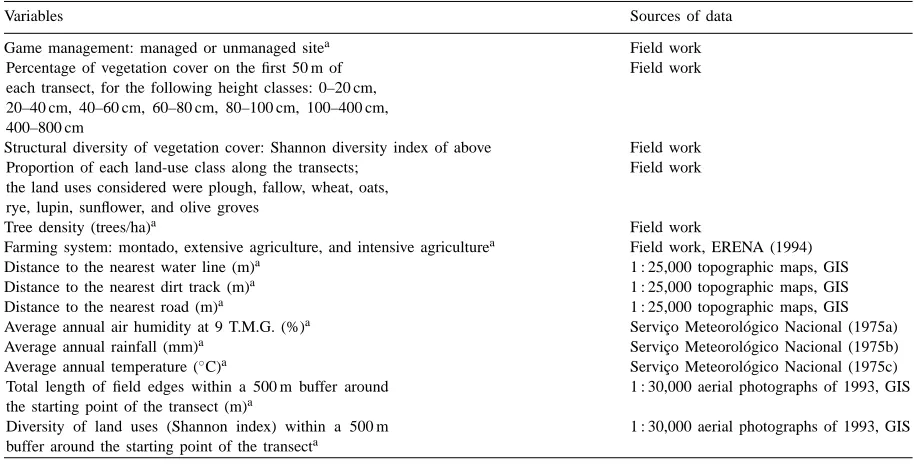
p=0, in the second), indicating that the number of buntings detected per transect and the line transect es-timates had similar value as indices of relative abun-dance. Before analysis, the dependent variable was logarithmically transformed [A=log(x+1)] to nor-malise the distribution of residuals and equalise the variances (Zar, 1984). Tables 2–4 list the independent variables considered and the sources of data. The data were incorporated and manipulated in a vector-based Geographic Information System (GIS-ArcCAD).
Table 2
Independent variables considered in the environmental models of corn bunting relative abundance
Variables Sources of data
Game management: managed or unmanaged sitea Field work Percentage of vegetation cover on the first 50 m of
each transect, for the following height classes: 0–20 cm, 20–40 cm, 40–60 cm, 60–80 cm, 80–100 cm, 100–400 cm, 400–800 cm
Field work
Structural diversity of vegetation cover: Shannon diversity index of above Field work Proportion of each land-use class along the transects;
the land uses considered were plough, fallow, wheat, oats, rye, lupin, sunflower, and olive groves
Field work
Tree density (trees/ha)a Field work
Farming system: montado, extensive agriculture, and intensive agriculturea Field work, ERENA (1994) Distance to the nearest water line (m)a 1 : 25,000 topographic maps, GIS Distance to the nearest dirt track (m)a 1 : 25,000 topographic maps, GIS Distance to the nearest road (m)a 1 : 25,000 topographic maps, GIS Average annual air humidity at 9 T.M.G. (%)a Serviço Meteorol´ogico Nacional (1975a) Average annual rainfall (mm)a Serviço Meteorol´ogico Nacional (1975b) Average annual temperature (◦C)a Serviço Meteorol´ogico Nacional (1975c)
Total length of field edges within a 500 m buffer around the starting point of the transect (m)a
1 : 30,000 aerial photographs of 1993, GIS
Diversity of land uses (Shannon index) within a 500 m buffer around the starting point of the transecta
1 : 30,000 aerial photographs of 1993, GIS
aVariables with constant values within sites between years.
Table 3
Means±standard errors of the independent variables constant in each 250 m transect between years
Variables Montado Extensive agriculture Intensive agriculture
(n=42) (n=42) (n=31)
Game managed sites (%) 33.3 29.3 34.5
Tree density (trees/ha) 10.54±0.70 0.36±0.32 0.39±0.15
Distance to water line (m) 88.48±10.27 81.63±9.80 102.21±16.12
Distance to dirt track (m) 144.34±17.19 161.50±20.42 133.62±22.24
Distance to road (m) 701.62±88.98 870.02±90.37 612.67±86.38
Average air humidity (%) 76.79±0.37 75.90±0.31 79.12±0.26
Average rainfall (mm) 60.95±0.46 59.74±0.26 63.55±0.87
Average temperature (◦C) 16.14
±0.08 16.67±0.15 16.04±0.05 Length of field edges within a 500 m buffer (m) 3455.74±136.54 1344.61±155.48 1303.70±185.70 Diversity of land uses within a 500 m buffer (Shannon index) 0.39±0.02 0.20±0.02 0.18±0.03
Table 4
Means±standard errors of the independent variables not constant in each 250 m transect between years
Variables Montado Extensive agriculture Intensive agriculture
Winter Spring Winter Spring Winter Spring
Cover diversity (Shannon index) – 0.67±0.04 – 0.40±0.04 – 0.33±0.05 Proportion plough 0.04±0.02 0.03±0.02 0.04±0.02 0.03±0.01 0.49±0.05 0.25±0.05 Proportion fallow 0.76±0.04 0.80±0.03 0.70±0.04 0.71±0.04 0.05±0.02 0.06±0.02 Proportion cereal 0.22±0.04 0.19±0.03 0.27±0.04 0.28±0.04 0.39±0.04 0.68±0.05
Proportion lupin – 0.01±0.01 – – – –
Proportion sunflower – – – – – 0.04±0.02
considered exclusively. Variables entering the mod-els (winter and spring) were selected through forward stepwise selection. In the second stage, 114 transects and two-year dummy variables were considered to account for between-site and between-year variation, and the remaining independent variables that changed between years within each transect. The dummy vari-ables were entered at step 0, and the stepwise selection proceeded from there. Once the final models of this stage were determined, the dummy variables were re-placed by the variables selected in stage 1, and ‘nested’ models with all the non-dummy variables selected in the two stages were fitted. Finally, it was checked whether the nested models successfully explained the between-transect and between-year variation by com-paring the models with the dummy variables (model 1) with the nested models (model 2), using an F test, calculated as: (model 1 sum of squares−model 2 sum of squares)/(model 1 df−model 2 df)/(model 1 resid-ual sum of squares)/(model 1 residresid-ual df), the degrees of freedom being equal to (model 1 df−model 2 df), (model 1 residual df).
A correlation matrix of the selected variables was generated for the final winter and spring models. Additionally, significant differences between land-use categories for the variables selected were determined using one-way ANOVAs for the independent contin-uous variables and chi-square tests for the categorical ones.
3. Results
3.1. Density estimates
In winter, corn bunting density was lowest in inten-sive, and highest in extensive categories in all three years (Table 5), but the differences were not signif-icant among land-use categories (F2,6=2.89, ns), or among years (F2,6=1.83, ns).
In the breeding season, lowest densities occurred again in intensively managed farmland. Montado supported higher breeding densities than extensive farmland in two years. Differences among land-use categories were significant (F2,6= 11.89, p<0.01), whereas those among years were not (F2,6= 0.16, ns).
3.2. Environmental models
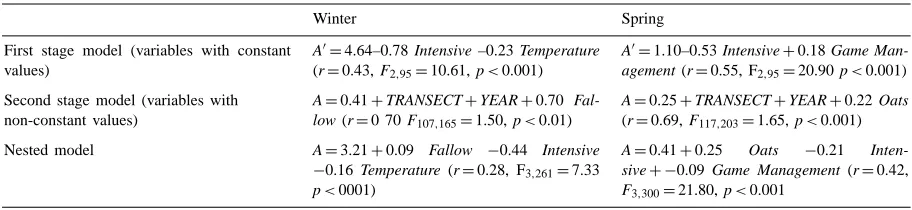
Table 6 presents the environmental models. Both nested models successfully explained the between-transect and between-year variation in corn bunting abundance, the comparisons with the two-stage models being non-significant (F104,165= 1.33, p > 0.05 for the winter models; F114,203=1.10,
p > 0.05 for the spring ones).
Of the variables selected by the models, fal-low area was significantly smaller in the inten-sive land-use category than in the others ANOVA (F2,270=98.71, p<0.001), and temperature was higher in the extensive land-use category than the others (F2,109=10.76, p<0.001). The area of oats in montado was greater than that in the other land-use categories (F2,318=4.31, p<0.05). There was no significant difference in the occurrence of game man-agement among land-use categories (χ22=0.25, ns). The variables selected for the winter models were all correlated (Fallow versus Intensive: r271= −0.65;
Fallow versus Temperature: r263=0.24; Intensive
versus Temperature: r334= −0.25; p<0.001 for all), whereas only Oats and Intensive were signifi-cantly correlated in the spring data set (r319= −0.12,
p<0.05).
3.3. Invertebrate abundance
Mean numbers of Lepidoptera larvae per sweep net sample (±SE) did not differ between extensive (0.29±0.14) and intensive cereal crops (0.23±0.11,
t36=0.023, ns), but, across both categories, their abundance was positively associated with weed cover (r36=0.671, p<0.001). There was no such rela-tionship for Orthoptera (r36=0.09, ns), but these were more abundant in extensive (1.06±0.26) than intensive cereals (0.19±0.09, t36=3.84, p<0.001).
4. Discussion
Table 5
Relative density of corn buntings in three Alentejo farming systems in winter and spring (n=number of 250 m transects), 95% confidence limits (c.l.), total numbers of birds and the numbers of bird groups in winter (clusters)
Montado Extensive Intensive
n Density birds 95% c.l. Birds/ n Density birds 95% c.l. Birds/ n Density birds 95% c.l. Birds/
per km2 clusters per km2 clusters per km2 clusters
Winter
1994 38 33.7 19.3–58.9 72/27 32 170.8 73.7–395.9 210/23 27 4.1 0.4–38.7 5/4 1995 26 35.9 17.6–73.4 74/19 35 48.9 17.5–136.5 81/15 31 2.8 1.1–7.2 4/4 1996 42 37.0 22.4–60.7 86/34 42 104.6 61.6–177.7 166/38 31 17.6 6.7–46.2 16/7 Spring
1995 42 55.9 46.1–67.8 125 42 30.0 23.0–39.1 60 31 29.1 21.4–39.7 43
1996 41 42.0 33.6–52.6 88 34 49.9 41.3–60.2 133 26 12.0 8.0–18.0 24
1997 42 54.5 44.4–66.9 109 36 35.4 27.1–46.2 59 28 16.9 11.4–25.2 25
Europe (Donald and Evans, 1994), and with the find-ings of Diaz and Telleria (1997) in Spain. The associ-ation with fallow also explains the low winter density in intensively managed farmland. The relatively low winter densities associated with montado are also con-sistent with the findings of Diaz and Telleria (1997), who suggested that low densities in relatively enclosed habitats, such as montado and shrubland, might be the result of a greater risk of predation in these habitats.
Whereas Diaz and Telleria (1997) report wider habitat use in winter than in the breeding season, the present data suggest the reverse. In Spain, highest breeding densities (120 birds per km2) were found in ‘treeless cereal cropland’ and grassland was preferred over cereals, whereas in this study, montado supports breeding densities at least as high as those of exten-sively managed open farmland. Tree density in Alen-tejo (10.54 trees/ha±se=0.70, range 2.40–18.40) could be lower now than in the past (Natividade, 1950; Palma et al., 1985), and than that in Spain,
Table 6
Environmental models, TRANSECT and YEAR being dummy variables in the second-stage models
Winter Spring
First stage model (variables with constant values)
A′
=4.64–0.78 Intensive –0.23 Temperature (r=0.43, F2,95=10.61, p<0.001)
A′
=1.10–0.53 Intensive+0.18 Game
Man-agement (r=0.55, F2,95=20.90 p<0.001) Second stage model (variables with
non-constant values)
A=0.41+TRANSECT+YEAR+0.70
Fal-low (r=0 70 F107,165=1.50, p<0.01)
A=0.25+TRANSECT+YEAR+0.22 Oats (r=0.69, F117,203=1.65, p<0.001) Nested model A=3.21+0.09 Fallow −0.44 Intensive
−0.16 Temperature (r=0.28, F3,261=7.33
p<0001)
A=0.41+0.25 Oats −0.21 Inten-sive+ −0.09 Game Management (r=0.42,
F3,300=21.80, p<0.001
because of government incentives to clear land for wheat growing in the first half of the century and later disease amongst oak trees (Vieira and Eden, 1995).
The influence of private and associative game in-terests on breeding corn bunting abundance can be attributed to the maintenance of nesting and foraging habitats for the red-legged partridge Alectoris rufa, a species with similar habitat requirements to corn bunting. Game management is already suspected to contribute to the conservation of other non-game species, such as bustards Otis tarda and Tetrax tetrax, in Alentejo (Rio Carvalho et al., 1995).
farm-land. In the current study, corn buntings were observed carrying grasshoppers in the early morning (when they are probably easier to catch). Although abundance of Lepidoptera larvae appeared to be related to that of arable weeds, higher abundance of Orthoptera in ex-tensively managed cereals could be the result of incor-poration of fallows into the extensive system, which provide stable conditions over winter.
As extensively managed farmland appears to offer suitable foraging habitats in both winter and spring, productivity and winter survival may be highest un-der this form of management. Although present in in-tensively managed areas in the breeding season, corn buntings in this habitat might represent sink popula-tions (Pulliam, 1988), whose existence is dependent on extensive cereal management elsewhere in the region. In terms of corn bunting conservation, continuation of extensive management of open cereal cropland should be a priority. This habitat supports more bird species of current conservation concern than any other (Tucker and Heath, 1994; Santos, 1996; Araújo et al., 1996). Some of these species (e.g., lesser kestrel Falco
nau-manni, great bustard O. tarda, little bustard T. tetrax
and roller Coracias garrulus) share the corn bunting’s requirement for relatively large invertebrates, such as Orthoptera.
Extensive cereal production is increasingly difficult to justify in economic terms, and areas that are un-suitable for intensification are experiencing a longer fallow stage or complete abandonment, followed by scrub encroachment or afforestation (Baldock, 1991; Bignal and McCracken, 1996).
Adoption of appropriately designed agri-environ-mental measures provides one opportunity for the conservation of corn buntings and other steppe species (Potts, 1997). In part of Alentejo, a zonal plan under EU regulation 2078/92 provides for economic mea-sures to maintain arable management on environmen-tal and social grounds, but implementation of such measures has been limited by a lack of state funding, and by poor ecological and economic understand-ing on the part of farmers. Encouragement of game management for private or associative hunting could provide one means of maintaining more ecologically beneficial practices. These issues should be addressed if the core of Europe’s corn bunting population and many of the continent’s most threatened birds are to be maintained.
Acknowledgements
This study was part of a wider project on biodiver-sity of European farming systems and was funded by ERENA and the European Commission Environment Programme (PL93-2239). Additional funding was pro-vided by the Portuguese Institute for Agrarian Re-search (INIA) through the project PAMAF-8151. Peter Eden provided agricultural information. Nicholas Ae-bischer advised on statistical analysis. He, Francisco Moreira and an anonymous referee helped to improve the manuscript.
References
Aebischer, N.J., Ward, R.S., 1997. The distribution of corn buntings in Sussex in relation to crop types and invertebrate availability. In: Donald, P., Aebischer, N.J. (Eds.), The Ecology and Conservation of Corn Buntings Miliaria calandra. JNCC, Peterborough, pp. 124–138.
Araújo, M., Borralho, R., Stoate, C., 1996. Can biodiversity be measured using composite indices? In: Farinha, J.C., Almeida, J., Costa, H. (Eds.), I Congresso de Ornitologia. Sociedade Portuguesa para o Estudo das Ayes, Lisbon, pp. 124–125. Baldock, D., 1991. Implications of EC farming and countryside
policies for conservation of lowland dry grasslands. In: Goriup, P.D., Batten, L.A., Norton, J.A., (Eds.), The Conservation of Lowland Dry grassland Birds in Europe. JNCC, Peterborough, pp. 111–117.
Bignal, E.M., McCracken, D.l., 1996. Low-intensity farming systems in the conservation of the countryside. J. Appl. Ecol. 33, 413–424.
Brickle, N.W., Harper, D.C.G., 1999. Diet of nestling corn buntings Miliaria calandra in southern England examined by compositional analysis. Bird Study, in press.
Buckland, S.T., Anderson, D.R., Burnham, K.P., Laake, J.L., 1993. Distance Sampling, Estimating Abundance of Biological Populations. Chapman & Hall, London.
Cordovil, F.C., 1993. Tipos de Agricultura na Zona Agraria de Aljustrel por Subzonas em 1989. Dinamia, Lisboa, 88 pp. Diaz, M., Telleria, J.L., 1997. Habitat selection and distribution
trends of corn buntings in the Iberian Peninsula. In: Donald, P., Aebischer, N.J. (Eds.), The Ecology and Conservation of Corn Buntings Miliaria calandra. JNCC, Peterborough, pp. 151–161. Donald, P.F., Evans, A.D., 1994. Corn Buntings Miliaria calandra
in Britain in winter. Bird Study 41, 199–210.
Elias, G., Reino, L.M., Silva, T., Tomé, R., Geraldes, P., 1999. Atlas das Aves Invernantes do Baixo Alentejo 1992/93–1994/95. Sociedade Portuguesa para o Estudo das Aves, Lisboa. ERENA, 1994. Estudo Técnico-Cient´ıifico de Suporte ao Plano
Eurostat, 1997. European Commission and Environment Agency. Europe’s Environment: Statistical Compendium for the Second Assessment. Luxembourg, Eurostat.
Eurostat, 1998. Statistics in Focus: Environment, Luxembourg. Eurostat.
Laake, J.L., Buckland, S.T., Anderson, D.R., Burnham, K.P., 1993. DISTANCE User’s Guide, Version 2.0. Colorado Co-operative Fish and Wildlife Research Unit, Colorado State University, Fort Collins, USA, 72 pp.
Natividade, J.V., 1950. Subericultura. Direcção Geral dos Serviços Florestais e Aqu´ıcolas, Lisboa, 387 pp.
Palma, L., Onofre, N., Oliveira, L., 1985. Situacao actual e perspectivas de conservação da fauna silvestre nos povoamentos de sobro e azinho — sua importancia como factor de valorização ecológica e económica. In: Proc. Congresso Sobre o Alentejo, vol. 3. Associação dos Municipios do Distrito de Beja, Beja, pp. 1487–1502.
Potts, G.R., 1986. The Partridge. Pesticides, Predation and Conservation. Collins, London.
Potts, G.R., 1997. Cereal farming, pesticides and grey partridges. In: Pain, D., Pienkowski, M. (Eds.), Farming and Birds in Europe. Academic Press, London, pp. 151–177.
Pulliam, H.R., 1988. Sources, sinks, and population regulation. American Naturalist 132, 652–661.
Rio Carvalho, C., Borralho, R., Bugalho, J., Barreto, A., 1995. A exploração dos recursos bravios e a sua relação com a economia
agr´ıcola: perspectivas actuais. Revista de Ciências Agrarias 18, 11–22.
Rufino, R., 1989. Atlas das Aves que Nidificam em Portugal Continental. CEMPA, Lisboa, 215 pp.
Santos, C.P.D., 1996. O abandono dos campos agr´ıcolas e suas implicações nas communidades de aves nidificantes. Ciência e Natureza 2, 95–102.
Serviço Meteorológico Nacional, 1975a. Carta 1:1000000 da Humidade do Ar, Humidade Relativa às 9 T.M.G Atlas do Ambiente, Comissão Nacional do Ambiente, Lisboa. Serviço Meteorológico Nacional, 1975b. Carta 1:1000000 da
Precipitação, Quantidade Total. Atlas do Ambiente. Comissão Nacional do Ambiente, Lisboa.
Serviço Meteorológico Nacional, 1975c. Carta 1:1000000 da Temperatura, Temperatura Média do Ar. Atlas do Ambiente. Comissão Nacional do Ambiente, Lisboa.
Tucker, G.M., Heath, M.F., 1994. Birds in Europe: their Conservation Status. Birdlife International, Cambridge. Vieira, L.M., Eden, P., 1995. The Portuguese Montados. In:
McCracken, D.I., Bignal, E.M., Wenlock, S.E., (Eds.), Farming on the Edge: the Nature of Traditional Farmland in Europe. JNCC, Peterborough, pp. 99–102.