Scaling-up the AFRCWHEAT2 model to assess phenological
development for wheat in Europe
Paula A. Harrison
a,∗, John R. Porter
b, Thomas E. Downing
a aEnvironmental Change Institute, University of Oxford, 1a Mansfield Road, Oxford OX1 3TB, UKbDepartment of Agricultural Sciences, Royal Veterinary and Agricultural University, Agrovej 10, 2630 Taastrup, Denmark
Received 2 June 1999; received in revised form 15 November 1999; accepted 22 November 1999
Abstract
A method was developed for scaling-up the AFRCWHEAT2 model of phenological development from the site to the continental scale. Four issues were addressed in this methodology: (i) the estimation of daily climatic data from monthly values, (ii) the estimation of spatially variable sowing dates, (iii) the simulation of multiple cultivars, and (iv) the validation of broad-scale models. Three methods for estimating daily minimum and maximum temperatures from monthly values were compared using AFRCWHEAT2: a sine curve interpolation, a sine curve interpolation with random daily variability, and two stochastic weather generators (WGEN and LARS-WG). The sine curve interpolation was selected for the continental scale application of AFRCWHEAT2 because computational time was short and errors were acceptably small. The average root mean square errors (RMSEs) for the dates of double ridges, anthesis and maturity were 6.4, 2.2 and 2.1 days, respectively. The spatial variability of European sowing dates was reproduced using a simple climatic criterion derived from the AFR-CWHEAT2 vernalization curve. The use of several cultivar calibrations enabled the broad-scale model to capture current responses and compare responses to future climate change. Results from the continental scale model were validated using a geographically-referenced database of observed phenological dates, output from other site-based models and sensitivity anal-ysis. The spatial model was able to emulate a similar spatial and temporal variability in phenological dates to these sources under the present climate. The predominant effect of an increase in mean temperature was a reduction in the emergence to double ridges phase. The shift in the timing of subsequent development stages to earlier in the season meant that changes in their duration were relatively minor. Changes in inter-annual temperature variability resulted in only small changes in the mean date of development stages, but their standard deviation altered significantly. ©2000 Elsevier Science B.V. All rights reserved.
Keywords: Site modelling; Spatial modelling; Winter wheat; Phenological development; Climate change; Scaling-up
1. Introduction
Scale is an inherent concern in resource manage-ment and planning, and hence in crop-climate
im-∗Corresponding author. Tel.:+44-1865-281186; fax:+44-1865-281181.
E-mail address: [email protected] (P.A. Harrison).
pact assessment. Farmers are most often concerned with conditions in their fields. Even at this micro-scale however, variability between and within fields is high (Church and Austin, 1983; Russell and van Gardingen, 1997), one of the key motivations behind the adop-tion of precision agriculture. Farmers are also inher-ently concerned with regional and global production — prices, markets and competitiveness. Commodity
boards and market regulators are more concerned with spatially aggregated values than production at a single site.
Many policy decisions to mitigate or adapt to cli-mate change must take place at the regional scale. For example, the European Union and member states are concerned with ‘What will be the impact of cli-mate change on national and European wheat produc-tion?’ rather than ‘What will be the impacts of climate change on potential wheat yields for specific fields or typical fields in a local area?’ It is not often feasible to perform experiments on crops at any scale larger than the field. Thus, there is a need to scale-up site scale ex-perimental and modelling observations to study such larger scale effects.
To address these concerns, two different scales of assessment are commonly used. Experimental pro-grammes and site-based mechanistic crop models have been used to analyse detailed physiological responses of crops to changes in environment at indi-vidual locations (e.g., Mearns et al., 1992; Miglietta and Porter, 1992; Kocabas et al., 1993; Semenov et al., 1996; Bindi and Fibbi, 1999; Wolf, 1999). At broader scales, simpler crop models have been used to analyse changes in aggregated response and spatial shifts in crop suitability and productivity (e.g., Kenny and Harrison, 1992; Brignall and Rounsevell, 1995; Carter and Saarikko, 1996; Harrison and Butterfield, 1996; Olesen et al., 1999).
The clear need is to link these two scales — the detailed, process-based, local site understand-ing and the regional, agroecology and landscape level of spatial planning. A primary concern when scaling-up is to retain the advantages of detailed site models (Harrison and Butterfield, 1996). The mech-anistic, process-orientation of site models produces more reliable predictions of responses to possible future changes in climate than simpler spatial mod-els (whether reduced-form or empirical correlations) (Carter et al., 1994). Several methods have been em-ployed to scale-up site models to regional assessments (van Gardingen et al., 1997; Downing et al., 1999). At the simplest level, results for representative sites are aggregated to a regional value (e.g., Easterling et al., 1993; Wolf, 1993; Rosenzweig and Parry, 1994). More spatially explicit approaches involve applying a site model to input data sets which are spatially interpolated to regular grids and/or coherent polygons
(e.g., Brklacich et al., 1996; Rounsevell et al., 1996; Easterling et al., 1998; Butterfield et al., 1999; Carter et al., 1999). More quantitative methodologies rely on relating the site characteristics to its spatial domain using remotely sensed and other environmental data sets (e.g., Bindi et al., 1999; Delécolle, 1999).
At larger spatial scales, feedbacks from veg-etation and land processes to the climate itself also become important. These issues are consid-ered in soil–vegetation–atmosphere transfer schemes (SVATs), which are used to represent land processes in global climate models (Koster and Suarez, 1994). Such feedbacks will in turn affect regional crop production. However, the feedbacks of land-surface processes to the atmosphere are complex and still far from understood (Dickinson et al., 1996) and are thus considered to be outside the remit of this paper.
This paper critically evaluates methods for scaling-up the phenology model of AFRCWHEAT2 (Weir et al., 1984; Porter et al., 1987; Porter, 1993) from the site scale to a large European region. We discuss restrictions, such as the availability of input, calibration and validation data sets, to the application of mechanistic crop models across large regions. We then evaluate the sensitivity of broad-scale wheat de-velopment to changes in temperature, such as might be experienced with climate change.
AFRCWHEAT2 models wheat development through the interaction of thermal time, photope-riod and vernalization. Dates of emergence, double ridges, terminal spikelet, anthesis, beginning and end-of-grain filling and physiological maturity are calculated by the model for a specific cultivar. Double ridges is an early reproductive apical development stage; terminal spikelet marks the end of the cre-ation of grain-producing spikelet primordia. Input data required by AFRCWHEAT2 for phenological development are daily minimum and maximum air temperature, sowing date and latitude. Calibration and validation data for an appropriate wheat variety at the site of interest are also required. These data are not available across large regions, such as Europe. We address four specific questions in this paper in order to scale-up the AFRCWHEAT2 model:
2. What climatic criterion can be used to determine realistic, spatially variable sowing dates across Europe?
3. How can different wheat varieties cultivated in Europe be represented in the broad-scale model? 4. How can the scaled-up broad-scale model be
vali-dated?
2. Methods
2.1. Estimating daily temperature data
A spatial climatic database for Europe extend-ing from 11◦W to 42◦E and from 35 to 71.5◦N at a resolution of 0.5◦ latitude/longitude was utilised. This contained observed time series data for monthly minimum, mean and maximum temperatures from 1961 to 1990 (Hulme et al., 1995) and period-mean standard deviations of daily mean temperatures about each monthly mean (Carter et al., 1991). Observed time series of daily minimum and maximum temper-atures covering varying lengths from 10 to 106 years were obtained for 219 sites. The sites are distributed throughout Europe, but there was a paucity of sites in eastern Europe and northern Fenno-Scandinavia.
The effect of using three methods for estimating daily temperatures from monthly values were investi-gated with the AFRCWHEAT2 model:
1. A sine curve interpolation is a simple and com-monly adopted technique, which involves fitting a sine curve with an annual period to mean monthly observations of temperature. The sine curve inter-polation of Brooks (1943) was used.
2. A stochastic weather generator, a more complex method, involves simulating daily weather as a stochastic process, in which the observed statis-tical properties of individual weather variables and the correlation structure between variables are reproduced. Two stochastic weather generators (WGEN: Richardson and Wright, 1984; Richard-son and Nicks, 1990; LARS-WG: Racsko et al., 1991; Semenov and Barrow, 1997) were used. 3. An intermediate approach, based on an adaptation
of the sine curve interpolation routine of Brooks (1943), calculates daily deviations from monthly mean temperatures which are randomly generated assuming a normal distribution with known mean
and standard deviation. Barrow and Hulme (1996) found that daily maximum and minimum temper-atures in monthly subsets generally conformed to normal or transformed normal distributions at nine sites in the UK.
The three methods for estimating daily temperature data were compared at eight sites located in differ-ent regions of Europe. As the purpose of this exercise was to compare the different methods, a typical sow-ing date and a ssow-ingle cultivar (Avalon) were used for each site. The mean and maximum difference in the prediction of dates of each development stage between using observed and estimated daily data were anal-ysed. Mean differences in the dates of double ridges, anthesis and maturity are shown in Table 1.
For all methods the estimated mean date falls well within the range of dates predicted using observed daily data. The sine curve method predicts the small-est difference for the southern European sites (Mont-pellier, Brindisi, Seville) where deviations are within 1 day on average. Predictions using this method are slightly worse at the other sites, but are still within 8 days for double ridges, 4 days for anthesis and 3 days for maturity. In general, daily temperatures are more variable at the northern and eastern European sites. Thus, the simple sine curve interpolation is the most accurate at the sites where temperatures are the least variable. The sine curve method with random daily temperature variability shows more consistent devia-tions for all sites of between 1 and 4 days at double ridges and between 0 and 2 days at anthesis and matu-rity. The two weather generators give marginally bet-ter results at some sites, but gains in accuracy are only small. No consistent improvement in the prediction of all development stages throughout the range of sites is observed.
Table 1
Mean difference in the prediction of the dates of double ridges, anthesis and maturity for winter wheat calculated using the AFRCWHEAT2 model with observed daily temperature data and three methods for estimating daily temperature data for eight sites (in days)
Site Mean date (range) of Mean difference from mean date of stage using estimated daily data stage using observed daily
data (DOY) Sine curve Sine curve with ran- WGEN LARS-WG interpolation dom daily variabilitya
Double ridges:
Jokioinen, Finland 143.1 (122–153) +3.6 −0.9 −5.2 +1.2
Edinburgh, Scotland 63.3 (24–104) +4.6 +3.6 −7.5 no data
Wageningen, The Netherlands 96.7 (66–123) +7.4 +2.7 −0.9 +8.5
Rothamsted, England 92.9 (64–114) +4.7 +1.7 −1.1 +5.3
Debrecen, Hungary 103.3 (84–117) +5.8 +2.3 −2.1 +3.2
Montpellier, France 64.1 (48–90) +0.6 +1.7 +0.2 +2.0
Brindisi, Italy 48.8 (42–59) +0.2 +1.9 −0.6 no data
Seville, Spain 45.8 (43–49) +0.3 +1.7 −1.4 −0.5
Anthesis:
Jokioinen, Finland 176.2 (168–183) +2.5 +0.3 −2.0 +1.8
Edinburgh, Scotland 161.2 (150–178) +1.5 +1.5 −2.5 no data
Wageningen, The Netherlands 160.8 (148–171) +3.1 +1.7 −1.1 +4.0
Rothamsted, England 164.7 (152–172) +2.3 +1.6 −1.0 +2.0
Debrecen, Hungary 154.8 (144–163) +2.5 +1.3 −1.3 +1.3
Montpellier, France 138.9 (128–148) +0.7 +1.4 −1.1 +0.5
Brindisi, Italy 130.0 (123–136) +0.2 +1.2 −0.9 no data
Seville, Spain 121.3 (118–125) +0.1 +1.5 −0.6 +0.7
Physiological maturity:
Jokioinen, Finland 221.9 (209–236) +2.8 +1.0 −0.2 +2.7
Edinburgh, Scotland 212.5 (197–227) +1.4 +2.0 −2.2 no data
Wageningen, The Netherlands 204.5 (189–217) +2.8 +1.8 −0.9 +3.9
Rothamsted, England 211.2 (197–221) +1.9 +1.8 −0.4 +1.8
Debrecen, Hungary 191.2 (182–200) +2.0 +1.6 −0.9 +1.1
Montpellier, France 175.5 (164–184) +0.7 +1.7 −1.8 −0.8
Brindisi, Italy 166.4 (160–174) −0.03 +1.1 −1.6 no data
Seville, Spain 157.5 (152–164) +0.2 +1.6 −0.7 +0.8
aAverage of 100 simulations.
both high and low temperatures, but consistent with the greater range of predicted dates calculated from observed daily data. For example, the maximum devi-ation at Edinburgh was approximately 20 days using both sine curve methods, but this should be compared with an inter-annual range of occurrence for this stage of 80 days.
These results show that no or small improvements in accuracy are gained by using complex methods for estimating daily temperatures compared with a sim-pler sine curve interpolation. Given that the more com-plex methods require longer computing times (a key consideration in spatial modelling), we concluded that the sine curve interpolation is the most appropriate method for use in the broad-scale model.
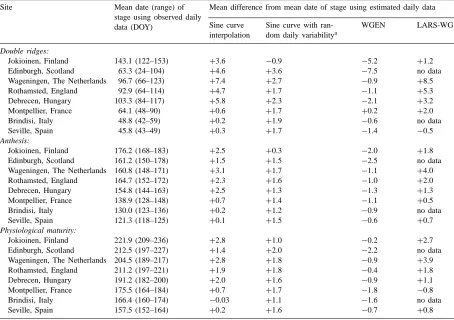
Fig. 1. Comparison of the mean duration (in days) of six wheat development phases calculated using the AFRCWHEAT2 model with observed daily data and daily data estimated using a sine curve interpolation routine: (a) emergence to double ridges; (b) double ridges to terminal spikelet; (c) terminal spikelet to anthesis; (d) anthesis to beginning of grain filling; (e) beginning to end of grain filling; and (f) end of grain filling to maturity.
model. The effects of vernalization and photoperiod interact with thermal time during the emergence to double ridges phase, whilst only photoperiod interacts with thermal time to predict the phases between dou-ble ridges and anthesis. All other phases are calculated from thermal time alone. Hence, it would appear that the effect of vernalization is not accurately reproduced using estimated daily data which causes slightly longer phase durations. However, the interaction of photope-riod reverses this effect to a limited extent.
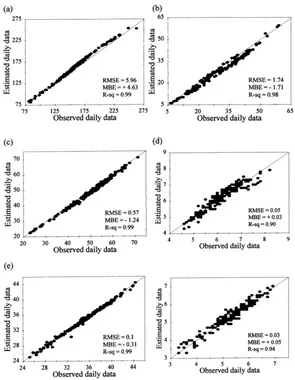
Fig. 2. Root mean square error (RMSE) between the date of double ridges calculated using the AFRCWHEAT2 model with observed daily data and daily data estimated using a sine curve interpolation routine. Data interpolated from 219 sites.
site climatic data indicates that temperature variability is large over winter in this region. This is reflected in a high inter-annual variability of the timing of double ridges (see Table 1). The average RMSE for double ridges from the 219 sites is 6.4 days. All other mod-elled stages exhibit lower errors than double ridges, ranging from 0 to 8 days with a mean value of 2.2 days for anthesis and from 0 to 10 days with a mean value of 2.1 days for maturity.
2.2. Estimating a spatially variable sowing date
The date of sowing is an input variable in the AFR-CWHEAT2 model and, hence, a method is needed to estimate sowing dates across Europe. In south-ern Europe winter wheat is sown close to the time when vernalization will be most effective (M. Bindi and F. Miglietta, personal communication, 1992). Ac-cording to the AFRCWHEAT2 model, vernalization occurs from −4 to 17◦C with an optimum temper-ature range of 3–10◦C. The date of sowing in the broad-scale model was defined as the first day of au-tumn (after 1 September) when the mean temperature is 11.75◦C or lower. Based on the sine curve
interpo-lation from monthly values, this threshold is reached at three-quarters of the period between the maximum vernalizing temperature (17◦C) and the beginning of the optimum range (10◦C). Using this threshold as-sumes that temperatures will decrease sufficiently to be within the optimum vernalizing temperature range after the crop has emerged.
2.3. Accounting for multiple varieties
Table 2
Details of AFRCWHEAT2 model parameters for six winter wheat cultivars
Developmental phase Avalona Ribandb Slepnerc Hustlerd Cariboe Alcalaf
Sowing to emergence: Tt: 120>1g Tt: 120>1 Tt: 120>1 Tt: 148>1 Tt: 125>1 Tt: 120>1
Emergence to double ridges: PVTt: 270>1 PVTt: 285>1 PVTt: 380>1 PVTt: 284>1 PVTt: 270>1h PVTt: 270>1
PTt: 600>1 PTt: 600>1
Double ridges to terminal spikelet: PTt: 120>1 PTt: 100>1 PTt: 140>1 PTt: 90>1 Terminal spikelet to anthesis: PTt: 400>1 PTt: 400>1 PTt: 400>1 PTt: 185>1
Tt: 350>9 Tt: 350>9
Anthesis to beginning of grain filling Tt: 100>0 Tt: 100>0 Tt: 100>0 Tt: 40>9 Beginning to end of grain filling Tt: 550>0 Tt: 550>0 Tt: 550>0 Tt: 260>9 End of grain filling to maturity Tt: 100>0 Tt: 100>0 Tt: 100>0 Tt: 65>9
aAvalon: fast developing UK cultivar. Source: J.R. Porter (personal communication, 1991). bRiband: medium fast developing UK cultivar. Source: Semenov et al. (1993).
cSlepner: slow developing UK cultivar. Source: Semenov et al. (1993). dHustler: slow developing UK cultivar. Source: Weir et al. (1984). eCaribo: slow developing Dutch cultivar. Source: Reinink et al. (1986).
fAlcala: fast developing Spanish cultivar. Source: M.A. Semenov (personal communication, 1994).
gTt=thermal time; PTt=photo-thermal time; PVTt=photo-vernal-thermal time (see Weir et al. (1984) for appropriate equations).
Numbers refer to Tt/PTt/PVTt thresholds above a base temperature (in◦ C).
hPVTt is only used to calculate the phase from emergence to floral initiation (model parameters are 145>1) and then PTt is used to
calculate the phase from floral initiation to double ridges (model parameters are 125>1).
Table 3
Comparison of observed and simulated sowing dates
Country Observeda Simulated
Fenno-Scandinavia:
Finland 28 August–5 September 1–15 September
Norway 5–15 September 1–24 September
Sweden 3–30 September 1–30 September
Denmark 20–30 September 22 September–3 October
Central and eastern Europe:
Poland 15 September–6 October 18 September–5 October
Czech Republic and Slovakia 30 September–5 October 10 September–8 October
Romania 11–25 September 13 September–28 October
Bulgaria 5–31 October 23 September–8 November
Hungary 10–21 October 3–17 October
North-west Europe:
United Kingdom 13 September–26 October 1 September–29 October
The Netherlands 1–27 October 2–14 October
Germany 15–25 October 20 September–12 October
France 1 October–15 November 14 September–29 November
Southern Europe:
Portugal 20 October–21 November 14 October–31 December
Spain 20 October–5 December 2 October–31 December
Italy 20 October–29 December 23 September–31 December
aObserved dates of sowing from Broekhuizen (1965), Bunting et al. (1982), Weir et al. (1984), Kirby et al. (1985), Thompson and
3. Results
3.1. Sowing date
Predicted sowing dates from the broad-scale model for the mean 1961–1990 climatic period are com-pared with observed dates of sowing in Table 3. The model reproduces the spatial pattern of ob-served sowing dates across Europe reasonably well. In Fenno-Scandinavia winter wheat is sown from late August to late September. This corresponds with a simulated range from early September to early Octo-ber. In central and eastern Europe sowing of winter wheat is reported to occur from mid September to late October. This is encompassed by a simulated range for this region of mid September to early Novem-ber. In northwest Europe sowing dates vary from mid September to late November, which agree with simulated dates ranging from early September to late
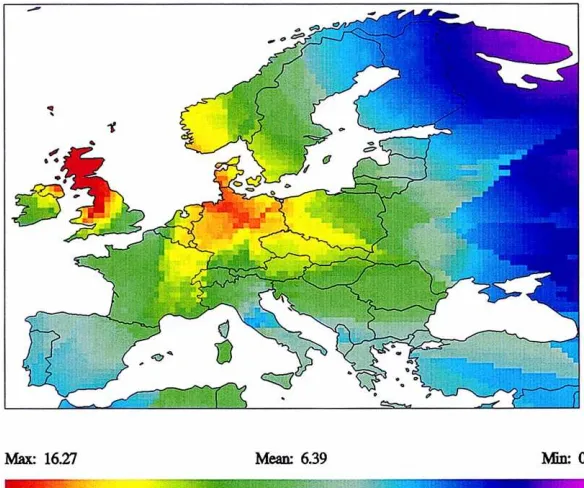
Fig. 3. Simulated dates of (a) double ridges, and (b) anthesis for cv. Avalon for the mean 1961–1990 climatic period. Two suitability masks (cold winters and wet autumns) are overlain on model results (see Harrison and Butterfield, 1996).
November. In southern Europe sowing occurs from mid October to late December. This is captured by the broad-scale model, which simulates dates from late September to late December.
3.2. Development stages — qualitative validation
Febru-ary to early March for Spain (Narciso et al., 1992). In central, eastern and northern Europe double ridges is predicted to occur from early April to mid May. This fits the observed average time of double ridges in Hun-gary of early to mid April (Zs. Harnos, personal com-munication, 1994). Dates of anthesis for winter wheat range from early May to mid June in southern Europe for the range of cultivars. This concurs with reported dates from late April to early June for Italy and Spain (Miglietta, 1991; Narciso et al., 1992), from mid May to late May in Greece (Narciso et al., 1992) and from mid May to mid June for Albania, Bulgaria and Roma-nia (Russell and Wilson, 1994). In central and north-ern Europe anthesis occurs between early June and early July. These predictions agree with observed dates of anthesis from late May to late June for Hungary, Poland, the Czech Republic and Slovakia (Zs. Harnos, personal communication, 1994; Russell and Wilson, 1994), from early June to late June for Germany, Den-mark, the UK and the Benelux countries (Broekhuizen, 1965; Porter et al., 1987; Nonhebel, 1993) and from late June to early July in Fenno-Scandinavia (Russell and Wilson, 1994).
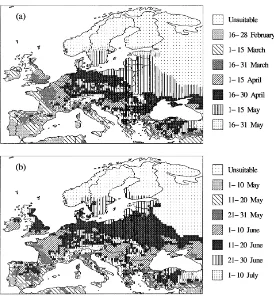
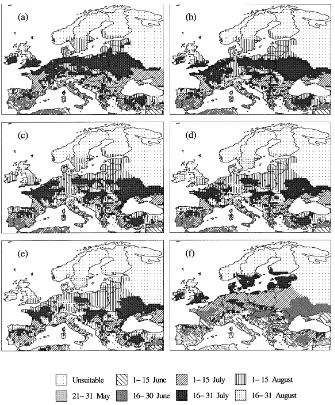
Simulated dates of maturity for all six winter wheat cultivars for the mean 1961–1990 climatic period are shown in Fig. 4. Avalon, Riband, Slepner, Hustler and Caribo are all northwest European wheat varieties and, hence, results are only described for this region. Maturity occurs from late July to early August for Avalon (a fast developing variety), from late July to early August for Riband (a medium-fast developing variety), in early August for Slepner (a slow develop-ing variety) and from early to mid August for Hustler and Caribo (both slow developing varieties). These predictions encompass the range of observed dates in the UK (Weir et al., 1984; Crofts, 1989; Hough, 1990), The Netherlands (Reinink et al., 1986; Non-hebel, 1993), Belgium (Broekhuizen, 1965) and Ger-many (Broekhuizen, 1965; Crofts, 1989).
Differences in the predictions for each cultivar can be explained with reference to their model calibra-tions (see Table 2). Model calibracalibra-tions for Avalon, Riband and Slepner only differ in the thresholds used for early development stages. Slightly longer thresholds are used for the period from emergence to anthesis for the slower developing cultivars Riband and Slepner causing slightly later predicted dates of maturity. Avalon, Riband and Slepner use a base
temperature of 0◦C from anthesis to maturity, whilst Hustler and Caribo use a base temperature of 9◦C. The original version of the AFRCWHEAT2 model (ARCWHEAT1) assumed ‘a rather high base temper-ature of 9◦C’ for Hustler (Weir et al., 1984). Later calibrations of the model were changed to assume a lower base temperature of 0◦C because the 9◦C base temperature placed an unrealistic restriction on wheat development in northern latitudes, such as Scotland, which are classified as unsuitable for Hustler and Caribo. Cultivars Hustler and Caribo also have slightly longer thresholds for the early development stages, which coupled with the higher base temperature for the later development stages, causes later maturity dates compared with Avalon, Riband and Slepner. The model calibration for Caribo differs from Hustler in three ways (Reinink et al., 1986). Firstly, slightly shorter thresholds are used for early developmental stages. Secondly, the vernalization curve and require-ment are stricter with only temperatures between−1 and 9◦C contributing to vernalization. Thirdly, the state of vernalization is fixed at the floral initiation stage so that incomplete vernalization has a delaying effect on subsequent stages of development. These differences result in later predictions of maturity dates compared with Hustler.
Alcala is the only southern European cultivar for which calibration data were available. The thresholds for the phases between double ridges and anthesis are much shorter than for all the other cultivars. Predicted dates of maturity in Spain for cultivar Alcala range from mid May to early July (Fig. 4f). These match the observed range of dates from late May to late July for this region as reported in Broekhuizen (1965), Narciso et al. (1992) and Wolf et al. (1996).
3.3. Developmental stages — quantitative validation
Fig. 4. Simulated dates of physiological maturity for six winter wheat cultivars for the mean 1961–1990 climatic period: (a) cv. Avalon; (b) cv. Riband; (c) cv. Slepner; (d) cv. Hustler; (e) cv. Caribo; and (f) cv. Alcala. Two suitability masks (cold winters and wet autumns) are overlain on model results (see Harrison and Butterfield, 1996).
statistics. Numerous observations of harvest date were available enabling this variable to be mapped across Europe and statistically compared with mapped output on the date of physiological maturity from the broad-scale model. However, maturity is not a well-defined stage and hence, these comparisons only validate the approximate magnitude and spatial pat-tern of model predictions. The stage of anthesis is better defined, but the number of observations avail-able for this stage is considerably less. However,
sufficient data on anthesis date were available to un-dertake comparisons at the national scale. Data for other development stages were restricted to only a few specific countries.
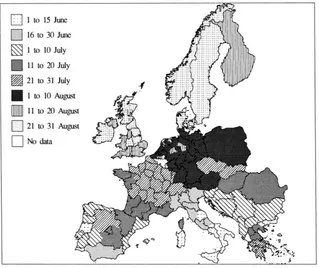
devel-Fig. 5. Observed average date of harvest in Europe. Data from Broekhuizen (1965), Bunting et al. (1982), Weir et al. (1984), Thompson and Stokes (1985), Reinink et al. (1986), Crofts (1989), Hough (1990), Narciso et al. (1992), Nonhebel (1993), Zs. Harnos (personal communication, 1994), Russell and Wilson (1994) and J. Wolf (personal communication, 1994).
opment across Europe. When conducting this compar-ison, two factors must be taken into account. Firstly, observed dates of harvest are the average value for a region and for all winter wheat varieties grown in that region. Secondly, physiological maturity, as de-fined in the AFRCWHEAT2 model, generally occurs about 1–2 weeks before harvest. For example, the ob-served average harvest date for Spain ranges from mid June to late July. Hence, predicted dates of physiolog-ical maturity for an average cultivar in Spain should be approximately 1–2 weeks earlier, i.e., from early June to mid July. The modelled cultivar Alcala, is a fast developing variety and, hence, maturity might be expected to occur slightly earlier than for an average cultivar. This agrees with predicted dates, which range from late May to early July in Spain.
Simulated dates of maturity have been subtracted from observed dates of harvest for three cultivars in the UK in Fig. 6. There is reasonable agreement across the varieties taking into account the 1–2 week displacement between physiological maturity and
harvest. Specifically, the model predicts earlier dates than observed for Avalon (a fast developing cultivar), marginally earlier dates for Slepner and marginally later dates for Hustler (a slow developing cultivar).
A comparison of observed and modelled dates of anthesis is shown in Fig. 7 for selected European coun-tries/regions. In some countries, particularly Greece and France, the observed range of dates is consider-ably less than that indicated by the spatial model. This may reflect an insufficient or unrepresentative sam-ple of observations rather than errors in the model, because the date of maturity is reasonably simulated for these countries. Nevertheless, predictions from the broad-scale model correspond to the range of obser-vations in the majority of countries and the general spatial pattern of the observed occurrence of anthesis across Europe is reproduced.
Fig. 6. Simulated date of physiologial maturity minus observed average date of harvest for three cultivars in the UK: (a) cv. Avalon; (b) cv. Riband; and (c) cv. Slepner.
reproduce inter-annual variability. It is not possible to conduct an experiment at the scale of a 0.5◦ lati-tude/longitude cell, hence, such comparisons can only broadly assess the ability of the broad-scale model to simulate year-to-year variability in wheat develop-ment. For example, simulated dates from the spatial
Fig. 7. Comparison of simulated and observed dates of anthesis. S.E. Europe includes Bulgaria, Romania, Albania and the former Yugoslavia; Central Europe includes the Czech Republic, Slovakia and Hungary; Fenno-Scandinavia includes Finland, Denmark, Sweden and Norway. Modelled dates for Spain, Italy, Greece and S.E. Europe are for cv. Alcala. Modelled dates for all other countries encompass cvs. Avalon, Riband, Slepner, Hustler and Caribo. Values in brackets refer to the number of observations.
Table 4
Comparison of simulated phenological dates from the broad-scale model against results from the ARCWHEAT1 site model and experimental data for cv. Hustler for three consecutive growing seasons at Rothamsted, UKa
Growing season Development stage Experimental observationb ARCWHEAT1 site modelb Broad-scale model
1978–1979 Sowing 287 287 287
Emergence 301 301 301
Double ridges 100 106 109
Anthesis 182 181 180
Maturity 237 230 228
1979–1980 Sowing 291 291 291
Emergence 307 310 308
Double ridges 93 94 96
Anthesis 168 174 171
Maturity 230 231 226
1980–1981 Sowing 302 302 302
Emergence 326 328 331
Double ridges 99 91 99
Anthesis 177 174 174
Maturity 226 228 222
aDates are in day of the year.
bData extracted from Weir et al. (1984).
differences in model performance rather than differ-ences in the input climatology. Predictions from the broad-scale model are, in general, as close to the exper-imental observations as those from the ARCWHEAT1 site model. In the 1978–1979 growing season the spa-tial model predictions are slightly worse than those from ARCWHEAT1, whilst in the 1979–1980 and 1980–1981 growing seasons both models perform reasonably well. The broad-scale model captures dif-ferences in developmental rates between the growing seasons, showing that 1978–1979 was the longest (315 days according to the experiment and 306 days according to the spatial model) and 1980–1981 was the shortest (289 days according to the experiment and 285 days according to the spatial model) of the three growing seasons. A slight over-prediction of the duration from emergence to double ridges followed by a slight under-prediction of the duration from dou-ble ridges to anthesis is evident. This concurs with the discussion of Fig. 1 in Section 2.1. The compensatory nature of these errors means that the timing and dura-tion of the grain filling period is accurately predicted. A comparison between the predicted date of matu-rity from the broad-scale model and three site models for the climatic period 1975–1985 for cultivar Alcala at Seville is shown in Table 5. These models were cali-brated and validated against experimental data sets for
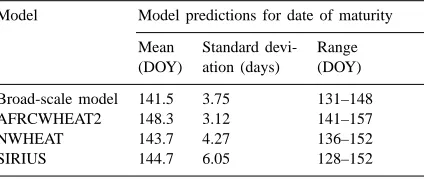
Seville (Wolf et al., 1996) and thus provide an addi-tional source of data for validation of predictions from the spatial model. Observed maximum and minimum temperatures at the site and cell were similar over this period, hence, predictions of development stages should also be similar between the models. The spa-tial model predicts a mean date of maturity of 141.5 for the cell containing Seville. This is slightly ear-lier than mean predictions from the site-based mod-els, by approximately 2, 3 and 7 days for NWHEAT (Groot, 1993; Wolf et al., 1995), SIRIUS (Jamieson et al., 1998) and AFRCWHEAT2, respectively. A similar standard deviation is predicted using the broad-scale
Table 5
Comparison of date of physiological maturity calculated at the site of Seville, Spain using the AFRCWHEAT2, NWHEAT and SIRIUS models with that calculated at the associated 0.5◦latitude/longitude cell using the broad-scale model for the 1975–1985 climatic period for cv. Alcala
Model Model predictions for date of maturity
Mean Standard devi- Range (DOY) ation (days) (DOY)
Broad-scale model 141.5 3.75 131–148
AFRCWHEAT2 148.3 3.12 141–157
NWHEAT 143.7 4.27 136–152
model to AFRCWHEAT2 and NWHEAT, but a greater value was found for the SIRIUS model. The range of predicted dates from the spatial model overlaps to a considerable degree with all the site-based models. Differences in the predictions between the broad-scale model and the site models are not significantly greater than differences between the site models themselves. The timing of other development stages at Seville also fell within the range of the site model predictions.
4. Model sensitivity
The broad-scale development model performs sat-isfactorily under the range of climatic variation for which it has been developed and validated. However, a change in mean climate, which may arise from the enhanced greenhouse effect, would lead to a shift in the range of climatic conditions under which winter wheat is grown in the future at a given location. Cou-pled with the likelihood of a change in mean climatic conditions, there is also the possibility of a change in the variability of climate. Studies have shown that crops show non-linear responses to changes in envi-ronmental variables (Semenov and Porter, 1995; Moot et al., 1996). Hence, it is important to test both the robustness and sensitivity of the broad-scale model to changes in the mean and variability of individual input variables.
4.1. Changes in mean temperature
The sensitivity of the spatial development model to incremental increases in minimum and maximum temperature was evaluated. Temperatures were in-creased by 1–4◦C in 1◦C intervals in a uniform manner throughout the year. As temperatures increase there is a progressive northward and eastward ex-pansion in the area of suitability due to a longer and warmer growing season. A 4◦C increase in temper-ature causes the limit of suitability to extend into mid Fenno-Scandinavia and most of Russia within the study region. The area of winter wheat suitability expands by, on average, 400,000 km2(or 5.4% of the area of suitability under current conditions) per 1◦C warming. This equates to a northward expansion of the limit of production in Finland of approximately 90 km per 1◦C warming, on average.
The rate of development increases with higher mean temperatures causing a reduction in the length of the growing period. This is because thermal time accu-mulates more rapidly with warmer temperatures and, hence, the thresholds of thermal time for each devel-opment stage are reached faster. An increase of 1◦C causes the duration from sowing to maturity to de-crease by 1–2 weeks across most of Europe. For each further 1◦C increase in temperature the length of the growing period reduces by, on average, approximately a week. With a 4◦C increase the duration from sow-ing to maturity decreases by 5–6 weeks in northwest Europe and by 3–4 weeks in southern and eastern Eu-rope.
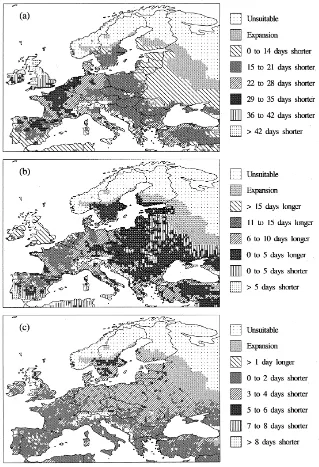
Increases in temperature affect the rate of develop-ment during different developdevelop-ment phases to different degrees. The effect of a 2◦C rise in temperature on three development phases is shown in Fig. 8 for cul-tivar Avalon. There is a strong reduction in the length of the phase between sowing and double ridges of 4–8 weeks in northwest Europe and 1 and 3 weeks in southern and eastern Europe. The pattern of response is reversed for the phase from double ridges to anthe-sis. Increases in phase length of 1–3 weeks are found in northwest Europe, whilst either small increases or reductions of 1–2 weeks are observed in southern and eastern Europe. The large reductions in the duration of the previous phases (up to double ridges) cause this phase to occur significantly earlier in the season. Tem-peratures experienced during this phase are actually cooler than at present, even with an increase in tem-perature, because of its earlier timing. The length of the grain filling period is reduced by less than 1 week throughout most of Europe. Changes to this phase are relatively small because it has also moved to slightly earlier in the season due to the combined effects of changes in the previous phases.
Fig. 8. Change in duration of three winter wheat (cv. Avalon) development phases following a uniform increase in mean minimum and maximum temperature of 2◦C: (a) sowing to double ridges; (b) double ridges to anthesis; and (c) beginning to end of the grain filling period.
in northern Europe, but within this range in southern Europe. Hence, the vernalization response is more sen-sitive to increases in temperature in northern Europe. Thirdly, photoperiod differences between northern and southern Europe affect the accumulation of
vernalization factor. However, photoperiod is the only factor influencing the accumulation of temperatures in spring (from double ridges to anthesis). Days are shorter in southern Europe in spring and this reduces the effectiveness of the same temperature in contribut-ing to thermal time, thus, resultcontribut-ing in a lower sensitiv-ity of development to increases in temperature. Butter-field and Morison (1992) reached similar conclusions in a comparison of the sensitivity of winter wheat development at northern and southern sites in the UK. There are small differences in the magnitude of re-sponse between the cultivars. The cultivars that simu-late development after anthesis using a base tempera-ture of 9◦C (e.g., Hustler, Caribo and Alcala) are more sensitive to increases in temperature than those culti-vars that assume a base of 0◦C (e.g., Avalon, Riband and Slepner). This may not accurately reflect physical differences between the varieties, but rather be a con-sequence of model formulation and calibration. Fur-ther, Caribo, which has a narrower range of vernaliz-ing temperatures than all the other cultivars, exhibits the most non-linear response to increases in tempera-ture. This results in smaller reductions in the length of the over winter development stages and a larger short-ening of the grain filling period. Cultivar Alcala ex-periences a similar reduction in the over winter devel-opment stages to Avalon. However, decreases in the length of the grain filling period are smaller and in some parts of Europe small increases in the length of this phase occur. This is because the timing of the grain filling period is fairly early under current climatic con-ditions, ranging from May to June. Hence, a forward shift in the timing of this period due to higher tem-peratures causes it to move from summer into spring when temperatures are significantly cooler.
4.2. Changes in temperature variability
The sensitivity of the broad-scale model to both in-creases and dein-creases in temperature variability was evaluated. Doubling the inter-annual variability of temperatures causes the mean date of double ridges to occur from 1 to 20 days earlier throughout central, northern and eastern Europe. The greatest shift in the date of this stage is centred over southern Sweden, Denmark, northern Germany, Poland and the Baltic states. A slightly later date of double ridges, by up
to 5 days, is predicted in Ireland, western France and the Mediterranean region. The mean date of anthesis and maturity change to a lesser extent, but in a sim-ilar pattern to that described for double ridges. Both stages occur slightly later, by 1–5 days, in Ireland, western France and the Mediterranean region and slightly earlier, by 1–8 days, throughout the rest of Europe. Alternatively, halving the annual temperature variability causes either no change or a very slight delay of 1–2 days in the mean date of occurrence of all phenological stages.
The standard deviation of all phenological stages increases with a doubling of temperature variability and decreases with a halving of temperature variabil-ity. The largest increases or decreases in standard de-viation for a doubling or halving of variability, respec-tively, occur in eastern Europe. Increases range from 3 to 13 days for a doubling and decreases range from 0 to 6 days for a halving of temperature variability. Changes in the standard deviation of anthesis are sim-ilar to those described for maturity. The standard de-viation of double ridges changes to a much greater extent for both perturbations. A doubling of variabil-ity causes the largest increases in standard deviation, ranging from 12 to 20 days, to occur in southern Sweden, Denmark, northern Germany, Poland and the Baltic states. This corresponds with the greatest shift earlier in the mean date of double ridges. A halving of temperature variability causes the largest decreases in standard deviation, ranging from 6 to 8 days, to occur in northwest Europe.
5. Discussion and conclusions
and computation time was short. The average RMSEs for the dates of double ridges, anthesis and maturity, calculated from 219 European sites, were 6.4, 2.2 and 2.1 days, respectively. The spatial pattern of observed sowing dates in Europe was reproduced using a simple climatic criterion. Despite its simplicity, this criterion is physiologically-based, using the AFRCWHEAT2 vernalization curve to ensure that the crop emerges shortly before temperatures decrease to be within the optimum range for vernalization. Several cultivar calibrations from previous studies were compiled to enable the broad-scale model to cover the range of responses that are likely across different European en-vironments under the present climate, and to compare different cultivar responses to climate change.
This spatial assessment of phenology has demon-strated that scaling-up from a mechanistic, process-based site model to a broad-scale model is possible with acceptably small errors. The reason for such re-markable accuracy is because phenological develop-ment is a process that integrates over time and is primarily dependent on atmospheric conditions. The processes that contribute to potential grain yield have similar attributes, i.e., they are generally cumulative and principally driven by temperature and solar radia-tion. Therefore, equivalent methods to those described here could be used to scale-up mechanistic models of crop potential growth. This has recently been tested for the potential growth sub-model of SIRIUS-Wheat (Jamieson et al., 1998). Errors were found to be ac-ceptable; the average RMSEs for total above-ground biomass at anthesis, total above-ground biomass at the end of grain filling and final grain yield, calculated from 175 European sites, were 1.7, 1.3 and 0.4 t ha−1 (Harrison et al., 1999). On the other hand, scaling-up crop processes that rely on soil conditions are sensi-tive to discrete weather events or are not inherently cumulative, is more difficult as clearly realised by re-search on water-limited crop yields (Landau et al., 1997; Carter et al., 1999), soil erosion (Kirkby, 1998) and stream flows (Arnell, 1998).
The lack of appropriate validation data restricts the evaluation of methods for scaling-up site-based crop models. No consistent data sets of phenological dates exist for the large European region. The construc-tion of a geographically-referenced database contain-ing observed and experimental data from the liter-ature, agricultural experimental stations and expert
opinion enabled a variety of qualitative and quan-titative comparisons. Simulated phenology from the spatial model agreed well with these reported val-ues across a variety of scales from point observations to country-averaged statistics. More importantly, the model was able to capture the correct spatial pattern of winter wheat development across Europe. Predictions from the broad-scale model were further tested using cross-comparisons with results from site-based mod-els and sensitivity analyses. Results showed that the model was able to emulate a similar spatial and tem-poral variability in phenological development to sev-eral site-based mechanistic models. In addition, model simulations in response to changes in climate outside the range currently experienced were robust.
The sensitivity of broad-scale wheat development to changes in the mean and variability of temperature showed that incremental increases in mean tempera-ture result in a progressive expansion of the area of suitability and an increase in the rate of development. The majority of the shortening in the length of the growing period is experienced between the stages of emergence and double ridges. The shift in the timing of subsequent development stages to earlier in the sea-son means that changes in their duration are relatively minor. Winter wheat development is more sensitive to increases in temperature in northern Europe than southern Europe, resulting in a more uniform timing of maturity dates across Europe than is observed for the current climate. Changes in inter-annual temper-ature variability result in only small changes in the mean date of development stages, but their standard deviation increases dramatically with a doubling in variability and decreases moderately with a halving of variability. The possibility of crop damage via a combination of extreme hot and cold events and more variable phenological timing would be increased by greater temperature variability.
fertilisation effects). Studies which have examined the impacts of various climate change scenarios on wheat yields in Europe suggest that these negative effects of higher temperatures on reducing the grain filling pe-riod are clearly outweighed by the beneficial effects of elevated CO2, resulting in moderate to large increases in yield under non water-stressed conditions (Harrison and Butterfield, 1996; Semenov et al., 1996; Olesen et al., 1999; Hulme et al., 1999).
Acknowledgements
The authors would like to acknowledge the fol-lowing institutions and individuals for the provision of climate data: United Kingdom Meteorological Of-fice, Finnish Meteorological OfOf-fice, Institut National de la Recherche Agronomique, Ana Iglesias, Theodore Karacostas, Zsolt Harnos, Joost Wolf, Jørgen Ole-sen and Marco Bindi. Thanks are also due to Elaine Barrow and Mikhail Semenov for provision of the LARS-WG output. Calibration data for cultivar Alcala were also provided by Mikhail Semenov. The sup-port of colleagues at the Environmental Change Insti-tute is acknowledged, specifically John Orr for GIS assistance and Ruth Butterfield for helpful sugges-tions. This work was funded by the European Commis-sion’s Environment Programme under two sequential contracts: the CLAIRE project (EV5V-CT93-0294) and the CLIVARA project (ENV4-CT95-0154). PAH thanks the support of the British Council which funded travel to New Zealand under the Higher Education Links Scheme, providing the opportunity for this re-search to be completed. JRP thanks the Danish Re-search Council for support.
References
Arnell, N.W., 1998. The effect of climate change on hydrological regimes in Europe: a continental perspective. Global Environ. Change 9 (1), 5–23.
Barrow, E.M., Hulme, M., 1996. Changing probabilities of daily temperature extremes in the UK related to future global warming and changes in climate variability. Climate Res. 6, 21–31.
Bindi, M., Fibbi, L., 1999. Modelling climate change impacts at the site scale on grapevine. In: Downing, T.E., Harrison, P.A., Butterfield R.E., Lonsdale K.G. (Eds.), Climate Change, Climatic Variability and Agriculture in Europe: An Integrated
Assessment. Research Report No. 21, Environmental Change Unit, University of Oxford, Oxford, pp. 117–134.
Bindi, M., Fibbi, L., Maselli, F., Miglietta, F., 1999. Modelling climate change impacts on grapevine in Tuscany. In: Downing, T.E., Harrison, P.A., Butterfield, R.E., Lonsdale, K.G. (Eds.), Climate Change, Climatic Variability and Agriculture in Europe: An Integrated Assessment. Research Report No. 21, Environmental Change Unit, University of Oxford, Oxford, pp. 191–216.
Brignall, A.P., Rounsevell, M.D.A., 1995. Land evaluation modelling to assess the effects of climate change on winter wheat potential in England and Wales. J. Agric. Sci., Camb. 124, 159–172.
Brklacich, M., Curran, P., Brunt, D., 1996. The application of agricultural land rating and crop models to CO2 and climate
change issues in northern regions: the Mackenzie Basin case study. Agric. Food Sci., Finland 5, 351–365.
Broekhuizen, S., 1965. Agroecological Atlas of Cereal Growing in Europe Vol. II. Atlas of the Cereal Growing Areas in Europe. PUDOC, Wageningen.
Brooks, C.E.P., 1943. Interpolation tables for daily values of meteorological elements. Q. J. R. Meteorol. Soc. 69, 160–162. Bunting, A.H., Dennett, M.D., Elston, J., Speed, C.B., 1982. Climate and crop distribution. In: Blaxter, K., Fowden, L. (Eds.), Food, Nutrition and Climate. Applied Science Publishers, London, pp. 43–74.
Butterfield, R.E., Morison, J.I.L., 1992. Modelling the impact of climatic warming on winter cereal development. Agric. For. Meteorol. 62, 241–261.
Butterfield, R.E., Harrison, P.A., Orr, J.L., Gawith, M.J., Lonsdale, K.G., 1999. Modelling climate change impacts on wheat, potato and grapevine in Great Britain. In: Downing, T.E., Harrison, P.A., Butterfield, R.E., Lonsdale, K.G. (Eds.), Climate Change, Climatic Variability and Agriculture in Europe: An Integrated Assessment. Research Report No. 21, Environmental Change Unit, University of Oxford, Oxford, pp. 265–286.
Carter, T.R., Saarikko, R.A., 1996. Estimating regional crop potential in Finland under a changing climate. Agric. For. Meteorol. 79, 301–313.
Carter, T.R., Parry, M.L., Porter, J.H., 1991. Climatic change and future agroclimatic potential in Europe. Int. J. Climatol. 11, 251–269.
Carter, T.R., Parry, M.L., Harasawa, H., Nishioka, S., 1994. IPCC Technical Guidelines for Assessing Climate Change Impacts and Adaptations. Working Group II of the Intergovernmental Panel on Climate Change, Department of Geography, University College London and Center for Global Environmental Research, National Institute for Environmental Studies, Tsukuba. Carter, T.R., Saarikko, R.A., Joukainen, S.K.H., 1999. Modelling
climate change impacts on wheat and potato in Finland. In: Downing, T.E., Harrison, P.A., Butterfield, R.E., Lonsdale, K.G. (Eds.), Climate Change, Climatic Variability and Agriculture in Europe: An Integrated Assessment. Research Report No. 21, Environmental Change Unit, University of Oxford, Oxford, UK, pp. 287–310.
Crofts, H.J., 1989. On defining a winter wheat. Euphytica 44, 225–234.
Delécolle, R., 1999. Modelling climate change impacts on winter wheat in the Paris Basin. In: Downing, T.E., Harrison, P.A., Butterfield, R.E., Lonsdale K.G. (Eds.), Climate Change, Climatic Variability and Agriculture in Europe: An Integrated Assessment. Research Report No. 21, Environmental Change Unit, University of Oxford, Oxford, UK, pp. 179–189. Delécolle, R., Hay, R.K.M., Guerif, M., Pluchard, P.,
Varlet-Grancher, C., 1989. A method of describing the progress of apical development in wheat, based on the time-course of organogenesis. Field Crops Res. 21, 147–160.
Dickinson, R.E., Meleshko, V., Randall, D., Sarachik, E., Silva-Dias, P., Slingo, A., 1996. Climate processes. In: Houghton, J.T., Meira Filho, L.G., Callander, B.A., Harris, N., Kattenberg, A., Maskell, K. (Eds.), Climate Change 1995: The Science of Climate Change. Cambridge University Press, Cambridge, pp. 193–227.
Downing, T.E., Harrison, P.A., Butterfield, R.E., Lonsdale, K.G. (Eds.), 1999. Climate Change, Climatic Variability and Agriculture in Europe: An Integrated Assessment. Research Report No. 21, Environmental Change Unit, University of Oxford, Oxford.
Easterling, W.E., Crosson, P.R., Rosenberg, N.J., McKenney, M.S., Katz, L.A., Lemon, K.M., 1993. Agricultural impacts of and responses to climate change in the Missouri-Iowa-Nebraska-Kansas (MINK) region. Climatic Change 24, 23–61.
Easterling, W.E., Weiss, A., Hays, C.J., Mearn, L.O., 1998. Spatial scales of climate information for simulating wheat and maize productivity: the case of the US Great Plains. Agric. For. Meteorol. 90, 51–63.
Groot, J.J.R., 1993. NWHEAT; Nitrogen balance in a system of winter wheat and soil. In: Engel, T., Klöcking, B., Priesack, E., Schaaf, T. (Eds.). Simulationsmodelle zur Stickstoffdynamik, Analyse und Vergleich. Agrarinformatik, Band 25, Ulmer, Stuttgart, pp. 397–411.
Harrison, P.A., Butterfield, R.E., 1996. Effects of climate change on Europe-wide winter wheat and sunflower productivity. Climate Res. 7 (3), 225–241.
Harrison, P.A., Butterfield, R.E., Orr, J.L., 1999. Modelling climate change impacts on wheat, potato and grapevine in Europe. In: Downing, T.E., Harrison, P.A., Butterfield, R.E., Lonsdale, K.G. (Eds.), Climate Change, Climatic Variability and Agriculture in Europe: An Integrated Assessment. Research Report No. 21, Environmental Change Unit, University of Oxford, Oxford, pp. 365–388.
Hough, M.N., 1990. Agrometeorological Aspects of Crops in the United Kingdom and Ireland: A Review of Sugar Beet, Oilseed Rape, Peas, Wheat, Barley, Oats, Potatoes, Apples and Pears. Publication EUR 13039 EN of the Office for Official Publications of the European Communities, Series ‘Agriculture’, Luxembourg.
Hulme, M., Conway, D., Jones, P.D., Jiang, T., Barrow, E.M., Turney, C., 1995. Construction of a 1961–1990 European climatology for climate change modelling and impact applications. Int. J. Climatol. 15, 1333–1363.
Hulme, M., Barrow, E.M., Arnell, N.W., Harrison, P.A., Johns, T.C., Downing, T.E., 1999. Relative impacts of human-induced climate change and natural climate variability. Nature 397, 688– 691.
IPCC, 1996. Climate Change 1995. The Science of Climate Change. Summary for Policymakers and Technical Summary of the Working Group I Report. The Meteorol. Office Graphics Studio 95/869, Bracknell.
Jamieson, P.D., Semenov, M.A., Brooking, I.R., Francis, G.S., 1998. Sirius: a mechanistic model of wheat response to environmental variation. Eur. J. Agron. 8, 161–179.
Kenny, G.J., Harrison, P.A., 1992. Thermal and moisture limits of grain maize in Europe: model testing and sensitivity to climate change. Climate Res. 2, 113–129.
Kirby, E.J.M., Appleyard, M., Fellows, G., 1985. Effect of sowing date and variety on main shoot leaf emergence and number of leaves of barley and wheat. Agronomie 5, 117–126. Kirkby, M.J., 1998. Modelling across scales: the MEDALUS
family of models. In: Boardman, J., Favis-Mortlock, D.T. (Eds.), Modelling Soil Erosion by Water. Springer NATO ASI Series I-55, Berlin, pp. 161–174.
Kocabas, Z., Mitchell, R.A.C., Craigon, J., Perry, J.N., 1993. Sensitivity analyses of the ARCWHEAT1 crop model: the effect of changes in radiation and temperature. J. Agric. Sci., Camb. 120, 149–158.
Koster, R.D., Suarez, M.J., 1994. The components of a SVAT scheme and their effects on a GCM’s hydrological cycle. Adv. Water Res. 17, 61–78.
Landau, S., Mitchell, R.A.C., Barnett, V., Colls, J.J., Craignon, J., Moore, K.L., Payne, R.W., 1997. Testing winter wheat simulation models’ predictions against observed UK grain yields. Agric. For. Meteorol. 89, 85–99.
Masle, J., Doussinault, G., Farquhar, G.D., Sun, B., 1989. Foliar stage in wheat correlates better to photothermal time than to thermal time. Plant, Cell and Environ. 12, 235–247. Mearns, L.O., Rosenzweig, C., Goldberg, R., 1992. Effect of
changes in interannual climatic variability on CERES-Wheat yields: sensitivity and 2 × CO2 general circulation model
studies. Agric. For. Meteorol. 62, 159–189.
Miglietta, F., 1991. Simulation of wheat ontogenesis II. Predicting dates of ear emergence and main stem final leaf number. Climate Res. 1, 151–160.
Miglietta, F., Porter, J.R., 1992. The effects of climatic change on development in wheat: analysis and modelling. J. Exp. Bot. 43 (253), 1147–1158.
Moot, D.J., Henderson, A.L., Porter, J.R., Semenov, M.A., 1996. Temperature, CO2 and the growth and development of wheat:
changes in the mean and variability of growing conditions. Climatic Change 33, 351–368.
Mukula, J., Rantanen, O., 1989. Climatic risks to the yield and quality of field crops in Finland IV. Winter wheat 1969–1986. Annaes Agriculturae Fenniae 28, 13–19.
Murphy, D.P.L., Frost, D.L., Evans, E.J., 1993. Plant development and grain yield in winter wheat as influenced by sowing and variety. Aspects Appl. Biol. 34, 99–104.
Review of Durum Wheat, Barley, Maize, Rice, Sugarbeet, Sunflower, Soybean, Rape, Potato, Tobacco, Cotton, Olive and Grape. Publication EUR 14124 of the Office for Official Publications of the European Communities, Luxembourg. Nonhebel, S., 1993. The Importance of Weather Data in Crop
Growth Simulation Models and Assessment of Climatic Change Effects. Proefschrift, Agricultural University, Wageningen. Olesen, J.E., Jensen, T., Bøcher, P.K., 1999. Modelling climate
change impacts on wheat and potato in Denmark. In: Downing, T.E., Harrison, P.A., Butterfield R.E., Lonsdale, K.G. (Eds.), Climate Change, Climatic Variability and Agriculture in Europe: An Integrated Assessment. Research Report No. 21, Environmental Change Unit, University of Oxford, Oxford, pp. 311–330.
Porter, J.R., 1993. AFRCWHEAT2: a model of the growth and development of wheat incorporating responses to water and nitrogen. Eur. J. Agron. 2, 69–82.
Porter, J.R., Kirby, E.J.M., Day, W., Adam, J.S., Appleyard, M., Ayling, S., Baker, C.K., Beale, P., Belford, R.K., Biscoe, P.V., Chapman, A., Fuller, M.P., Hampson, J., Hay, R.K.M., Hough, M.N., Matthews, S., Thompson, W.J., Weir, A.H., Willington, V.B.A., Wood, D.W., 1987. An analysis of morphological development stages in Avalon winter wheat crops with different sowing dates and at ten sites in England and Scotland. J. Agric. Sci., Camb. 109, 107–121.
Racsko, P., Szeidl, L., Semenov, M., 1991. A serial approach to local stochastic weather models. Ecol. Modelling 57, 27–41. Reinink, K., Jorritsma, I., Darwinkel, A., 1986. Adaptation of the
AFRC wheat phenology model for Dutch conditions. Neth. J. Agric. Sci. 34, 1–13.
Richardson, C.W., Wright, D.A., 1984. WGEN: A Model for Generating Daily Weather Variables. US Department of Agriculture, Agricultural Research Service, ARS-8, USDA, Washington DC.
Richardson, C.W., Nicks, A.D., 1990. Weather generator description. In: Sharpley, A.N., Williams, J.R. (Eds.), EPIC — Erosion/productivity impact calculator 1. Model documentation. US Department of Agriculture, Washington DC, pp. 93–103. Rosenzweig, C., Parry, M.L., 1994. Potential impact of climate
change on world food supply. Nature 367, 133–138. Rounsevell, M.D.A., Loveland, P.J., Mayr, T.R., Armstrong,
A.C., de la Rosa, D., Legros, J-P., Simota, C., Sobczuk, H., 1996. ACCESS: a spatially-distributed. soil water and crop development model for climate change research. Aspects Appl. Biol. 45, 85–91.
Russell, G., Wilson, G.W., 1994. An Agro-pedo-climatological Knowledge-base of Wheat in Europe. Publication EUR 15789 EN of the Office for Official Publications of the European Communities, Series ‘Agriculture’, Luxembourg.
Russell, G., van Gardingen, P.R., 1997. Problems with using crop models to predict regional crop production. In: van Gardingen, P.R., Foody, G.M., Curran, P.J. (Eds.), Scaling-up: From Cell to Landscape. Cambridge University Press, Cambridge, pp. 273–294.
Semenov, M.A., Porter, J.R., 1995. Climatic variability and the modelling of crop yields. Agric. For. Meteorol. 73, 265– 283.
Semenov, M.A., Barrow, E.M., 1997. Use of a stochastic weather generator in the development of climate change scenarios. Climatic Change 35, 397–414.
Semenov, M.A., Porter, J.R., Delécolle, R., 1993. Simulation of the effects of climate change on growth and development of wheat in the UK and France. In: Kenny, G.J., Harrison, P.A., Parry, M.L. (Eds.), The Effect of Climate Change on Agricultural and Horticultural Potential in Europe. Research Report No. 2, Environmental Change Unit, University of Oxford, Oxford, pp. 121–136.
Semenov, M.A., Wolf, J., Evans, L.G., Eckersten, H., Iglesias, A., 1996. Comparison of wheat simulation models under climate change II. Application of climate change scenarios. Climate Res. 7 (3), 271–281.
Thompson, W.J., Stokes, D.T., 1985. Cereal apex development stages in relation to crop management. Aspects Appl. Biol. 10, 415–429.
Travis, K.Z., Day, W., Porter, J.R., 1988. Modelling the timing of early development of winter wheat. Agric. For. Meteorol. 44, 67–79.
van Gardingen, P.R., Foody, G.M., Curran, P.J. (Eds.), 1997. Scaling-up: From Cell to Landscape. Cambridge University Press, Cambridge.
Weir, A.H., Bragg, P.L., Porter, J.R., Rayner, J.H., 1984. A winter wheat crop simulation model without water or nutrient limitations. J. Agric. Sci., Camb. 102, 371–382.
Wolf, J., 1993. Effects of climate change on wheat and maize production potential in the EC. In: Kenny, G.J., Harrison, P.A., Parry, M.L. (Eds.), The Effect of Climate Change on Agricultural and Horticultural Potential in Europe. Research Report No. 2, Environmental Change Unit, University of Oxford, Oxford, pp. 93–120.
Wolf, J., 1999. Modelling climate change impacts at the site scale on soya bean. In: Downing, T.E., Harrison, P.A., Butterfield, R.E., Lonsdale, K.G. (Eds.), Climate Change, Climatic Variability and Agriculture in Europe: An Integrated Assessment. Research Report No. 21, Environmental Change Unit, University of Oxford, Oxford, pp. 103– 116.
Wolf, J., Semenov, M.A., Eckersten, H., Evans, L.G., Iglesias, A., Porter, J.R., 1995. Modelling the effects of climate change and climatic variability on crops at the site scale — effects on winter wheat: a comparison of five models. In: Harrison, P.A., Butterfield, R.E., Downing, T.E. (Eds.), Climate Change and Agriculture in Europe: Assessment of Impacts and Adaptation. Research Report No. 9, Environmental Change Unit, University of Oxford, Oxford, pp. 231–280.