AN INVESTIGATION OF AUTOMATIC CHANGE DETECTION FOR
TOPOGRAPHIC MAP UPDATING
Patricia Duncan1 & Julian Smit2
1The Chief Directorate: National Geospatial Information, Department of Rural Development and Land Reform, Cape Town,
South Africa
Geomatics Division, School of Architecture, Planning & Geomatics, University of Cape Town, Cape Town, South Africa [email protected]
KEY WORDS: Mapping, Change Detection, Classification, Pixel, Object
ABSTRACT
Changes to the landscape are constantly occurring and it is essential for geospatial and mapping organisations that these changes are regularly detected and captured, so that map databases can be updated to reflect the current status of the landscape. The Chief Directorate of National Geospatial Information (CD: NGI), South Africa’s national mapping agency, currently relies on manual methods of detecting changes and capturing these changes. These manual methods are time consuming and labour intensive, and rely on the skills and interpretation of the operator. It is therefore necessary to move towards more automated methods in the production process at CD: NGI. The aim of this research is to do an investigation into a methodology for automatic or semi-automatic change detection for the purpose of updating topographic databases. The method investigated for detecting changes is through image classification as well as spatial analysis and is focussed on urban landscapes. The major data input into this study is high resolution aerial imagery and existing topographic vector data. Initial results indicate the traditional pixel-based image classification approaches are unsatisfactory for large scale land-use mapping and that object-orientated approaches hold more promise. Even in the instance of object-oriented image classification generalization of techniques on a broad-scale has provided inconsistent results. A solution may lie with a hybrid approach of pixel and object-oriented techniques.
INTRODUCTION
The Chief Directorate of National Geo-spatial Information (CD: NGI), South Africa’s national mapping agency, is responsible for the official, definitive, national topographic mapping, aerial imagery and control survey network of South Africa. One of the responsibilities of the CD: NGI is the capturing and revision of topographical data into the national integrated database of geo-spatial information. The process of detecting changes to the landscape and updating CD: NGI’s topographic database is currently performed manually, which is time consuming and relies on the knowledge and interpretation of the operator.
The focus of this research is on updating topographic data for urban built-up areas, as these areas can change rapidly. An automated method of detecting changes to these areas is needed so that the topographic database can be updated regularly. The proposed method of detecting change is through image classification. In this paper we will compare various methods of image classification for the purpose of updating topographic databases. The change detection part of the research will come at a later stage once the most appropriate method of image classification has been decided on. It is envisaged that changes will be detected by comparing the
newly classified data with the existing topographic vector data.
The imagery used in this study is 0.5m resolution aerial imagery. Available image bands are red, green, blue and near-infrared. Existing vector data representing topographical features is the basis for measuring and comparing changes that are detected.
UPDATING TOPOGRAPHIC DATABASES THROUGH IMAGE CLASSIFICATION
PIXEL-BASED CLASSIFICATION
Supervised classification
the settlement class are classified as other features such as forest or agricultural areas, due to the high resolution of the imagery and wide variety of building roof spectral properties. When tested with lower resolution imagery, settlements are recognised as uniform but the accuracy of the results deteriorates.
Classes must be decided on beforehand and adequate samples that represent the classes must be collected. For most super classes there will be subclasses for a feature due to the spectral variation within classes. For example, many samples of the class ‘water’ were collected as subclasses and merged to make the final water class. A further challenge lies in the fact that a class may consist of various land cover types which are spectrally diverse, but need to be grouped together. Such an example is the urban built-up class which may consist of buildings, gardens (vegetation), swimming pools and bare ground. One may consider classifying buildings separately, but this decision is influenced by the purpose of the classification, and in this case the built-up area was required. Even individual buildings can have a multitude of different land cover types and colours; for example, roof tiles, thatch, metal sheeting, etc. are all spectrally diverse.
In this example the maximum likelihood classification method was tested. Final classes consisted of water, vegetation, road, built-up and bare ground or sand.
Figure 1: Subset of aerial image used in all classification methods tested
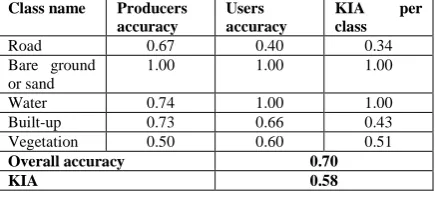
Class name Producers accuracy
Overall accuracy 0.70
KIA 0.58
Table 1: Accuracy assessment and kappa statistics for pixel-based supervised method (Maximum Likelihood Classification)
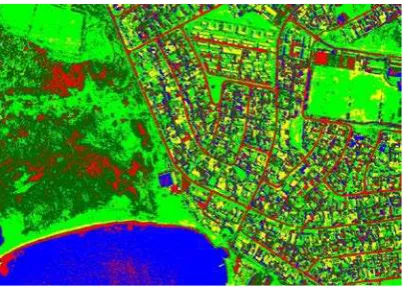
Figure 2: Results of supervised classification – maximum likelihood classification
The classification results indicate that there is overlap between the road and the built-up classes due to their spectral similarity. Some buildings were also incorrectly classified as bare ground or sand and some vegetation was incorrectly classified as roads and built-up areas.
Unsupervised classification
In unsupervised classification, pixel values within a certain land cover type should be close together in the measurement (spectral) space, whereas data in different classes should be reasonably well separated. The classes that result from unsupervised classification are spectral classes (Lillesand et al. 2004).
The unsupervised ISODATA method is popular in the classification of heterogeneous high resolution images as it is very successful in finding the spectral clusters that are inherent in images (Zhang 2001). Unsupervised classification may address some of the shortcomings of applying supervised classification for land use or land cover classification where classes have a high degree of spectral variability. Where there is a high degree of spectral variability, suitable training sites for relevant land use or land cover classes will always be difficult to achieve.
The unsupervised approach is simple and no training data or samples are needed, thus making it much faster to implement than the supervised approach. Another advantage is that the unsupervised classifier identifies the different spectral classes present in an image, which might not be obvious to an analyst applying a supervised classifier. Similarly, there may be so many spectral classes in a scene that it would be difficult to train on all of them. Since unsupervised classification is the identification of spectrally distinct classes in an image, the analyst must still use reference data to associate spectral classes with the land cover types of interest. The spectral classes identified may not be uniquely associated with a land cover type, and one may have several spectral classes representing a single feature class (Lillesand et al. 2004).
unsupervised method was based on a visual inspection. Where there are many classes, there is the problem of a class being split into more than one class due to the spectral differences within a class. Where there are only a few classes, there is the problem of unrelated classes being classified as the same class.
Figure 3: Results of unsupervised classification – ISODATA method – 12 classes
Figure 4: Results of unsupervised classification – ISODATA method – 5 classes
It is thus concluded that the pixel-based approach is not acceptable for classifying complex urban environments with very high resolution remote sensing data. The reasons for this are as follows (Hurskainen & Pellikka 2004):
● Pixels do not sample the urban environment at the spatial scale to be mapped
● Building are represented by groups of pixels which should be treated as individual objects
● Buildings produce a wide range of spectral signatures
● Many features in the urban environment appear spectrally similar
OBJECT-BASED CLASSIFICATION
The limitation of the pixel in tackling issues of location, scale and distance has caused a shift towards object-based classification (De Dapper et al. 2006). Even though traditional pixel-based classifiers are well developed and there are sophisticated variations, they do not make use of available spatial concepts. The need for
context-based algorithms and object-oriented image processing is increasing and it is hypothesized that object-based image analysis will initiate new developments towards integrating GIS and remote sensing functions (Blaschke et al. 2000).
The software used for object-based classification in this study is eCognition. A necessary prerequisite for object-based image classification is image segmentation. The shape of segments derived in eCognition is determined by the following parameters (Hofmann 2001):
• Weight of image channels: specify the weight of each spectral band in the segmentation. Channels with higher weights have a greater influence on object generation.
• Scale parameter: influences the average object size. This parameter determines the maximum allowed heterogeneity of the objects. The larger the scale parameter, the larger the objects become.
• Colour/Shape: the influence of colour vs. shape can be adjusted. The higher the shape value, the less spectral homogeneity influences the object generation.
• Smoothness/Compactness: These are attributes of the “shape” criterion. If the shape criterion is larger than 0, the user can determine whether objects shall be more compact or more smooth.
• Level: determines whether a new generated image level will either overwrite a current level or whether the generated objects shall contain sub or super objects of an existing level. The order of generating the levels affects the objects’ shape (top-down vs. bottom-up segmentation).
Using spectral information for image segmentation
In the first strategy, the image was segmented using the multiresolution segmentation algorithm in eCognition. All four image layers (red, green, blue and NIR) were used with equal weighing in the segmentation process. The size of segments was decided on by trial and error. Smaller segments were merged to create larger segments that consisted of built-up areas as opposed to individual buildings. These built-up areas consisted of residential buildings, gardens, roads, etc. It was difficult to obtain suitable segments using only spectral information. The segments were not uniform in shape and size, and some contained a mixture of classes that was not ideal. Some segments appeared homogenous in nature, but did not logically represent features in an image.
Figure 5a: Image segmentation (Level 2, scale: 100)
Figure 5b: Image segmentation (Level 1, scale: 50)
Figure 5c: Image segmentation (Level 1, scale: 100)
The classes created were built-up area, road (for identifying the larger roads that were not included in the built-up area), bare ground or sand, vegetation and water. Samples were selected for each class, and the image was classified using the Nearest Neighbour (NN) method. A large scale parameter was chosen for classifying the image in order to adequately represent the large built-up areas. The following features were used in the NN
classification: mean values for red, green, blue and near infrared, brightness, maximum difference, compactness, length, length/width, HSI transformation, NDVI, GLCM mean (quick 8/11) (all dir.) and GLDV Ang. 2nd moment mean (quick 8/11) (all dir.).
Figure 6: Object-based classification using the Nearest Neighbour method
The classification results indicate that there is some confusion between certain classes, particularly where there are segments that contain more than one feature. This is a typical problem where large segments contain more than one feature class. On the contrary, smaller segments may represent individual features more easily, but the spectral differences within classes may result in the user having numerous sub-classes for features.
Class name Producers accuracy
Users accuracy
KIA per class
Built-up 0.57 0.80 0.48 Road 1.00 1.00 1.00 Vegetation 0.71 0.56 0.59 Water 1.00 1.00 1.00 Bare ground or
sand
0.50 0.50 0.46
Overall accuracy 0.79
KIA 0.73
Table 2: Accuracy assessment and kappa statistics for object-based classification (segments based on only spectral information)
Using vector data and spectral information for segmentation
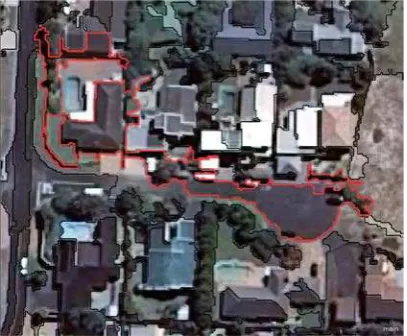
Figure 7: Segmentation based on cadastral parcels
After the initial segmentation, a second segmentation was performed within the boundaries of the cadastral segments. These resulting smaller segments were then classified using the nearest neighbour approach. Samples were selected and the following features were used in the NN classification: mean values for red, green, blue and near infrared, brightness, maximum difference and NDVI.
Figure 8: Segmentation within cadastral parcels
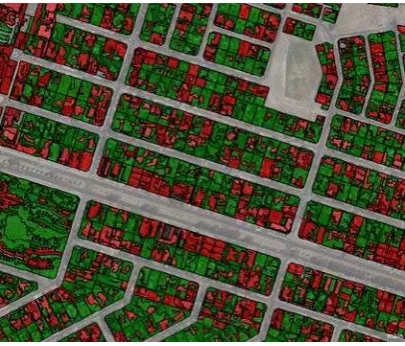
Figure 9: Object-based classification using the Nearest Neighbour method (initial segments derived from thematic information)
Class name Producers accuracy
Users accuracy
KIA per class
Building 0.94 0.89 0.90 Vegetation 0.91 0.87 0.81 Water 0.60 1.00 0.57
Overall accuracy 0.89
KIA 0.80
Table 3: Accuracy assessment and kappa statistics for object-based classification (segments initially based on thematic information)
For this example only buildings, vegetation and water were classified and the areas between the cadastral blocks, for example large roads, were masked out of the classification (see Figure 9).
DISCUSSION
It is necessary to move away from dependency on individual pixel values into a way of incorporating shape, texture and contextual information for image classification (Hurskainen & Pellikka 2004).
Segmentation is a very important step in object-based classification. In order to have a successful classification, one must have suitable segments that accurately represent features of interest. Segmentation based purely on spectral information did not result in suitable segments. The inclusion of thematic or vector data for the initial segmentation in the object-based classification resulted in an improvement in overall accuracy when compared with the method that was based only on spectral information.
It should be noted that the selection of evaluation or check sites has a large influence on the accuracy results reported. All check sites were randomly selected and were not part of the classification training sites. Since the accuracy assessments are always based on a sample of the classified scene, it is difficult to get a ‘true’ accuracy assessment.
CONCLUSIONS
The object-based classification methods show much promise and results in better classification accuracy than the pixel-based methods that were tested. The inclusion of thematic data in the segmentation stage can be used to force suitable boundaries that can be further segmented and thus improve classification results.
REFERENCES
Blaschke, T. et al., 2000. Object-oriented image processing in an integrated GIS/remote sensing environment and perspectives for environmental applications. Environmental information for planning, politics and the public, 2, pp.555–570.
De Dapper, M., Gamanya, R. & De Maeyer, P., 2006. PRECISON CHANGE DETECTION: BASED ON KNOWLEDGE-BASED AND OBJECT-ORIENTED SATELLITE IMAGE ANALYSIS IN CENTRAL ZIMBABWE. In American Society
for Photogrammetry and Remote Sensing (ASPRS).
Hofmann, P., 2001. Detecting urban features from IKONOS data using an object-oriented approach. In First Annual Conference of the Remote Sensing
& Photogrammetry Society, 12-14 September 2001. Munich, Germany, pp. 79-91.
Hurskainen, P. & Pellikka, P., 2004. Change detection of informal settlements using multi-temporal aerial photographs: the case of Voi, SE Kenya. In
Proceedings of the 5th AARSE conference (African Association of Remote Sensing of the Environment). pp. 17-22.
Lillesand, T.M., Kiefer, R.W. & Chipman, J.W., 2004.
Remote Sensing and Image Interpretation 5th ed.,
Wiley and Sons.
Walter, V. & Fritsch, D., 1998. Automatic verification of GIS data using high resolution multispectral data.
International Archives of Photogrammetry and Remote Sensing, XXXII(Part 3/1), pp.485 - 489.
Zhang, Y., 2001. Texture-Integrated Classification of Urban Treed Areas in High-Resolution Color-Infrared Imagery. Photogrammetric Engineering