ORTHO-RECTIFICATION OF NARROW BAND MULTI-SPECTRAL IMAGERY
ASSISTED BY DSLR RGB IMAGERY ACQUIRED BY A FIXED-WING UAS
Jiann-Yeou Rau1, Jyun-Ping Jhan2, Cho-ying Huang3
1 Department of Geomatics, National Cheng Kung University. No.1, Univeristy Rd., Tainan City, Taiwan - [email protected](Corresponding Author)
2 Department of Geomatics, National Cheng Kung University. No.1, Univeristy Rd., Tainan City, Taiwan - [email protected]
3 Department of Geography, National Taiwan University.No. 1, Sec. 4, Roosevelt Rd., Taipei City 10617, Taiwan -
ICWG I/Vb - UAV-g 2015
KEY WORDS: Ortho-rectification, Band-to-band registration, Projective transformation.
ABSTRACT:
Miniature Multiple Camera Array (MiniMCA-12) is a frame-based multilens/multispectral sensor composed of 12 lenses with narrow band filters. Due to its small size and light weight, it is suitable to mount on an Unmanned Aerial System (UAS) for acquiring high spectral, spatial and temporal resolution imagery used in various remote sensing applications. However, due to its wavelength range is only 10 nm that results in low image resolution and signal-to-noise ratio which are not suitable for image matching and digital surface model (DSM) generation. In the meantime, the spectral correlation among all 12 bands of MiniMCA images are low, it is difficult to perform tie-point matching and aerial triangulation at the same time. In this study, we thus propose the use of a DSLR camera to assist automatic aerial triangulation of 12 imagery and to produce higher spatial resolution DSM for MiniMCA-12 ortho-image generation. Depending on the maximum payload weight of the used UAS, these two kinds of sensors could be collected at the same time or individually. In this study, we adopt a fixed-wing UAS to carry a Canon EOS 5D Mark2 DSLR camera and a MiniMCA-12 multi-spectral camera. For the purpose to perform automatic aerial triangulation between a DSLR camera and the MiniMCA-12, we choose one master band from MiniMCA-12 whose spectral range has overlap with the DSLR camera. However, all lenses of MiniMCA-12 have different perspective centers and viewing angles, the original 12 channels have significant band misregistration effect. Thus, the first issue encountered is to reduce the band misregistration effect. Due to all 12 MiniMCA lenses being frame-based, their spatial offsets are smaller than 15 cm and all images are almost 98% overlapped, we thus propose a modified projective transformation (MPT) method together with two systematic error correction procedures to register all 12 bands of imagery on the same image space. It means that those 12 bands of images acquired at the same exposure time will have same interior orientation parameters (IOPs) and exterior orientation parameters (EOPs) after band-to-band registration (BBR). Thus, in the aerial triangulation stage, the master band of MiniMCA-12 was treated as a reference channel to link with DSLR RGB images. It means, all reference images from the master band of MiniMCA-12 and all RGB images were triangulated at the same time with same coordinate system of ground control points (GCP). Due to the spatial resolution of RGB images is higher than the MiniMCA-12, the GCP can be marked on the RGB images only even they cannot be recognized on the MiniMCA images. Furthermore, a one meter gridded digital surface model (DSM) is created by the RGB images and applied to the MiniMCA imagery for ortho-rectification. Quantitative error analyses show that the proposed BBR scheme can achieve 0.33 pixels of average misregistration residuals length and the co-registration errors among 12 MiniMCA ortho-images and between MiniMCA and Canon RGB ortho-images are all less than 0.6 pixels. The experimental results demonstrate that the proposed method is robust, reliable and accurate for future remote sensing applications.
1. INTRODUCTION
In photogrammetry and remote sensing, the purposes of integrating multilens for airborne imaging are (1) to expand the overall field of view (FOV) and increase the strength of imaging geometry for topographic mapping, such as Microsoft/Vexcel UltraCam (Gruber and Ladstädter, 2011; Ladstädter et al., 2010), ZI Imaging DMC (Zeitler et al., 2002), (2) to collect MS imagery for vegetation and water stress monitoring (Stagakis et al., 2012; Suárez et al., 2009; Turner et al., 2014), such as MiniMCA of Tetracam, and (3) to acquire both vertical and oblique imagery for 3D city modeling or point cloud classification (Frueh et al., 2004; Rau et al., 2015; Xiao et al., 2012), such as Microsoft/Vexcel Osprey, Leica Geosystems RCD30, Track air MIDAS, NCKU AMCIS, etc. The third case has no band
1 Corresponding Author
registration requirement, because the cameras’ footprints have very little or no overlap.
different focal lengths are corrected at the same time. This result in one sensor geometry for all 8 cameras captured at the same time. It means that the nine stitched PAN images and four MS images will have same IOPs but with different spatial resolution. After rigorous aerial triangulation tests, they achieved 1/8 to 1/10 pixel of overall image measurement RMS residuals (Gruber and Ladstädter, 2011).
Z/I Imaging also adopts four cameras for PAN images and four cameras for R, G, B, and NIR MS images. However, they acquire only eight images in total and the four PAN images are stitched as one to expand the overall FOV. In order to achieve one sensor geometry, all eight images are projected onto a virtual image plane (VIP) through projective transformation. The lens distortion and scale variations caused by different focal lengths are corrected as well. Here the tie-points were extracted from the overlapping areas of the four PAN images. They were transformed to the VIP according to the transformation parameters determined through a bundle block adjustment procedure. Then, they were stitched together as a single high-resolution PAN image. Tie-points were extracted between the PAN image and the four MS images individually. The MS images were also transformed to the VIP as same as the PAN image (Zeitler et al., 2002).
Tommaselli et al. (Tommaselli et al., 2013) generated a virtual image from two oblique cameras using projective transformation. Holtkamp & Goshtasby (Holtkamp and Goshtasby, 2009) created a virtual image from six cameras using projective transformation. The above two systems adopted similar concepts and procedures to UltraCam and DMC for virtual image generation and mosaicking, but the former additionally adopted relative orientation constraints during the camera self-calibration in order to achieve better accuracy (Tommaselli et al., 2013).
Please note that the above mentioned four methods are scene dependent. This means that the adopted transformation coefficients are different for all images acquired at different times. Particularly when the image content is texture-less, the estimated transformation coefficients may be marred by incorrect tie-point matching results.
MiniMCA is manufactured by Tetracam Inc., California, USA. It is a small size, frame-based, multilens/multispectral sensor. The number of lenses can be 4 (MiniMCA-4), 6 (MiniMCA-6) or 12 (MiniMCA-12) which cover spectral range from visible (450 nm) to NIR (950 nm). The overlap area among all cameras is greater than 98%. The original images of 12 MiniMCA bands cannot be aligned together, because all 12 cameras have different perspective centers and viewing angles. As depicted in Figure 1 (a), the band misregistration effect is significant which hampers remote sensing applications. To cope with this problem, Tetracam Inc. provides post image processing software, namely PixelWrench 2 (PW2), for image format conversion, vegetation index calculation, and BBR. The camera was calibrated in the laboratory before shipping. It includes a set of alignment parameters (i.e. 2D Helmert transformation coefficients) or it can be determined by manually measuring the conjugate lines between reference and target images. However, PW2 assumes all lenses have the same lens distortion effect and the used 2D Helmert transformation model does not fit the real phenomenon. Thus, its BBR results still contain significant band misregistration effects as shown in Figure 1 (b).
(a)Original Image (b) PW2 BBR
Figure 1. Band misregistration effect of the original imagery and PW2 BBR result (R: 750 nm, G: 550 nm, B: 450 nm)
In this study, based on photogrammetric collinearity equations we considered the relative mounting angles and spatial offsets (i.e. relative orientation parameters, ROPs) between cameras, various focal lengths and distortion effects of all lenses (i.e. IOPs) in order to convert them into a modified projective transformation (MPT) model for BBR. As a result, the MS image matching failure issue can be avoided, because image matching for finding transformation coefficients was replaced by camera calibration. Assuming the above mentioned parameters are stable, the calibration results can be applied to all images even acquired from different times or flights. Thus, the proposed BBR procedure is accurate, robust, reliable, and scene independent.
2. IMAGING SYSTEM & UAV
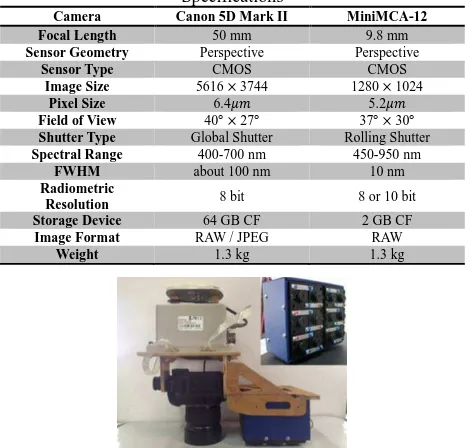
In this study, the imaging system is composed of a RGB DSLR camera, i.e. Canon 5D Mark II, and a frame-based MS camera, i.e. MiniMCA-12, in order to acquire both high resolution RGB images and lower resolution MS images simultaneously. The whole imaging system is also integrated with a POS system, i.e. SPAN CPT GPS/IMU, for recording the initial values of camera’s position and attitude used in aerial triangulation. Figure 2 shows the appearance of the proposed imaging and POS systems, where the spatial offset between Canon 5D Mark II and SPAN CPT IMU is less than 10 cm. The GPS receiver was set on top of the IMU and all units were fixed together using a wooden frame to reduce the total of payload weight. Table 1 summarized the specifications of the Canon 5D Mark II and MiniMCA-12 cameras.
Table 1. Canon 5D Mark II and MiniMCA-12 Specifications
Camera Canon 5D Mark II MiniMCA-12 Focal Length 50 mm 9.8 mm Sensor Geometry Perspective Perspective
Sensor Type CMOS CMOS
Image Size 5616 × 3744 1280 × 1024
Pixel Size 6.4�� 5.2��
Field of View 40° × 27° 37° × 30°
Shutter Type Global Shutter Rolling Shutter Spectral Range 400-700 nm 450-950 nm
FWHM about 100 nm 10 nm Radiometric
Resolution 8 bit 8 or 10 bit Storage Device 64 GB CF 2 GB CF Image Format RAW / JPEG RAW
Weight 1.3 kg 1.3 kg
2.1 Multispectral Camera
The adopted MiniMCA-12 is a camera array composed of twelve independent cameras each having a frame-based CMOS sensor with interchangeable optical filters. The image size is 1280 × 1024 with a pixel size of 5.2��. The focal length of all 12 lenses is about 9.8 mm, which has an FOV about 37° × 30°. The storage device of each camera is a 2 GB Compact Flash (CF) card that records images in a proprietary raw format with 8 or 10 bit dynamic range. Its weight is only 1.3 kg so it is suitable to be mounted on an UAS for remote sensing applications. In this study, we record 8 bit raw format in order to maximize the total number of images, i.e. about 1600.
Inset of figure 2 shows the perspective centers of all 12 cameras are different. Thus the acquired original images are not aligned together as demonstrated in Figure 1. To record multispectral information, each lens was equipped with a specific band pass filter with 10 nm bandwidth. The wavelength peaks are located at 450, 510, 530, 550, 570, 630, 650, 670, 700, 750, 780, and 950 nm. In this paper, they were named MCA-1, MCA-2, MCA-3, MCA-4 MCA-5, MCA-6, MCA-7, MCA-8, MCA-9, MCA-0, MCA-A, and MCA-B, respectively. The MCA-0 (750 nm) camera was chosen as the master camera and the image space of the other slave cameras were transferred to the master during the BBR.
2.2 RGB Camera
In contrast to the MiniMCA-12 camera, the Canon 5D Mark II only records visible (Red, Green, Blue) spectral response. It is a 36 mm × 24 mm full-frame CMOS sensor that has larger image resolution (5616 × 3744) and pixel size (6.4��) than the MiniMCA-12. The adopted lens has a fixed focal length of 50 mm, which has FOV 40° × 27° and has near 90% overlap area with the MiniMCA-12 in a single shot. However, the acquired RGB image has 4 times higher spatial resolution than the MS image. The image format could be RAW or JPEG format stored in a 64 GB CF card. In this study, we chose fine quality JPG format resulting in each image occupying about 18 MB storage space.
2.3 Unmanned Aerial System
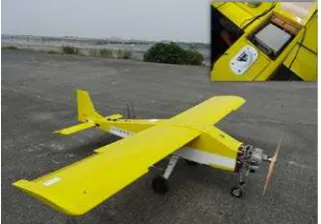
The AL-40 fixed wing UAS is designed and manufactured by Aeroland UAV Inc., Taiwan, which has 2 hours endurance time, 100 km operation distance and 15 kg payload. It is more than capable of carrying our imaging and POS systems which has a total weight of about 8 kg. An Automatic Image Control System (AICS) is integrated with an Ubox Lea-6 GPS receiver for estimating the travel distance and sending trigger events to both the imaging and POS systems. Using a pre-defined block-wise
flight plan piloted automatically, the UAS will acquire both RGB and MS images with similar overlap ratio and record the time tag at the same time. The appearance of the AL-40 and its specifications can be found in Figure 3 and Table 2, respectively.
Figure 3. Appearance of AL-40 UAS
Table 2. Specification of AL-40 UAS Wing Span Width 3 m; Length 2.4 m
Max. Take-off Weight 40 kg
Max. Payload 15 kg
Cruise Speed 110 km/hr.
Endurance Time 2 hr.
Max. Flying Height 5000 m
Operation Distance 100 km
3. METHODOLOGY
Two major issues are discussed in this study. The first one is the BBR of the MiniMCA-12 that contains camera calibration, modified projective transformation (MPT) and systematic errors correction. The second one is a suggested workflow for MiniMCA ortho-image rectification, where one band of MiniMCA-12 is selected for performing aerial triangulation together with the Canon RGB images and later ortho-rectifying all 12 bands MiniMCA images through a DSM generated by the Canon RGB images.
3.1 Camera Calibration
Camera calibration is adopted to estimate the IOPs for minimizing the misregistration effect and used in aerial triangulation. The indoor calibration field (Rau and Yeh, 2012) is a rotatable table containing 128 Australis© coded targets used as tie-points for self-calibration bundle adjustment with additional parameters (Fraser, 1997). The IOPs of all cameras and EOPs of each image can be calculated simultaneously.
In addition, the ROPs among all 12 cameras can be estimated from the EOPs of all images. By assigning one camera as master and the other cameras as slaves, the relative rotation angles (∆�,∆�,∆�) and offset vectors (��,��,��) can be calculated through the EOPs obtained from the camera calibration procedure. Due to the images of all twelve cameras acquired at the same time, the relative orientation calibration can be conducted through equations (1) and (2):
���
�� =�
������� (1)
���
��=�
���×�����− ����� (2)
The relative rotation angles were calculated from ���
�� that
denotes the rotation matrix between two cameras’ image coordinate systems under a local mapping frame M, where CM
and CS represent the master and slave cameras, respectively. The
offset vector (��,��,��) was derived from����� which depicts the
position vector between two cameras’ perspective centers. The ROPs are averaged through the multiple stations and their standard deviations are represented as the internal accuracies of calibration results.
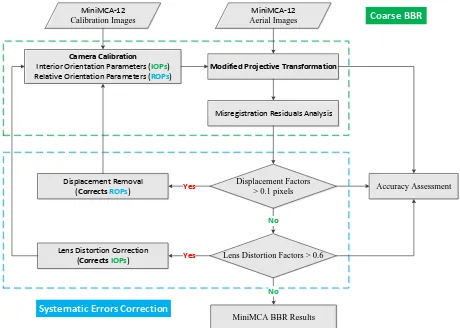
3.2 MiniMCA Band to Band Registration
factor and Lens distortion factor, are defined to evaluate any
existing systematic error phenomena and to correct these effects by improving the ROPs and IOPs for precise BBR.
As Figure 4 shows, the proposed method contains a coarse-to-fine workflow. One is the camera calibration and MPT for coarse BBR, while the other one is the systematic errors correction for fine registration. The details are described in the following sections.
Lens Distortion Factors > 0.6 No
No
Yes
Yes
Camera Calibration Interior Orientation Parameters (IOPs) Relative Orientation Parameters (ROPs)
Modified Projective Transformation
Figure 4. Workflow of the proposed MiniMCA BBR method
3.2.1 Modified Projective Transformation
Projective transformation is derived from collinearity
equations by assuming the object height is constant. Equations (3) and (4) are the mathematic models of projective transformation,
where (x, y) and (X, Y) are two different 2D coordinate systems:
�=�1�+�1�+�1
�3�+�3�+ 1 (3)
�=�2�+�2�+�2
�3�+�3�+ 1 (4)
These equations need at least four conjugate points to solve for the eight coefficients (�1~�3,�1~�3,�1,�2). However, image matching for narrow-band MS images may not find sufficient and well distributed conjugate points when the spectral range do not overlap. Therefore, a modified projective transformation (MPT) model is proposed and all required coefficients can be derived from IOPs and ROPs to avoid the image matching failure issue.
Equations (5) and (6) are the proposed mathematic model of MPT. They were inspired by the normalized stereo-image generation method suggested by Cho and Schenk (1992).
��=−���11
Four steps are conducted in the transformation procedure. First, the IOPs are applied to correct the lens distortion effect (∆�,∆�) in the slave image space. Then, we transfer the slave image space (��,��) into the master camera’s (MCA-0) image space (��,��) using the rotation matrix acquired from relative rotation angles of ROPs. Meanwhile, the scale difference is considered which were induced by different focal length values (��,��) between two cameras. The master camera’s focal length
�� is the average of all 12 camera’s focal lengths. Finally, the
slave images were shifted to the master camera’s perspective center by converting their spatial offsets into pixel values, i.e. the ratios of �� and �� over GSD in the x and y directions, respectively. Note the master camera is only required to correct the lens distortion effect and scale difference through MPT.
3.2.2 Misregistration Residuals Analysis
To evaluate and improve BBR, a feature point matching scheme was developed to measure the misregistration residuals (MRRs) between the master and the slave image by calculating the average MRRs length as a BBR accuracy index. The MRRs (dx, dy) are represented by the difference of the conjugate point’s image coordinates, which are detected by applying the FAST corner detector (Rosten et al., 2010) on the master image. Then the Normalized Cross Correlation (NCC) (Debella-Gilo and Kääb, 2011) area-based image matching method with polynomial interpolation is used to get sub-pixel coordinates on the slave image. The NCC template size is (35 pixels × 35 pixels), and a successful matching threshold of 0.95 is defined in order to obtain reliable results. A recursive blunder removal scheme is applied to remove possible matching errors. The mean and standard deviation of dx and dy are computed first. Then, any points with MRRs exceeding the mean ±3 times standard deviation are removed. The above blunder error removal procedure is iteratively processed until no more points are removed.
However, image matching may fail between two images when their spectral responses of the same object vary a lot. Thus, the MRRs analysis is conducted between two neighboring bands having the least spectral difference, i.e. MCA-B vs. MCA-A, MCA-A vs. MCA-0, MCA-0 vs. MCA-9, and so on.
3.2.3 Systematic Errors Correction
By means of MRRs analysis, we notice that there are certain systematic errors between two neighboring bands after MPT, which can be attributed to displacement and lens distortion effects related to inaccurate ROPs and IOPs.
3.2.4 Displacement Removal
The displacement factors (������,������) are the average of the MRRsin the x and y directions, respectively. They represent how much the slave camera’s image plane is displaced with respect to the center of the master camera’s image plane. MPT is based on the collinearity equations, which implies a small amount of displacement in x and y directions between two image planes is equivalent to the difference of the ∆� and ∆� angles, respectively. For the MiniMCA-12, the instantaneous FOV (IFOV) of one pixel is about 0.03°. Thus, if ������ is +0.1 pixels, the developed displacement removal scheme will modify the ROPs by adding the∆� angle with 0.003° to improve BBR accuracy. When the value of �������� or �������� is larger than 0.1 pixels, this scheme will be applied to eliminate displacement effect.
3.2.5 Lens Distortion Correction
The lens distortion factors |��̅��.��| and������.��� represent the absolute values of correlation coefficients between the absolute image coordinates with respect to the principle point (i.e.
3.2.6 Sequential BBR
Since the MRRs are estimated between two neighboring bands through serial image matching and the displacement value of the slave image must refer to the master camera (MCA-0) in order to update their ROPs, the final results are thus accumulated from the series of MMRs. For example, (������, ������)MCA-0 vs. MCA-8 is
the summation of (������, ������)MCA-0 vs. MCA-9 and (������, ������)MCA-9 vs.
MCA-8. Note that when the corrected IOPs and ROPs are obtained
through the above MRRs analysis, there is only one image interpolation needed during the BBR.
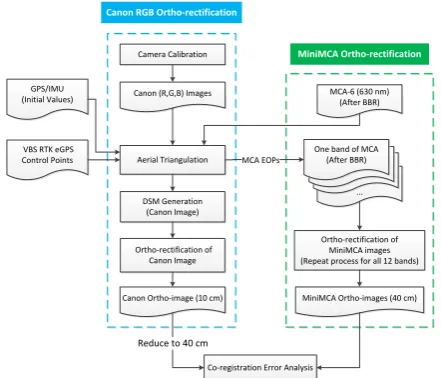
3.3 Ortho-Rectification Procedure
In the case where only MiniMCA images are available and the control points are recognizable, conventional aerial triangulation and ortho-image generation procedure can be used. However, due to its frame size and low image resolution of MiniMCA-12, if the UAS flight height is higher than 400 m, its spatial resolution will be lower than 20 cm. Then the size of control point needs to be larger than 60 cm in order to be recognized manually. In this study, the GSD of the MiniMCA-12 is about 42 cm but the size of control points is only 30 cm, thus it is not possible to measure these control points on MiniMCA images. Instead, the control points were measured only on the Canon RGB images.
For larger ground coverage of MiniMCA images acquisition, we use a high resolution DSLR camera to assist in aerial triangulation and DSM generation. The DSLR camera images can be acquired in another flight or even on different days as long as they mostly overlap and have similar weather conditions as the MiniMCA images.
Figure 5 is the procedure for ortho-image generation of MiniMCA-12 images together with Canon RGB images. The Canon RGB image also has lens distortion effect that has been calibrated through the indoor camera calibration process as mentioned in section 3.1. The automatic tie-point matching, control points measurement, aerial triangulation, dense image matching for DSM creation and ortho-image generation can be achieved using a digital photogrammetry workstation. In this study, we utilize Pix4dMapper© for these purposes.
Canon (R,G,B) Images (Repeat process for all 12 bands) MCA EOPs
Figure 5. Canon RGB and MiniMCA ortho-images rectification procedure
According to the relative monochromatic response of the CMOS sensor, we noticed that the peak of all 12 MiniMCA channels is located at the near-infrared channel (750 nm, MCA-0). This means that its image contrast among all 12 bands is the
highest (Kelcey and Lucieer, 2012) and suitable for feature points extraction and matching. However, there is no spectral overlap between the MCA-0 and Canon RGB images, so it fails on finding tie-points during aerial triangulation. Instead, the red channel, i.e. MCA-6 (630 nm), is chosen as the reference band, since it has the secondary highest relative monochromatic response to obtain the maximum number of well distributed tie-points with the Canon RGB images.
After aerial triangulation, the EOPs of all Canon RGB and MCA-6 images were obtained. A 1 m gridded DSM was generated by using only Canon RGB images, because its image quality and spatial resolution is higher than the MiniMCA-12. Since all 12 MiniMCA channels acquired at the same exposure time have been band-to-band registered, their IOPs and EOPs are all the same. Thus, we can apply the EOPs of the MCA-6 images to the other 11 channels for ortho-image generation. Here, the GSD of Canon RGB and MiniMCA ortho-images are 10 cm and 40 cm, respectively. The co-registration error analysis among 12 MiniMCA ortho-images and Canon RGB ortho-image are performed by the same procedure as the MRRs analysis mentioned in section 3.2.2. However, since the GSD of Canon RGB ortho-image is four times higher than the MiniMCA images, the NCC image matching will fail. Thus, before co-registration error analysis we reduce the GSD of the Canon RGB ortho-image into 40 cm.
4. RESULTS AND DISCUSSIONS
4.1 BBR Error Analysis of MiniMCA-12
A comprehensive analysis for the proposed MPT method for BBR of MiniMCA-12 including the MRRs correction results at each stage, the reliability examinations, and visual comparisons of the BBR results are evaluated at this section.
4.1.1 MRRs Correction at Each Stage
One BBR example between the MCA-5 and MCA-4 image planes is demonstrated in Figure 6. The displacement factors, lens distortion factors, and average MRRs length at each stage are summarized inTable 3.
The MRRs of the original image are demonstrated in Figure 6(a). It shows that the shapes of the MRRs look like a whirlpool which has an average MRRs length of 5.95 pixels, meaning that the original images have significant misregistration effect. Later, after applying the indoor calibrated ROPs and IOPs to the MPT, the average MRRs length is significantly decreased from 5.95 to 0.87 pixels. However, as shown in Figure 6(b), the plot still has certain systematic effects and in Table 3.
the values of displacement and lens distortion factors are higher than the predefined thresholds, i.e. 0.1 pixels and 0.6.
Next, we correct the ROPs by eliminating the displacement effect using another MPT process. The average MRRs length was reduced to 0.51 pixels and the displacement factors are both less than the threshold. However, from Figure 6(c) one still can observe the radial lens distortion effect and the lens distortion factors (0.87, 0.82) are still greater than the predefined threshold (0.6).
(a) MRRs of original images (b) MRRs after MPT using indoor calibrated IOPs and
ROPs
(c) MRRs after displacement removal
(d) MRRs after lens distortion correction
Figure 6. BBR example of MCA-5 and MCA-4 at each stage
Table 3. Systematic corrections for BBR at each stage
Ref. Figure
11
Displacement Factors (Pixels)
Lens Distortion Factors
Average MRRs Length (Pixels)
��
���� ������ |��̅��.��| ������.���
(a) 2.22 -0.37 0.95 0.88 5.95
(b) 0.40 -0.57 0.90 0.87 0.87
(c) 0.05 0.00 0.87 0.82 0.51
(d) 0.00 -0.06 0.03 0.09 0.23
4.1.2 Reliability and Robustness Examination
In order to evaluate the reliability and robustness of the proposed method, we select 5 scenes acquired at different exposure times as “calibration data” to calculate the corrected ROPs and IOPs and choose another 10 scenes for “evaluation data”. The values of ROPs and IOPs were averaged from the calibration data and applied to the evaluation data. Figure 7 depicts the Mean, Std., Max. and Min. of average MRRs length from the calibration data. The values are calculated from the 11 neighboring bands combinations from 5 scenes, resulting in a total of 55 cases.
In Figure 7, cases A-D illustrate the statistics of the MRRs of the calibration data. Case A is for the original image, case B is from the BBR results using PW2, case C is the MPT BBR results using the indoor calibrated IOPs and ROPs, case D is after the displacement correction, and case E is the final result after applying lens distortion correction. For comparison, case F is the result from evaluation data (10 scenes having 110 cases) by adopting the corrected IOPs and ROPs from the calibration data.
Figure 7 shows that PW2 BBR only slightly reduces the misregistration effect and a large average MRRs length of 2.44 pixels is observed. Through the proposed MPT BBR and systematic errors correction schemes, the average MRRs length is decreased significantly and a sub-pixel level of 0.31 pixels is achieved. Case F shows similar results to case E and the maximum misregistration is only 0.51 pixels. This proves that the proposed method is robust, accurate, and scene independent.
Figure 7. Statistics of average MRRs length at each stage
4.1.3 Visual and GProfile Comparisons of BBR
Since the MRRs analysis can be applied only on two neighboring bands, we adopt visual and profile comparisons that can compose a false color image from any three bands of MiniMCA-12. We create one example of false color image by using the combination of (R: 750 nm, G: 550 nm, B: 450 nm) as given in Figure 8. The original image, PW2 BBR, and the proposed MPT BBR results, together with their horizontal and vertical spectral profiles are demonstrated.
Figure 8(a) shows that the white roof building in the original image and its gray value profiles, i.e. Figure 8(b-c) are not aligned. Though the misregistration effect was reduced after PW2 BBR, the results are still not well enough, as shown in
Figure 8(d-f). On the other hand, Figure 8(g-i) shows the proposed MPT method obtains the best BBRresults where both the horizontal and vertical profiles are well aligned.
(a) Original Image
(b) Original image horizontal profile
(c) Original image vertical profile
(d) PW2 BBR
(e) Horizontal profile of PW2
(f) Vertical profile of PW2
(g) MPT BBR
(h) Horizontal profile of MPT
(i) Vertical profile of MPT
Figure 8. Visual comparisons by false color composition and spectral profiles
4.2 Ortho-Image Analysis
4.2.1 Accuracy Assessment of Canon RGB Ortho-image
In this study, 15 check points are measured on the Canon RGB ortho-image for estimating its geometric accuracy. The Max., Min. Mean, Std. Dev., and RMS errors in the E and N directions are summarized in Table 4. Notice that the Max. and Min. errors are all less than 1 pixel, the RMS errors are 0.53 pixels and 0.54 pixels in the x and y directions, respectively. Cumulatively, this results in 0.76 pixels (7.6 cm) planimetric RMS error.
Table 4. Error analyses of Canon RGB ortho image Max.
(Pixels/cm)
Min. (Pixels/cm)
Mean (Pixels/cm)
Std. Dev. (Pixels/cm)
RMS (Pixels/cm) E 0.59/5.87 -0.87/-8.73 -0.14/-1.44 0.53/5.32 0.53/5.34 N 0.80/8.00 -0.50/-5.00 0.39/3.88 0.38/3.84 0.54/5.36
Figure 9. Ortho-image of MiniMCA.
4.2.2 Co-registration Error Analysis between Canon and MiniMCA Ortho-Images
Co-registration error analysis was conducted by same procedure as the MRRs analysis. However, the GSD of the Canon RGB ortho-image was reduced to 40 cm in order to avoid scale differences with the MiniMCA (MCA-6) ortho-image. The co-registration error vectors between the MCA-6 and Canon RGB ortho-images are plotted in Figure 10. This results in a RMSE of 0.58 pixels (i.e. 23.2 cm). Meanwhile, the values of (������,������) are (-0.02, -0.13) pixels, and the correlation coefficients of |���.��|
and |���.��| are 0.07 and 0.12, respectively. This means that no systematic bias between those two ortho-images could be found.
Figure 10. Co-registration error vectors between MCA-6 and Canon RGB ortho-images
5. CONCLUSIONS
MiniMCA-12 is a narrow band multilens/multispectral sensor that has ability to derive various vegetation indices for biomass estimation, water stress detection, precision agriculture, etc. However, MiniMCA-12 images have significant band misregistration effects caused by different perspective centers, mounting angles, and lens distortion effects. Therefore, performing BBR is crucial to eliminate the misregistration effects in remote sensing applications.
In this study, we proposed the use of a modified projective transformation (MPT) for BBR of MiniMCA-12 camera array. The required coefficients are estimated from IOPs and ROPs which are calibrated from an indoor camera calibration procedure. Since the MiniMCA-12 covers spectral range from 450 nm to 950 nm, a combination of energy saving blubs, a 450 nm LED and several Halogen lamps can be used to expand the spectral range of light sources and increase MiniMCA image quality for better coded target recognition during calibration.
During MPT processing, the lens distortion effect, scale differences, various perspective centers, and relative mounting angles of each camera are all considered. To compensate for the inaccuracy of the estimated IOPs and ROPs, two systematic errors are corrected by displacement removal and lens distortion correction to improve the accuracy of BBR. In this study, we utilized 5 scenes of calibration data for the improvement of IOPs/ROPs and applied them to other 10 scenes of evaluation data. Through the MRRs analysis, we observe that the proposed MPT method achieve average MRR length of 0.33 pixels with a standard deviation of 0.11 pixels. This proves that the proposed MPT scheme for multilens BBR is accurate, robust and scene independent.
After BBR, all 12 images of MiniMCA captured at the same exposure time will have the same IOPs and EOPs. In case the ground control points are visible on the MiniMCA image and a DSM is available, aerial triangulation, DSM generation and ortho-rectification can be performed without the assistance of DSLR images. However, the MiniMCA-12 is a narrow-band multispectral sensor with low image quality, SNR, and spatial resolution, particularly when mounted on a fixed-wing UAS for larger ground coverage. Thus a DSLR camera is suggested to assist in aerial triangulation. Finally, any digital photogrammetric software can be used for control point marking, DSM generation, and aerial triangulation to obtain accurate EOPs for ortho-rectification of MiniMCA imagery.
In the suggested ortho-rectification procedure, we select one reference band (MCA-6 camera) to perform aerial triangulation together with the Canon RGB images. From the spatial accuracy analysis of Canon RGB ortho-image, the planimetric RMS error is 7.6 cm. Although it is not possible to recognize the control/check points for the acquired MiniMCA images, we use an image matching technique to evaluate the co-registration error between the Canon RGB and MCA-6 ortho-images. The RMS of co-registration error is 0.58 pixels, thus the absolute accuracy of the MiniMCA ortho-image is estimated to be about 23.3-31 cm.
stable, the user can repeat the whole procedure easily as they can be processed automatically.
Due to the requirement for accurate modeling of non-linear lens distortion effect, the proposed method requires high image overlap ratio that covers the principle points (symmetric center of radial lens distortion) of both images. However, if the accuracy of indoor camera calibration is high and their IOPs are stable, the required minimum image overlap ratio could be greater than 10% as only linear displacement effect exists after lens distortion correction. The proposed scheme can be applied to other multilens frame-based cameras, such as the UltraCam and DMC, whose image overlap ratio is high and suitable for estimating the lens distortion effect.
ACKNOWLEDGEMENTS
This research was financially supported by the Ministry of Science and Technology, Taiwan with project number MOST 103-2119-M-006-002. The authors are grateful to Mr. William Lee of Aeroland UAV Inc. and Mr. Kircheis Liu of GEOSAT Aerospace Co., Ltd. for providing assistance in the UAV platform and system integration, respectively.
REFERENCES
Cho, W., Schenk, T., 1992. Resampling Digital Imagery to Epipolar Geometry, IAPRS International Archives of Photogrammetry and Remote Sensing, pp. 404-408.
Debella-Gilo, M., Kääb, A., 2011. Sub-pixel precision image matching for measuring surface displacements on mass movements using normalized cross-correlation. Remote Sensing of Environment 115, 130-142.
Frueh, C., Sammon, R., Zakhor, A., 2004. Automated texture mapping of 3D city models with oblique aerial imagery, Proceedings of the 3D Data Processing, Visualization, and Transmission, 2nd International Symposium, pp. 396-403.
Gruber, M., Ladstädter, R., 2011. Results from Ultracam Monolithic Stitching, ASPRS Annual Conference, Milwaukee, WI.
Holtkamp, D.J., Goshtasby, A.A., 2009. Precision registration and mosaicking of multicamera images. IEEE Trans. on Geoscience and Remote Sensing 47, 3446-3455.
Kelcey, J., Lucieer, A., 2012. Sensor Correction of a 6-Band Multispectral Imaging Sensor for UAV Remote Sensing. Remote Sensing 4, 1462-1493.
Ladstädter, R., Gruber, M., Wiechert, A., 2010. Monolithic Stitching: One Sensor Geometry for Multiple Sensor Cameras, ASPRS, San Diego, CA.
Rau, J.-Y., Jhan, J.-P., Hsu, Y.-C., 2015. Analysis of Oblique Aerial Images for Land Cover and Point Cloud Classification in an Urban Environment. IEEE Transactions on Geoscience and Remote Sensing, (Accepted).
Rosten, E., Porter, R., Drummond, T., 2010. Faster and better: a machine learning approach to corner detection. IEEE Trans Pattern Anal Mach Intell 32, 105-119.
Simper, A., 1996. Correcting General Band-to-Band Misregistrations, Image Processing, 1996. Proceedings., International Conference on, pp. 597-600 vol.592.
Stagakis, S., González-Dugo, V., Cid, P., Guillén-Climent, M.L., Zarco-Tejada, P.J., 2012. Monitoring water stress and fruit quality in an orange orchard under regulated deficit irrigation using narrow-band structural and physiological remote sensing
indices. ISPRS Journal of Photogrammetry and Remote Sensing 71, 47-61.
Suárez, L., Zarco-Tejada, P.J., Berni, J.A.J., González-Dugo, V., Fereres, E., 2009. Modelling PRI for water stress detection using radiative transfer models. Remote Sensing of Environment 113, 730-744.
Tommaselli, A., Galo, M., de Moraes, M., Marcato, J., Caldeira, C., Lopes, R., 2013. Generating Virtual Images from Oblique Frames. Remote Sensing 5, 1875-1893.
Turner, D., Lucieer, A., Malenovský, Z., King, D., Robinson, S., 2014. Spatial Co-Registration of Ultra-High Resolution Visible, Multispectral and Thermal Images Acquired with a Micro-UAV over Antarctic Moss Beds. Remote Sensing 6, 4003-4024.
Xiao, J., Gerke, M., Vosselman, G., 2012. Building extraction from oblique airborne imagery based on robust façade detection. ISPRS Journal of Photogrammetry and Remote Sensing 68, 56-68.