COMPARISONS OF AEROSOL OPTICAL DEPTH PROVIDED BY SEVIRI SATELLITE
OBSERVATIONS AND CAMx AIR QUALITY MODELLING.
A. P. Fernandesa*, M. Rifflerb,c, J. Ferreiraa, S. Wunderlec, C. Borregoa and O. Tchepeld
aCESAM & Department of Environment and Planning, University of Aveiro, 3810-193 Aveiro, Portugal - (apsfernandes*, jferreira, cborrego)@ua.pt
bOeschger Centre for Climate Change Research, University of Bern, Switzerland - [email protected] cRemote Sensing Research Group, Department of Geography, University of Bern, Switzerland - [email protected]
dCITTA, Department of Civil Engineering, University of Coimbra, 3030 - 788 Coimbra, Portugal – [email protected]
KEY WORDS: Aerosol Optical Depth (AOD), Satellite data, Chemical Transport Model, dust outbreak.
ABSTRACT:
Satellite data provide high spatial coverage and characterization of atmospheric components for vertical column. Additionally, the use of air pollution modelling in combination with satellite data opens the challenging perspective to analyse the contribution of different pollution sources and transport processes. The main objective of this work is to study the AOD over Portugal using satellite observations in combination with air pollution modelling. For this purpose, satellite data provided by Spinning Enhanced Visible and Infra-Red Imager (SEVIRI) on-board the geostationary Meteosat-9 satellite on AOD at 550 nm and modelling results from the Chemical Transport Model (CAMx - Comprehensive Air quality Model) were analysed. The study period was May 2011 and the aim was to analyse the spatial variations of AOD over Portugal. In this study, a multi-temporal technique to retrieve AOD over land from SEVIRI was used. The proposed method takes advantage of SEVIRI's high temporal resolution of 15 minutes and high spatial resolution.
CAMx provides the size distribution of each aerosol constituent among a number of fixed size sections. For post processing, CAMx output species per size bin have been grouped into total particulate sulphate (PSO4), total primary and secondary organic aerosols (POA + SOA), total primary elemental carbon (PEC) and primary inert material per size bin (CRST_1 to CRST_4) to be used in AOD quantification. The AOD was calculated by integration of aerosol extinction coefficient (Qext) on the vertical column.
The results were analysed in terms of temporal and spatial variations. The analysis points out that the implemented methodology provides a good spatial agreement between modelling results and satellite observation for dust outbreak studied (10th -17th of May 2011). A correlation coefficient of r=0.79 was found between the two datasets. This work provides relevant background to start the integration of these two different types of the data in order to improve air pollution assessment.
1. INTRODUCTION
Over the last decade, air pollution has become a major problem in Portugal due to high concentration of particulate matter (PM) in the atmosphere, being the exceedance of daily limit values one of the main issues for air pollution management. Therefore, better characterisation of the emission sources and understanding the atmospheric processes involved in the aerosol formation, transport and deposition are of prime concern. Atmospheric aerosols are associated with various environmental impacts from local to global scales. Thus, aerosols cause detrimental health effects in humans and an increase of fine particles concentration is associated with rising morbidity and mortality (e.g. Pope and Dockery, 2006; WHO, 2006a,b). At global scale, atmospheric aerosols have direct and indirect effects on the climate system and affect both temperature and precipitation patterns on the earth’s surface (IPCC, 2007).
The concentrations and compositions of aerosols vary strongly in space and time (Dentener et al., 2006; Kaufman and Koren, 2006; Tsigaridis et al., 2006; van der Werf et al., 2006; Koch et al., 2007) because the residence time of particles in the atmosphere is only in the order of hours to weeks, depending mainly on the particle size and meteorological conditions. Therefore, adequate techniques should be identified to characterise these variations and to improve our understanding on the pollution sources and their possible effects. In this context, the use of satellite data in combination with air pollution modelling opens a challenging perspective. An increasing interest to use satellite observations in
*Corresponding author: [email protected] / Fax: +351 234 370309 / Phone: +351 234370220
air pollution modelling is mainly related with two important properties of the data in comparison with surface measurements: more complete spatial coverage and characterization of atmospheric components for vertical column (Tchepel et al., 2013; Vijayaraghavan et al., 2008; Engel-Cox et al., 2004). Satellite data may be used to evaluate, initialize, constrain, and improve the performance of air pollution models (Vijayaraghavan et al., 2008). On the other side, chemical transport models provide essential information on aerosol composition, size distribution and vertical profiles that may be used to improve satellite aerosol retrievals (Hu et al., 2009; Randall, 2008).
Long-range transport of atmospheric pollution, including mineral dust from natural sources, is one of the research topics where an integration of the satellite data with air pollution modelling may provide promising results. In Europe, and particularly in Mediterranean countries, desert dust particles transported from arid and semi-arid regions of North Africa have a strong impact on air quality (Monteiro et al., 2015; Basart et al., 2012; Pay et al., 2012; Querol et al., 2009, 2004; Rodríguez et al., 2001). It has been estimated that this natural contribution to PM may range from 5% to 50% in different European Countries (Marelli, 2007). Therefore, the development of a harmonized methodology that contributes to a better understanding of the natural aerosol burden is an important issue.
Model (CAMx) model was used to provide 3D fields on aerosol concentration, size distribution and chemical composition. The modelling results were evaluated against ground-based observations and analysed in combination with aerosol satellite observations provided by Spinning Enhanced Visible and Infra-Red Imager (SEVIRI).
2. METHODOLOGY
2.1 Modelling approach
To investigate the spatial variations of aerosol optical depth (AOD) over Portugal, May 2011 was chosen as a study period for this study. During this period Portugal was influenced by African dust outbreaks (Monteiro et al., 2015). The air quality modelling system WRF-CAMx, constituted by the Weather Research & Forecasting (WRF) model (Skamarock et al., 2008) and the CAMx model (ENVIRON, 2013) weas considered as a suitable tool for the purpose of this study. The input/output structure of WRF-CAMx is presented in Figure 1. CAMx is a 3D chemistry-transport Eulerian photochemical model that allows for an integrated assessment of gaseous and particulate air pollution over many scales, ranging from sub-urban to continental. CAMx is well-known and has been extensively applied for Portugal and worldwide (Tchepel et al., 2013; Ferreira et al., 2012, 2010; Huang et al., 2010; Borrego et al., 2008).
Figure 1. Air quality modelling system – input/output structure
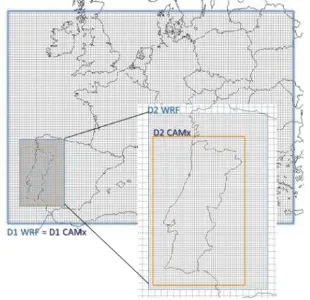
The WRF-CAMx air quality modelling system has been applied for May 2011 to simulate 3D pollutant concentration fields. The modelling setup included 2 nesting domains covering Europe (D1) and Portugal (D2) with 27 and 9 km horizontal resolution, respectively (Figure 2), both with about 15 km vertical column (non-regularly subdivided on 15 levels considering higher details near ground).
Figure 2. Modelling domains for WRF and CAMx.
For this WRF-CAMx application, initial and boundary conditions for Europe were taken from the Model for OZone and Related chemical Tracers (MOZART), an offline global chemical transport model (Emmons et al., 2010). MOZART outputs at every 6 hours were downloaded for May 2011 (http://www.acd.ucar.edu/wrf-chem/mozart.shtml), at 1.9ºx2.5º horizontal resolution and 56 vertical levels. A pre-processing tool allowed for the conversion of MOZART gaseous and aerosol species into CAMx species according to the chemical mechanism in use – CB05. Emission inputs were prepared for the two simulation domains. The EMEP-EU27 gridded emissions (http://webdab1.umweltbundesamt.at/scaled_country_year.html ) by SNAP sector available for the pollutants CO, NH3, NMVOC, SOx, PM2.5 and PMcoarse, were disaggregated by area to EU grid. This emission inventory was subject to a comparative analysis with other emission inventories available for Europe (Ferreira et al., 2013). Despite the fact that it is not the highest resolution inventory, it is suitable for the purpose considering that the EU simulation is only used to get initial and boundary conditions for the domain of interest. For the Portuguese domain, the national emission inventory (http://www.apambiente.pt/index.php?ref=17&subref=150) developed for regulation purposes were used. Emissions of CO, NOx, NH3, NMVOC, SO2, PM10 and PM2.5 from anthropogenic sources are available by municipality for the whole territory of Portugal, and were disaggregated to the 9x9 km2 grid cell domain. Biogenic emissions were provided as well. The aerosol chemistry module in CAMx performs the following three processes: 1) Aqueous sulphate and nitrate formation in resolved cloudwater using the RADM aqueous chemistry algorithm (Chang et al., 1987); 2) partitioning of condensable organic gases to secondary organic aerosols to form a condensed “organic solution phase” using a semi-volatile, equilibrium scheme called SOAP (Strader et al., 1999); and 3) partitioning of inorganic aerosol constituents between the gas and aerosol phases using the ISORROPIA thermodynamic module (Nenes et al., 1998, 1999).
For post processing, CAMx output species per size bin have been grouped into total particulate sulphate (PSO4), total primary and secondary organic aerosols (POA + SOA), total primary elemental carbon (PEC) and primary inert material per size bin (CRST_1 to CRST_4: 0.11.0µm, 1.0 2.5 µm, 2.5 5.0 µm, 5.0 -10.0 µm) to be used in AOD quantification and compared with the aerosol data provided by the SEVIRI satellite sensor. The comparison of modelled aerosol load with satellite retrieval is done in terms of AOD which is a measure of the attenuation of the incoming solar radiation by particle scattering and absorption. AOD is calculated by integration the aerosol extinction coefficient (Qext) over the vertical column from the surface level to the top of the modelling domain (Eq. (1)):
Both AOD and Qext depend on the wavelength ( ) and are related with particle chemical composition, size distribution and shape (Martin et al., 2003; Tegen and Lacis, 1996). These data are used in combination with aerosol column mass loading provided by the modelling system to estimate AOD at 550 nm.
2.2 SEVIRI aerosol retrievals
utilizing 11 spectral channels between 0.6 m and 14 m and one broad band visible channel with higher spatial resolution. MSG is in a geostationary orbit enabling SEVIRI to capture the entire observed disc every 15 minutes. To estimate AOD from the satellite data, the channel centred at 0.6 m with a spatial resolution of 3 km at the sub-satellite point (approximately 5 km for central Europe) is used. A detailed description of the retrieval algorithm can be found in Popp et al. (2007).
A short summary of the algorithm is given in the following lines. To retrieve AOD from SEVIRI, the top-of-atmosphere (TOA) signal (converted to reflectance units) measured by the satellite sensor needs to be decomposed into the Earth surface’s and atmospheric contribution. First, the surface reflectance for every pixel is estimated selecting the lowest observed reflectance (corrected for ozone, water vapor, and background aerosol concentration) from a temporal window of 15 days. A fixed aerosol model (continental aerosol type, single scattering albedo ω0=0.8λ at =0.55 m) and meteorological data (ozone and water vapour concentration) from the European Centre for Medium Range Wether Forecasts (ECMW) operational analysis are then fed into a radiative transfer model to invert the AOD from the (estimated) surface and (measured) TOA reflectance. The Simplified Model for Atmospheric Correction (SMAC, Rahman and Dedieu, 1994) is used for the radiative transfer simulations which is a parameterized version of 6S (Vermote et al., 1997). As a last step, a spatial averaging filter (moving 5×5 pixel box) is applied to the retrieved AOD to reduce noise such that, finally, each pixel represents the AOD of an area of approximately 25×25 km2.
To compare the AOD from SEVIRI with the modelling results, the spatial join tool from a geographic information system was used to combine both grids. Then, we selected the maximum value in each pixel for each hour. The result of this methodology is a grid with SEVIRI data adequate to compare with CAMx results.
3. RESULTS AND DISCUSSION
In this section, we present the results from the analysis and comparison of the air quality model outputs, SEVIRIand AERONET observations in order to verify their agreement. During May 2011, over mainland Portugal, two dust outbreaks from North of Africa were identified by Monteiro et al. (2015). One of them occurred during several days (10-17 May 201) was selected to investigate the long-range transport of mineral dust.
3.1 SEVIRI observations
The AOD data provided by SERIVI over mainland Portugal were analysed in terms of average of the daily values, in order to assess its spatial and temporal distribution. SERIVI obtains observations with a high temporal resolution of 15 minutes and a spatial resolution of approximately 9 km2 (Figure 3a). In the first step, it was necessary get a single SEVERI observation per hour. Therefore, the maximum value for each pixel and each hour was selected. The last step was to apply the spatial join tool from the geographic information system to combine both grids. The result is a grid with a maximum value for each pixel and each hour with SEVIRI data adequate to compare with CAMx results (Figure 3b).
Figure 3. SEVIRI data for 14 May 2011 at 14 UTC: a) original pixel size (3x3 km2) and b) pixel size of the modelling results
(9x9 km2).
3.2 SEVIRI observations and AERONET data
SEVIRI AOD retrievals were compared with Aerosol Robotic Network (AERONET) level 2.0 AOD measurements from 4 stations (Figure 4a) in the modelling domain for May 2011 (http://aeronet.gsfc.nasa.gov/)(Figure 2). For that purpose, AERONET observations were averaged to the 15 min resolution of SEVIRI observations. For both data, SEVIRI and AERONET, the daily mean AOD value was calculated. Figure 4b shows the scatterplot of daily mean AOD values provided by SEVIRI and AERONET for all stations located within the modelling domain at May 2011.
Figure 4. a) Localition of AERONET Stations, b) Scatterplot of daily mean AOD values from AERONET versus SEVIRI and c) trendlines of the daily mean AOD value from AERONET and
SEVIRI for May 2011.
SEVIRI AODs agree well with AERONET observations with a correlation coefficient value of 0.57 (Figure 4b). The trendlines of the daily mean AOD value from AERONET and SEVIRI for all stations at May 2011 are presented in Figure 4c. The lowest correlation coefficient (0.61) was found for Évora station, located in the centre of the domain.
a)
b)
3.3 Air quality modelling results
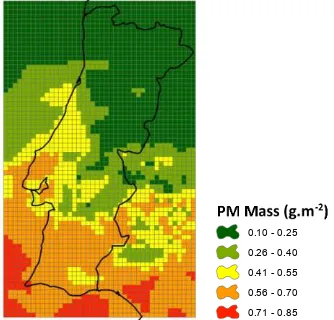
Figure 5 presents a particulate matter mass field for Portugal, for a specific hour of day as an example. These values result from the sum of organic carbon, black carbon, sulphate and mineral dust from all the vertical levels. As one can see, the southern part of the domain presents higher particulate matter (PM) mass than the other regions of the study area influenced mainly by mineral dust.
Figure 5. PM mass (g.m-2) are shown for 14th May 2011 at 14 UTC.
The analysis of the contribution of each PM component by vertical layers is important to better understand the atmospheric processes that influence aerosol loading and to identify possible long-range transport of mineral dust. For this propose, the 3D model outputs were analysed and an example for 2 random points is presented (Figure 6a), one in the north and another in the south of the domain. The plots (Figure 6b and 6c) display the vertical profile of the concentrations obtained for each PM component. At both points, the highest PM concentration was simulated at 2000 meters. The results in the South point (Figure 6b) showed higher PM concentration values in all layers comparing to the North point (Figure 6c). The component with largest contribution is the dust bin 2 (1.0-2.5µm).
Figure 6. Vertical distribution of PM concentration: a) localization of the two points, b) results for South point and c)
results for North point.
3.4 Air quality model results and SEVIRI observations
A spatial analysis of the monthly results obtained from modelling application and their comparison with remotely sensed aerosol data are presented in Figure 7 a) and b) respectively. The monthly results were obtained by computing the average of the daily AOD values between 6 -17 UTC (diurnal time). The southern part of the domain presents higher concentrations, showing a clear influence of the mineral dust.
Figure 7. Monthly mean Aerosol Optical Depth (AOD) for May 2011. a) Spatial distribution obtained with CAMx and b) Spatial
distribution of SEVIRI data.
The scatter plot of the modelling results (Figure 7a) versus satellite data (Figure 7b) is presented in Figure 8 for each cell for May 2011. The modelling data are in agreement with the observations showing a correlation coefficient of 0.38 (Figure 8). Moreover, simulated and observed values exhibit different spatial patterns and distinct magnitudes (Figures 7 and 8).
Figure 8. Scatterplot of monthly mean AOD for each grid cell from CAMx and SEVIRI for May 2011.
3.5 Analysis of the dust outbreak
During May 2011, over mainland Portugal, two dust outbreaks from North of Africa were identified by Monteiro et al. (2015). One of them occurred during several days (10-17 May 2011) and was the biggest dust outbreak during 2011. This dust outbreak was selected to analyse the spatial variation of daily mean AOD value from CAMx (Figure 9a) and SEVIRI (Figure 9b).
MASSA
0.10 - 0.25 0.26 - 0.40 0.41 - 0.55 0.56 - 0.70 0.71 - 0.85
a) b)
a)
Figure 9. Mean Aerosol Optical Depth (AOD) shown for 10th-17th May 2011. a) Spatial distribution obtained from CAMx
data and b) Spatial distribution of SEVIRI data.
The scatter plot of the modelling results versus satellite data is presented in Figure 10 for each cell, for the dust outbreak period. The modelling data are in agreement with the observations showing a correlation of r=0.79 between the two datasets for the studied period (10th-17th of May 2011) (Figure 10).
Figure 10. Scatterplot of mean AOD spatial distribution between CAMx and SEVIRI for 10th -17th of May 2011.
CAMx results of mean AOD for 10th -17th of May 2011 were evaluated against SEVIRI observations with standard statistical techniques to determine mean bias (MB)
(
Eq. 2)
and root mean square error (RMSE)(
Eq. 3)
:� = ∑ �� − ��� �
(
Eq. 2)
� � = [∑ �� �− ��� �� ] /
(
Eq. 3)
For each daily mean spatial plot, statistics were generated if the number of grid cells with successfully retrieved SEVIRI AOD values was greater than 1500 for each day over all study domain (total grid cells = 2898).
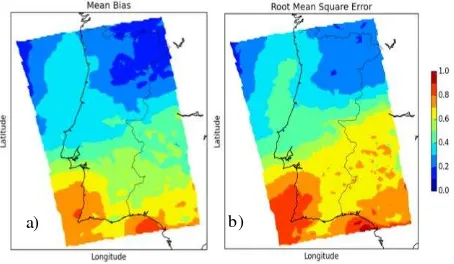
Figure 11 shows the mean bias and root-mean square error derived using the data at each grid cell over the 8-day time period. It can be observed that, in the south part of the domain, MB and RMSE are higher, reaching values between 0.5 and 0.9 this could be related to the fact that CAMx simulated higher particulate matter concentrations, mainly influenced by mineral dust (Figure 6).
Figure 11. Statistical analysis between CAMx results and SEVIRI observations for 10th -17th of May 2011. a) Mean bias
and b) Root mean square error.
Spatial analysis of AOD over three regions of the study domain is given in Figure 12.
Figure 12. Daily mean AOD values obtained from CAMx results and SEVIRI observation for each region a) North (red
box), b) Center (green box) and c) South (blue box) for the period 10th -17th May 2011.
The analysis of AOD over the regions shows significant spatial variations, more evident in CAMx results. However, AOD over the south region is observed to be high compared to other regions. There is a better agreement between SEVIRI and CAMx in the North region probably because of the less important contribution of mineral dust in this region. Moreover, the higher difference between CAMx and SEVIRI averages in all regions was identified during the first four days of the study period.
4. CONCLUSION
Atmospheric aerosols play an important role in the energy budget of the Earth climate system by interacting with solar and terrestrial radiation. Therefore, the development of a harmonized methodology that contributes to a better understanding of the aerosol burden is an important issue to determine their impacts on the global climate and human health.
The chemical transport model CAMx was applied to characterise the 3D distribution of aerosols over Portugal. Modelling results
were analysed in combination with SEVIRI observations in terms of AOD at 550 nm.
The results show that the implemented methodology provides a reasonable agreement between the modelling outputs and satellite observations. For the selected and analysed dust outbreak (10th-17th May 2011) a correlation coefficient of r=0.79 was found between the two datasets. Spatially, the differences are bigger over the region where mineral dust exhibited higher concentration, with mean bias and root mean square error values between 0.5 and 0.9. This paper presents relevant background to start the integration of these two different types of the data in order to improve air pollution assessment.
ACKNOWLEDGEMENTS
The authors acknowledge the financial support of the FCT under the projects CLICURB (EXCL/AAG-MAA/0383/2012) and MAPLIA (PTDC/AAG-MAA/4077/2012), the Ph.D grants of A. Fernandes (SFRH/BD/86307/2012) and the post-doc grants of J. Ferreira (SFRH/BPD/40620/2007).
REFERENCES
Basart, S., Pay, M.T., Jorba, O., Pérez, C., Jiménez-Guerrero, P., Schulz, M., Baldasano, J.M., 2012. Aerosol in the CALIOPE air quality modelling system: validation and analysis of PM levels, optical depths and chemical composition over Europe. Atmospheric Chemistry and Physics 12, 3363e3392. http:// dx.doi.org/10.5194/acp-12-3363-2012.
Borrego, C., Lopes, M., Valente, J., Tchepel, O., Miranda, A.I. and Ferreira, J., 2008. The role of PM10 in air quality and exposure in urban areas. In Air Pollution 2008 Conference, 22-24 Setembro, Skyathos, Grécia. Eds. C.A. Brebbia, J.W.S. Longhurst W.I.T. Transactions on Ecology and the Environment, Vol 116, WIT Press, Southampton, UK, pp 511-520. doi:10.2495/AIR08521.
Chang, J.S., Brost, R.A., Isaksen, I.S.A., Madronich, S., Middleton, P., Stockwell, W.R., Walcek, C.J., 1987. A three-dimensional Eulerian acid deposition model: physical concepts and formulation. Journal of Geophysical Research 92, 14,681e14,700. http://dx.doi.org/10.1029/JD092iD12p14681.
Dentener, F., Kinne, S., Bond, T., Boucher, O., Cofala, J., Generoso, S., Ginoux, P., Gong, S., Hoelzemann, J.J., Ito, A., Marelli, L., Penner, J.E., Putaud, J.P., Textor, C., Schulz, M., van der Werf, G.R., Wilson, J., 2006. Emissions of primary aerosol and precursor gases in the years 2000 and 1750 prescribed data-sets for AeroCom. Atmospheric Chemistry and Physics 6, 4321e4344. http://dx.doi.org/10.5194/acp-6-4321-2006.
Emmons, L. K., Apel, E. C., Lamarque, J.-F., Hess, P. G., Avery, M., Blake, D., Brune, W., Campos, T., Crawford, J., DeCarlo, P. F., Hall, S., Heikes, B., Holloway, J., Jimenez, J. L., Knapp, D. J., Kok, G., Mena-Carrasco, M., Olson, J., O'Sullivan, D., Sachse, G., Walega, J., Weibring, P., Weinheimer, A., and Wiedinmyer, C., 2010. Impact of Mexico City emissions on regional air quality from MOZART-4 simulations, Atmos. Chem. Phys., 10, 6195-6212, doi:10.5194/acp-10-6195-2010.
Engel-Cox, J.A., Hoff, R.A., Haymet, A.D.J., 2004. Recommendations on the use of satellite remote-sensing data for
urban air quality. Journal of the Air & Waste Management Association 54, 1360e1371.
ENVIRON, 2013. User’s guide to the Comprehensive Air Quality model with extensions (CAMx) version 6.00 (May, 2013), http://www.camx.com
Ferreira, J., Guevara, M., Baldasano, J.M., Tchepel, O., Shaap, M., Miranda, A.I., Borrego, C., 2013. A comparative analysis of two highly spatially resolved European atmospheric emission inventories. Atmos. Environ., 75, 43-57. Doi: 10.1016/j.atmosenv.2013.03.052.
Ferreira, J., Reeves, C.E., Murphy, J.G., Garcia-Carreras, L., Parker, D.J., Oram, D.E., 2010. Isoprene emissions modelling for West Africa: MEGAN model evaluation and sensitivity analysis. Atmos. Chem. Phys., 10, 8453-8467. doi:10.5194/acp-10-8453-2010
Ferreira, J., Rodriguez, A., Monteiro, A., Miranda, A.I., Dios, M., Souto, J.A., Yarwood, G., Nopmongcol, U., Borrego, C., 2012. Air quality simulations for North America - MM5-CAMx modelling performance for main gaseous pollutants. Atmospheric Environment. 53, 212-224. doi: 10.1016/j.atmosenv.2011.10.020
Hu, R.M., Sokhi, R.S., Fisher, B.E.A., 2009. New algorithms and their application for satellite remote sensing of surface PM2.5 and aerosol absorption. Journal of Aerosol Science 40 (5), 394-402.
Huang, Q., Cheng, S.Y., Li, Y.P., Li, J.B., Chen, D.S., Wang, H.Y., 2010. An integrated MM5-CAMx modelling approach for assessing PM10 contribution from different sources in Beijing, China. Journal of Environmental Information, 15 (2), 47-61.
IPCC, 2007. Climate change 2007: the physical science basis. In: Solomon, S., Qin, D., Manning, M., Chen, Z., Marquis, M., Averyt, K.B., Tignor, M., Miller, H.L. (Eds.), Contribution of Working Group I to the Fourth Assessment Report of the Intergovernmental Panel on Climate Change. Cambridge University Press, Cambridge, United Kingdom and New York, USA. 996 p.
Kaufman, Y.J., Koren, I., 2006. Smoke and pollution aerosol effect on cloud cover. Science 313, 655e658. http://dx.doi.org/10.1126/science.1126232.
Kautzman K. E., 2014. Reflective Aerosols and the Greenhouse Effe. Global Environmental Change, Handbook of Global Environmental Pollution. Volume 1 , pp 23-30
Koch, D., Bond, T.C., Streets, D., Unger, N., van derWerf, G.R., 2007. Global impacts of aerosols from particular source regions and sectors. Journal of Geophysical Research 112, D02205. http://dx.doi.org/10.1029/2005JD007024.
Martin, R.V., D.J. Jacob, R.M. Yantosca, M. Chin, and P. Ginoux, 2003 Global and regional decreases in tropospheric oxidants from photochemical effects of aerosols, J. Geophys. Res., 108, 4097, doi:10.1029/2002JD002622.
Monteiro, A., Fernandes, A.P., Gama, C., Borrego, C., Tchepel, O., 2015. Assessing the mineral dust from North Africa over Portugal region using BSC-DREAM8b model. Atmospheric Pollution Research, doi: 10.5094/APR.2015.009.
Nenes, A., Pilinis, C., Pandis, S.N., 1998. ISORROPIA: a new thermodynamic model for multiphase multicomponent inorganic aerosols. Aquatic Geochemistry 4, 123e152.
Nenes, A., Pilinis, C., Pandis, S.N., 1999. Continued development and testing of a new thermodynamic aerosol module for urban and regional air quality models. Atmospheric Environment 33, 1553e1560.
Pay, M.T., Jiménez-Guerrero, P., Jorba, O., Basart, S., Querol, X., Pandolfi, M., Baldasano, J.M., 2012. Spatio-temporal variability of concentrations and speciation of particulate matter across Spain in the CALIOPE modeling 240 O. Tchepel et al. / Atmospheric Environment 64 (2013) 229e241 system.
Atmospheric Environment 46, 376e396.
http://dx.doi.org/10.1016/ j.atmosenv.2011.09.049
Pope, C.A., Dockery, D.W., 2006. Health effects of fine particulate air pollution: lines that connect. Journal of the Air & Waste Management Association 56, 709e742
Popp, C., Hauser, A., Foppa, N., & Wunderle, S., 2007. Remote sensing of aerosol optical depth over central Europe from MSG-SEVIRI data and accuracy assessment with ground-based AERONET measurements. Journal of Geophysical Research, 112, D24S11.
Querol, X., Alastuey, A., Ruiz, C.R., Artiñano, B., Hansson, H.C., Harrison, R.M., Buringh, E., ten Brink, H.M., Lutz, M., Bruckmann, P., Straehl, P., Schneider, J., 2004. Speciation and origin of PM10 and PM2.5 in selected European cities. Atmospheric Environment 38, 6547e6555. http://dx.doi.org/10.1016/ j.atmosenv.2004.08.037.
Querol, X., Pey, J., Pandolfi, M., Alastuey, A., Cusack, M., Pérez, N., Moreno, T., Viana, M., Mihalopoulos, N., Kallos, G., Kleanthous, S., 2009. African dust contributions to mean ambient PM10 mass-levels across the Mediterranean Basin. Atmospheric Environment 43, 4266e4277. http://dx.doi.org/10.1016/ j.atmosenv.2009.06.013.
Rahman, H. and Dedieu, G, 1994. SMAC: a simplified method for the atmospheric correction of satellite measurements in the solar spectrum, Int. J. Remote Sens., 15(1), 123–143
Randall, V.M., 2008. Satellite remote sensing of surface air quality. Atmospheric Environment 42, 7823e8784. http://dx.doi.org/10.1016/j.atmosenv.2008.07.01.
Rodriguez, S., Querol, X., Alastues, A., Kallos, G., Kakaliagou, O., 2001. Saharan dust contribution to PM10 and TSP levels in southern and eastern Spain. Atmospheric Environment 35, 2433e2447. http://dx.doi.org/10.1016/S1352-2310(00)00496-9.
Skamarock, W.C., Klemp, J.B., Dudhia, J., Gill, D.O., Barker, D.M., Huang, X.Y., Wang, W., Powers, J.G., 2008. A Description of the Advanced Research WRF Version 3. NCAR Technical Note NCAR/TN-475+STR, pp. 113, doi:10.5065/D68S4MVH.
Strader, R., Lurmann, F., Pandis, S.N., 1999. Evaluation of secondary organic aerosol formation in winter. Atmospheric Environment 33, 4849e4863. http://dx.doi.org/10.1016/S1352-2310(99)00310-6.
Tchepel O., Ferreira J., Fernandes A.P., Basart S., Baldasano J.M., Borrego C., 2013. Analysis of long-range transport of aerosols for Portugal using 3D Chemical Transport Model and satellite measurements. Atmospheric Environment. 64, 229-241.
Tegen, I., and A. A. Lacis, 1996. Modeling of particle size distribution and its influence on the radiative properties of mineral dust aerosol, Journal of Geophysical Research-Atmospheres, 101(D14), 19237- 19244.
Tsigaridis, K., Krol, M., Dentener, F.J., Balkanski, Y., Lathiere, J., Metzger, S., Hauglustaine, D.A., Kanakidou, M., 2006. Change in global aerosol composition since preindustrial times. Atmospheric Chemistry and Physics 6, 5143e5162. http://dx.doi.org/10.5194/acp-6-5143-2006.
van der Werf, G.R., Randerson, J.T., Giglio, L., Collatz, G.J., Kasibhatla, P.S., Arellano, A.F., 2006. Interannual variability in global biomass burning emissions from 1997 to 2004. Atmospheric Chemistry and Physics 6, 3423e3441. http://dx.doi.org/10.5194/acp-6-3423-2006.
Vermote, E., Tanr´e, D., and Morcrette, J.-J., 1997. Second simulation of the satellite signal in the solar spectrum, 6S: an overview, IEEE T. Geosci. Remote, 35(3), 675–686
Vijayaraghavan, K., Snell, H.E., Seigneu, C., 2008. Practical aspects of using satellite data in air quality modeling. Environmental Science & Technology 42 (22), 8187-8192.
WHO, 2006a. Air Quality Guidelines. Global Update 2005. Particulate Matter, Ozone, Nitrogen Dioxide and Sulfur Dioxide. WHO Regional Office for Europe, Copenhagen. ISBN 9289021926, 484 p.