A HADOOP-BASED ALGORITHM OF
GENERATING DEM GRID FROM POINT CLOUD DATA
X. Jian a, *, X. Xiao b, H. Chengfang a, Z. Zhizhong a, W. Zhaohui a, Z. Dengzhong a
a Changjiang River Scientific Research Institute, Wuhan, China – [email protected] b School of Resource and Environmental Science, Wuhan University, Wuhan, China
KEY WORDS: Hadoop. LiDAR, Digital Elevation Model
ABSTRACT:
Airborne LiDAR technology has proven to be the most powerful tools to obtain high-density, high-accuracy and significantly detailed surface information of terrain and surface objects within a short time, and from which the Digital Elevation Model of high quality can be extracted. Point cloud data generated from the pre-processed data should be classified by segmentation algorithms, so as to differ the terrain points from disorganized points, then followed by a procedure of interpolating the selected points to turn points into DEM data. The whole procedure takes a long time and huge computing resource due to high-density, that is concentrated on by a number of researches. Hadoop is a distributed system infrastructure developed by the Apache Foundation, which contains a highly fault-tolerant distributed file system (HDFS) with high transmission rate and a parallel programming model (Map/Reduce). Such a framework is appropriate for DEM generation algorithms to improve efficiency. Point cloud data of Dongting Lake acquired by Riegl LMS-Q680i laser scanner was utilized as the original data to generate DEM by a Hadoop-based algorithms implemented in Linux, then followed by another traditional procedure programmed by C++ as the comparative experiment. Then the algorithm’s efficiency, coding complexity, and performance-cost ratio were discussed for the comparison. The results demonstrate that the algorithm's speed depends on size of point set and density of DEM grid, and the non-Hadoop implementation can achieve a high performance when memory is big enough, but the multiple Hadoop implementation can achieve a higher performance-cost ratio, while point set is of vast quantities on the other hand.
* Corresponding author
1. INTRODUCTION
Recent advances in geospatial field have made it possible to get a wide range of sample points of terrain. Light detection and ranging (LiDAR) technology, which emerged in 1960s, has proven to be the most powerful tool to obtain high-density, high-accuracy and significantly detailed surface information of terrain and surface objects within a short time, and from which the Digital Elevation Model of high quality can be extracted. However, a number of issues about LiDAR still need to be solved, such as disorder and massive size of point cloud data.
With the rapid development of high-performance computers, larger LiDAR data can be processed within a short period of time. However, it costs too much to pay for high-performance computers, which is a big obstacle for applying the algorithm for mass production. Cloud computing technology can put all kinds of resources needed for computing together in a resource pool, then reallocate them for explicit utilization. In that way, personal computer can be combined into a big computing resource pool to support the production of DEM. Since its publicity, popularity, high efficiency, flexibility and convenience, Hadoop is used as our computing platform for generating DEM from point cloud data.
In this research, we focus on a method of generating DEM from LiDAR data based on Hadoop. Point cloud data acquired by Riegl LMS-Q680i in Dongting Lake is utilized as the original data. Another implementation by non-Hadoop algorithm is also carried out as comparative experiment. Then the algorithm’s efficiency, coding complexity, and performance-cost ratio are discussed.
2. RELATED WORKS 2.1 Research on DEM Generation from LiDAR
The Light Detection and Ranging (LiDAR) technology is a remote sensing technology that measures distance by illuminating a target with a laser and analyzing the reflected light.
LiDAR has been researched since the 1960s. Kraus and Pfeifer are forerunners who demonstrated the suitability of using airborne LiDAR for generating DEM (Kraus, 1997), then it continues to be an active area of research and development (Flood, 2001). Since data are different under various terrain conditions, various studies are documented by many authors. In 2006, a situation under forest area was discussed by Gonçalves-Seco and Miranda (Gonçalves-Gonçalves-Seco, 2006). A robust algorithm was applied in generating DEM also in a forest area in 2007 (Kobler, 2007). Kraus and Pfeifer demonstrated that accuracy of DEM derived from LiDAR data was equal to that derived from photogrammetry (Kraus, 1998), and the method of LiDAR could overcome the limitations of photogrammetry in forest areas that the photos couldn't eliminate the influence of canopy. There have been a lot of researchers discussing the methods of extracting DEM from LiDAR data acquired in various regions in recent years.
filter methods have been developed over the past years, among which interpolation-based proposed by Kraus and Pfeifer (Kraus, 1998), slope based proposed by Vosselman (Vosselman, 2000), and morphological proposed by Kilian (Kilian, 1996) are most popular. Second, points derived from original point cloud data should be represented in forms of DEM, which are commonly three kinds of models: the regular grid, the triangular irregular network (TIN), and the contour line model. The selection of models is determined by orographic condition. Then a procedure called interpolation can be performed to predict the values of non-sampled locations based on the measured values at points under the assumptions that the terrain surface is continuous and smooth. Deterministic methods such as inverse distance weighted (IDW) and spline-based methods that fit a minimum-curvature surface through the sample points, and geo-statistical methods such as Kriging that takes into account both the distance and the degree of autocorrelation are available for constructing a DEM from sample elevation points (Liu, 2008).
2.2 Hadoop
Hadoop is an open-source software framework written in Java for distributed storage and distributed processing of very large data sets on computer clusters built from commodity hardware, which is supported by Apache. It consists of a highly fault-tolerant and distributed file system and a programming model for distributed computing.
2.2.1 Hadoop Distributed File System: Hadoop Distribute File System (HDFS) is a high performance distributed file system for web-scale applications such as, storing log data, Map/Reduce data etc., which is designed for running on commodity hardware, and providing high-throughput data access. HDFS is an open-source implementation of Google File System (GFS), which was first proposed by Ghemawat, Gobioff and Shun-Tak Leung in 2003 (Ghemawat, 2003).
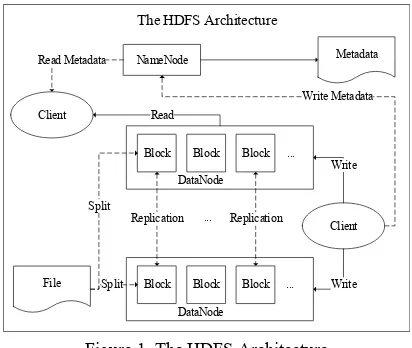
In physical hierarchy, HDFS is a master-slave architecture, an HDFS cluster consists of a NameNode, which is a master server in charge of managing file namespace and adjusting clients’ file access, and several DataNodes, which are responsible for storing data blocks. Usually a NameNode corresponds to a single computer, while DataNodes correspond to several computers. Files are first segmented into blocks, then replicated in many copies, which are separately stored in different DataNodes. The allocation records are stored in NameNode as metadata. If one DataNode shut down, the NameNode can read data from another DataNode that stores the same block. In this way, large file (usually means the size of a single file exceed 1GB, or even 1TB) can be processed efficiently and steadily. The architecture is shown in Figure 1.
The HDFS Architecture
Figure 1. The HDFS Architecture
2.2.2 Map/Reduce: Map/Reduce is a programming model and an associated implementation for processing and generating large data sets, proposed in 2004 by Jeffrey Dean and Sanjay Ghemawat, who are hired by Google (Dean, 2004). There are several implementations available for this programming model such as Apache Hadoop Map/Reduce and Disco from Nokia Research Center. This programming model has become popular over the past few years and adopted by a growing number of IT companies, such Facebook and Yahoo.
In Map/Reduce framework, a module called JobTracker and other modules called TaskTracker are respectively running on NameNode and DataNode, those are mentioned in HDFS. The JobTracker is responsible for decomposing a job into tasks and delivering those tasks to unoccupied TaskTrackers. Meanwhile, the TaskTrackers are in charge of implementing tasks, when TaskTracker fails or times out, that part of job is rescheduled.
2.3 Hadoop on Geospatial Field
In recent years, cloud computing has been a hot research spot due to exponential increasing of amount of data on the Internet. A lot of excellent cloud computing platforms have been developed by Internet companies, such as Amazon's EC2, Google's cloud computing platform, Microsoft's Windows Azure and IBM's Blue Cloud. Since the functionality and convenience of cloud computing, it can be used to support geospatial applications, including modeling, storage, processing and so on.
3. ALGORITHM OVERVIEW 3.1 Study area and data description
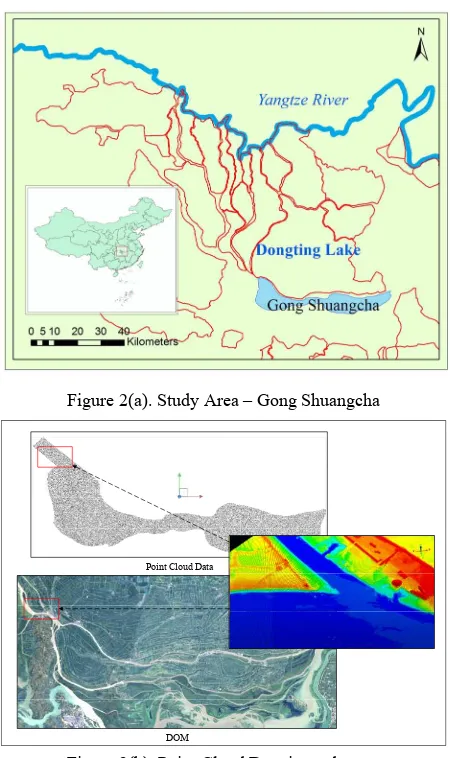
Figure 2(a). Study Area – Gong Shuangcha
Point Cloud Data
DOM
Figure 2(b). Point Cloud Data in study area
A flood diversion area called Gong Shuangcha in Dongting Lake was included within this study, as shown in Figure 2. Dongting Lake was a shallow lake in northeastern Hu’nan province, China, which was also the second largest freshwater lake in China. Since it was a flood basin of the Yangtze River, the lake’s water area depended on the season. As a result, most areas of Dongting Lake were used as cultivated fields, and most houses were one floor.
In this research, point cloud data obtained from Riegl LMS-Q680i laser scanner was utilized, which was made up of 394 files with extension of “.coo”. Each file represented a small segment, which was named by two-dimensional location under the Chinese Xi’an 80 coordinate system, for instance, “dtm_03363219m100.coo”. After the convert and combine procedure, statistics for point cloud data was made. The total count of point clouds was 311637474, plane accuracy was 0.1 meter and vertical accuracy was 0.01 meter, the size of point cloud data file was 5.80GB in LAS format. Digital orthophoto map of same area was used as an auxiliary data. The point cloud data and DOM were shown in Figure 2(b).
3.2 Procedure of Generating DEM from Point Cloud Data First, the original .coo file should be convert and combined as a single standard file. In this research, we converted all point cloud data to LAS file format, which was a public file format for the interchange of three-dimensional point cloud data between data users. The LAS 1.4 Specification was approved by the ASPRS Board on November 14, 2011 and was the most recent approved version of the document.
Second, terrain point should be separated from non-terrain point (buildings, trees, and other on-ground objects). As mentioned in 2.3, the linear prediction method was adopted since the study area. There wasn’t a universal method for all kinds of regions, hence the appropriate algorithm depended on the geographic conditions of Dongting Lake. The linear prediction method was chosen since there were few steep slopes and large variability in our study sites.
The last but important, terrain point clouds should be turned to DEM. Points were collected at 10s to 100s of kilohertz by laser scanners, they sampled elevation at a spacing of significantly less than a meter, therefore the nature of LiDAR point cloud data also led themselves to a local gridding approach (Krishnan, 2010). Since most elevations of points were between 20 meters and 50 meters, and there were a few steep slopes in Dongting Lake, the grid model with a matrix structure was the best storage structure of DEM in computer. Then the interpolation step determined the terrain height value of a certain point by using the known heights of collected points. In this research, the Inverse distance weighted (IDW) method was used. The procedure is shown in Figure 3.
Start
.las file .coo
files
.coo files
.coo files
...
Convert and combine
Linear prediction
interpolate
DEM
End
Las file with only terrain points
Procedure of Algorithm
Figure 3. Procedure of Algorithm
3.3 Hadoop Approach
Start
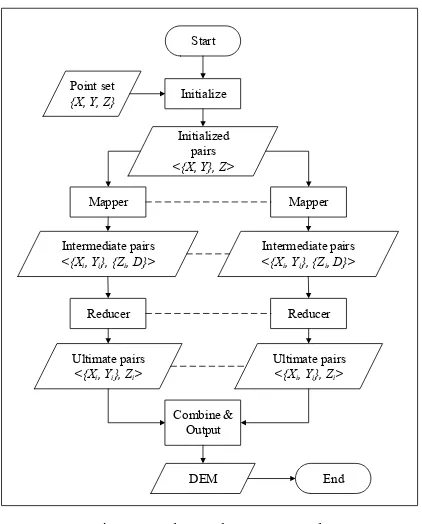
Figure 4. The Hadoop Approach
3.3.1 Step Map: The total count of points was NP, according to the resolution and the location of final digital elevation model, the xy-coordinates of grid centers were determined, and
M×N represented the size of DEM. Each original point was represented as an input key/value pair, the input key is the {X, Y}
tuple, the input value was {Z}, then the step map generated the intermediate key/value pair <{Xi, Yi}, {Zi, D}>, where {Xi, Yi} represented the xy-coordinates of the nearest grid center from
the {X, Y, Z} point, D represented the plane distance between {X,
Y} and {Xi, Yi}. After this phase, NPkey/value pairs were turned into M×N key/value pairs.
3.3.2 Step Reduce: After the step map, the output pairs should be generated from the intermediate key/value pair. For each {Xi, Yi}, the total, average value, mean value, minimum value, maximum value and counts of D were calculated, followed by the calculation of Z value. Then all intermediate key/value pairs in different DataNodes were merged. The ultimate key/value pair was {Xu, Yu, Zu}, which represented the grid center’s three-dimensional coordinate.
4. IMPLEMENTATION AND COMPARISON 4.1 Algorithm Implementation
In order to compare the Hadoop algorithm and non-Hadoop algorithm, a cloud computing environment was built and allocated the same virtual machines for both algorithms. The cloud computing environment was also supported by an open-source software framework: Apache CloudStack. Four Dell PowerEdge R430 servers were utilized for the cloud computing environment, and the hardware list and software list of them were as below:
1. Hardware:
a) CPU: Intel Xeon Processor E5-2630 V3 with 8 core, 2.5MB cache and 2.4GHz for each core; b) Chipset: Inter C610 series chipset;
c) Memory: 16GB DDR4;
2. Software:
a) Operating System: CentOS 6.5 b) Cloud Management: CloudStack 4.4.2 c) Hypervisor: KVM in CentOS 6.5
As a kind of Linux operating system, CentOS 6.5 was installed for both Hadoop approach and non-Hadoop approach. Hadoop-1.2.1, jdk-8u25-linux-x64, and eclipse indigo as the integrated development environment were installed on the virtual machine for Hadoop method. GCC 4.8.4 and Emacs-24.4 were installed for C++ programing.
There were three types of computing resources allocated: 9.6GHz/8GB, 19.2GHz/16GB, and 38.4GHz/32GB. For non-Hadoop method, resources were allocated for a single virtual machine, while for Hadoop method, resources were respectively allocated for 1 node and 4 nodes. In other words, 9.6GHz CPU and 8GB memory were allocated for one computer, 2.4GHz CPU and 2GB memory allocated for each node of four. Then Hadoop approach and non-Hadoop approach were compared on each level of resources, and Hadoop approach on level3 of resources with 1 node and 4 nodes were compared.
For each comparative situation, point clouds were respectively separated as a quarter (78741481 points), a half (157883263 points), three quarters (237340463 points) and all points. Hence count of points was the independent variable and the time spent was the dependent variable. Two kinds of grid size of DEM were also taken into account for each situation, which was 1 meter and 4 meters.
4.2 Compare
For Hadoop approach and non-Hadoop approach on each level of resources, the results are shown in Figure 5(a); for different nodes of Hadoop approach, the results are shown in Figure 5(b), the x-axis and y-axis represent the count of cloud points and time spent respectively.
Figure 5(b).Different nodes of Hadoop approach
5. CONCLUSIONS AND FUTURE WORKS From above mentioned results, an obvious conclusion can be concluded that the time increases with the increasing of DEM’s density and the increasing of the number of point clouds. When there is not enough memory for the algorithm, it takes more time (see the performance with resources of level1). The non-Hadoop implementation can achieve a higher performance than Hadoop when memory is big enough, and the efficiency of 4-node cluster is a little lower than that of 1-4-node cluster, which are possibly due to the network bandwidth bottleneck and the I/O operation of HDFS. But a computer with big memory is expensive, and the Hadoop algorithm can solve this problem. With a little loss of efficiency, the Hadoop algorithm can handle larger single file and cost little.
This work has demonstrated that a Hadoop approach for DEM generation from point cloud data can help processing large single point cloud file at a relatively low cost. However, there are a lot of issues remain to be solved, such as, the filter phase of separating terrain points from non-terrain points should be implemented in a Hadoop approach either, the algorithm should be improved for terrain with steep slopes, and so on.
ACKNOWLEDGEMENTS
This work was funded through a grant from the Basic Research Operating Expenses for the Central Public Welfare Research Institutes of China (No. CKSF2012047/KJ, No.CKSF2014035/ KJ, No. CKSF2014032/KJ), and National Scientific Fund of China (No.41201452, No.41301435), and International S&T Cooperation Program of China (NO.2012DFR70760).
REFERENCES
Aji, A., Wang, F., Vo, H., Lee, R., Liu, Q., Zhang, X., & Saltz, J., 2013. Hadoop GIS: a high performance spatial data warehousing system over mapreduce. Proceedings of the VLDB
Endowment, 6(11), 1009-1020.
Almeer, M. H., 2012. Cloud hadoop map reduce for remote sensing image analysis. Journal of Emerging Trends in
Computing and Information Sciences, 3(4), 637-644.
Chen, Q., Wang, L., & Shang, Z., 2008. MRGIS: A MapReduce-Enabled high performance workflow system for
GIS. In eScience'08. IEEE Fourth International Conference, pp. 646-651.
Dean, J., & Ghemawat, S., 2008. MapReduce: simplified data processing on large clusters. Communications of the ACM, 51(1), 107-113.
Flood, M., 2001. Laser altimetry: from science to commercial LiDAR mapping. Photogrammetric Engineering and Remote
Sensing, 67(11).
Gao, S., Li, L., Li, W., Janowicz, K., & Zhang, Y., 2014. Constructing gazetteers from volunteered big geo-data based on Hadoop. Computers, Environment and Urban Systems.
Ghemawat, S., Gobioff, H., & Leung, S. T., 2003. The Google file system. In ACM SIGOPS operating systems review (Vol. 37, No. 5, pp. 29-43). ACM.
Gonçalves-Seco, L., Miranda, D., Crecente, R., & Farto, J., 2006. Digital terrain model generation using airborne LiDAR in a forested area Galicia, Spain. In: Proceedings of 7th International symposium on spatial accuracy assessment in
natural resources and environmental sciences, pp. 169-180.
Golpayegani, N., & Halem, M., 2009. Cloud computing for satellite data processing on high end compute clusters. In Cloud
Computing, 2009. CLOUD'09. IEEE International Conference,
pp. 88-92.
Hegeman, J. W., Sardeshmukh, V. B., Sugumaran, R., & Armstrong, M. P., 2014. Distributed LiDAR data processing in a high-memory cloud-computing environment. Annals of GIS, 20(4), 255-264.
Kilian, J., Haala, N., & Englich, M., 1996. Capture and evaluation of airborne laser scanner data. International Archives
of Photogrammetry and Remote Sensing, 31, 383-388.
Kobler, A., Pfeifer, N., Ogrinc, P., Todorovski, L., Oštir, K., & Džeroski, S., 2007. Repetitive interpolation: A robust algorithm for DTM generation from Aerial Laser Scanner Data in forested terrain. Remote Sensing of Environment, 108(1), 9-23.
Kraus K., & Pfeifer N., 1997. A new method for surface reconstruction from laser scanner data. IAPRS, 32(2), 80-86.
Kraus, K., & Pfeifer, N., 1998. Determination of terrain models in wooded areas with airborne laser scanner data. ISPRS
Journal of Photogrammetry and remote Sensing, 53(4),
193-203.
Krishnan, S., Baru, C., & Crosby, C., 2010. Evaluation of MapReduce for gridding LIDAR data. In Cloud Computing Technology and Science (CloudCom), 2010 IEEE Second
International Conference, pp. 33-40.
Liu, X., 2008. Airborne LiDAR for DEM generation: some critical issues. Progress in Physical Geography, 32(1), 31-49.
Liu, X., Han, J., Zhong, Y., Han, C., & He, X., 2009. Implementing WebGIS on Hadoop: A case study of improving small file I/O performance on HDFS. In Cluster Computing and Workshops, 2009. CLUSTER'09. IEEE International
Lv, Z., Hu, Y., Zhong, H., Wu, J., Li, B., & Zhao, H., 2010. Parallel K-means clustering of remote sensing images based on mapreduce. Web Information Systems and Mining, pp. 162-170.
Vosselman, G., 2000. Slope based filtering of laser altimetry data. International Archives of Photogrammetry and Remote
Sensing, 33(B3/2; PART 3), 935-942.