COASTLINE EXTRACTION FROM AERIAL IMAGES BASED ON EDGE DETECTION
V. Paravolidakis a, K. Moirogiorgou a, L. Ragia b, *, M. Zervakis a, C. Synolakis b
a School of Electronic and Computer Engineering, Technical University of Crete, 73100 Kounoupidiana, Chania, Greece - [email protected], [email protected], [email protected]
b School of Environmental Engineering, Technical University of Crete, 73100 Kounoupidiana,Chania, Greece - (lragia, ksynolakis)@isc.tuc.gr
Commission VIII, WG VIII/9
KEY WORDS: Coastal Management, Aerial Images, Optical Image Processing, Region Segmentation, Edge Detection, Active Contours
ABSTRACT:
Nowadays coastline extraction and tracking of its changes become of high importance because of the climate change, global warming and rapid growth of human population. Coastal areas play a significant role for the economy of the entire region. In this paper we propose a new methodology for automatic extraction of the coastline using aerial images. A combination of a four step algorithm is used to extract the coastline in a robust and generalizable way. First, noise distortion is reduced in order to ameliorate the input data for the next processing steps. Then, the image is segmented into two regions, land and sea, through the application of a local threshold to create the binary image. The result is further processed by morphological operators with the aim that small objects are being eliminated and only the objects of interest are preserved. Finally, we perform edge detection and active contours fitting in order to extract and model the coastline. These algorithmic steps are illustrated through examples, which demonstrate the efficacy of the proposed methodology.
* Corresponding author
1. INTRODUCTION
Coastline is a physical line of the area where land meets sea. Due to the importance of land erosion and land depletion from environmental changes, the extraction of coastline is an important task. Several techniques have been developed to extract coastline form satellite images (Dellepiane et al., 2004) (Alesheikh et al., 2007) (Zhang and Wang, 2010). We propose a new method for automatic coastal extraction using aerial images. The contribution of this study is methodological at the research level, but at a higher political level it can affect the policy making process by enabling public authorities to monitor the coastline changes, keep track of them and act in a way that will maintain the natural topology of the coastline. Thus, the extracted information can be used for regional planning and coastal region management. The proposed method uses input image data that are provided by the Hellenic Military of Geographical Service (HMGS) or even images taken from Google Earth (Google Earth, 2014).
Automatic extraction of shoreline features using aerial images has been analyzed using neural nets and image processing techniques (Ryan et al., 1991). Another approach for the extraction of coastline is based on segmentation techniques (Pixel-based-segmentation or grey-level thresholding) applied on satellite and aerial images (Chalabi et al., 2006). In this study we use aerial images because of the small size of the coastal area of interest and the spatial resolution of images.
Our methodology follows two main stages. The first one aims to provide an estimation of the coastline based on region segmentation techniques using a local thresholding method, while the second stage comes to optimize the results of the first
approach and model the coastline based on active contours. In the results section we present the outcome of the proposed coastline extraction scheme on the coastal area of the region Georgioupoli, located at North West Crete, Greece.
2. PROPOSED METHODOLOGY
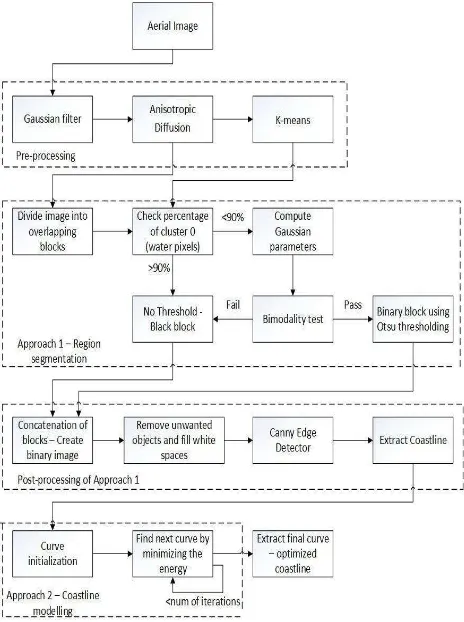
The task of coastline extraction using aerial images can be a challenging one if we try to proceed with the estimation using Digital Image Processing techniques. The proposed method is implemented as a 4-step algorithm: (1) pre-processing, (2) region segmentation, (3) post-processing and (4) coastline modelling. More specifically, the pre-processing step is used to achieve noise reduction and edge enhancement in the image. The region segmentation provides a local threshold to divide the image into blocks of different content. At the post-processing step we apply morphological operations and edge detection to extract the coastline.
Figure 1. Block Diagram of the proposed methodology
2.1 Pre-processing
Aerial images usually suffer from noise distortion and the first task one needs to perform is to remove the noise before continuing with the extraction of the coastline. We first apply a Gaussian filter that achieves good noise removal without blurring the edges.
Another issue we have to address is the deformation of the image due to unexpected factors, like sun light, shadows or clouds. To deal with these problems, we apply an anisotropic diffusion algorithm (Perona and Malik, 1987). The algorithmic aim of this study is to enhance strong edges, like coastal area and land, while at the same time suppressing weak edges like the sea area. Figure 2 illustrates the aerial image after the step of pre-processing, where we can evaluate the achievement of the set goals in terms of image quality.
2.2 Region segmentation
The second step of our methodology is the region segmentation. We start with the image segmentation into two groups-regions; land and sea. The pixels that belong to the borders of these two regions compose the coastline. We use local thresholding in order to avoid false estimations as a result of the image intensity heterogeneity. The threshold values are calculated based on the image local characteristics.
(a)
(b)
Figure 2. Result of pre-processing: (a) initial image, (b) image after applying Gaussian filter and anisotropic diffusion
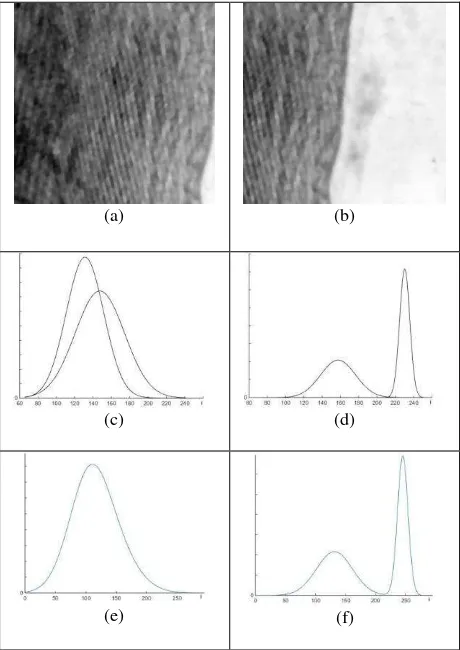
The first step is clustering of the image using K-means algorithm with 3 clusters; sea (cluster = 0), coast and buildings (land, cluster = 1, 2). Then, we divide the image into small blocks (regions) and specify a different threshold adjusted to each of them. The motivation of this strategy is that some of the blocks will contain entirely sea or land pixels, so that there is no need for any processing of such blocks. To succeed this, for each block we examine the bimodality of intensity distribution (Liu and Jezek, 2004) and the percentage of zero pixels.
(a) (b)
(c) (d)
(e) (f)
Figure 3. Blocks reflecting various cases of the bimodality procedure: (a) a block that contains mostly sea area, (b) a block that contains coastline area, (c), (d) presents the two Gaussian distributions modelling the distribution of the first and second image, respectively, (e) and (f) reflects the extracted mixture of two Gaussian distributions for the first and second image, respectively.
Subsequently, in order to reduce processing time, for each block we first examine the percentage of zero values after clustering based on K-means procedure. We found that if a block has total number of zero pixels above of 90 percent of the whole image, it does not need to be processed. This is due to the fact that these blocks contain mostly sea area and maybe waves or other masses on the sea surface.
For the remaining blocks we examine the bimodality. More specifically, we assume that there are two Gaussian distributions of the intensity values, one for the description of the sea and the other for land. Their combination generates a Gaussian mixture model describing the observed intensity values of the image. If a block contains only water area pixels, the mixture of the distribution will only reflect one peak (unimodal). On the other hand, if a block is part of the coastline area, the mixture of distributions will consist of one valley and two peaks (bimodal). To be able to identify whether we have a bimodal or unimodal distribution, we use the valley to peak ratio (Fig. 3) of the total histogram of the block.
For every block that passes the bimodality tests, a threshold T is calculated by using the Otsu’s method (Otsu 1979). This method automatically performs clustering-based image thresholding of a grayscale image by maximizing the weighted between-class variance. The algorithm follows the assumption
that the block contains two classes of pixels (land, sea) through bimodal histogram (already established from the previous step) and then calculates the optimum threshold that classifies the two classes so that their combined spread is minimal. The weighted between-class variance is expressed as:
2 classes. Also the class probabilities are estimated from the class histograms as:
while the class means are given by:
1 to each block of the image and create a binary one following the procedure below:
0, if ( , ) T 1, if ( , ) T( , ) I x yI x y
b x y (4)
where T is the threshold of the block and I(x,y) is the intensity value of image pixel at points x, y. For every block that fails to pass the bimodality tests a binary image is created with zero values at every point.
2.3 Post-processing
At the last step of our methodology, we concatenate the blocks in order to recreate the image in a binary form. The final value of each pixel is calculated by following the logic ‘OR’ condition between overlapping areas, which assigns the value 1 for the final pixel if and only if one of the overlapping blocks is 1 at this point. To explain why we use this procedure, we remind that blocks with over 90% of pixels in the sea area do not pass the bimodality test. However, in extreme cases, a small part of the coastline may be involved in such a block. It is expected that a neighboring block will identify the coastline, because it will contain both parts of sea and land area. The use of the proposed conjunction condition aims to protect such edge pixels across the coastline that appears only at a portion of overlapping blocks.
(a)
(b)
Figure 4. Results of post-processing: (a) image after concatenation of binary blocks, (b) image after removing objects out of the area of interest and filling blank spaces at land area.
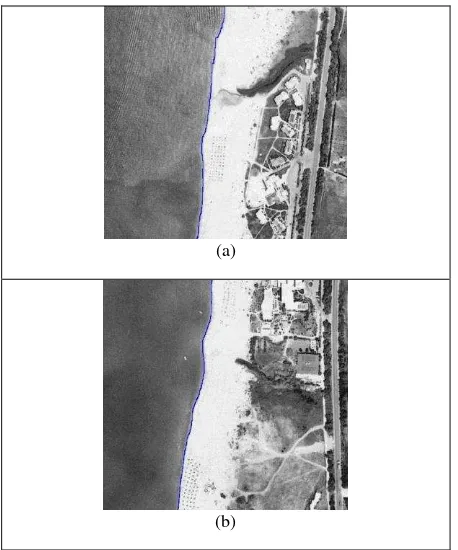
(a)
(b)
Figure 5. Estimation of first approach: (a), (b) close-up of the initial image in two different locations. Blue line reflects the estimated coastline.
Finally, we use a simple edge detection operator to detect edges in image. Notice that at this stage of processing, the binary
image involves a white area that belongs to land and a black area that belongs to sea, so that the boundary line refers to the coastline. We used the Canny edge detection method, which operates in 3 steps: (a) find the intensity gradient of the image, (b) apply non-maximum suppression, where pixels that are not considered to be part of an edge are removed and (c) hysteresis is applied to eliminate gaps. The result constitutes the first estimation of the coastline (Fig. 5).
2.4 Coastline modelling
The estimated coastline in most of cases needs improvement because of some random factors across the coastline, such as people, moving cars, or waves, which cannot be captured correctly by the previous steps and may produce wrong estimations. In order to deal with these problems we adopt an open active contour method, which is based on snakes and extends the classical active contour model (Kass et al., 1998) with the condition of free boundary conditions.
A snake is an energy-minimizing spline that consists of an initial closed contour C0 near to a contour in the image and searches for deformations of C0 which move it towards the actual image contour. To obtain these deformations we need to minimize the energy functional formed by two energy terms regarding the intensity distribution of the image around the edge and reflect the internal and external regions of the edge itself. This functional can be expressed by:
int
snake ext
E
E
E
(5)where
1 2 2
int 0 (s) (s)
E
C C dt (6)1
0 ( ( ))
ext
E
I C t dt (7)Finally, combining equations 5, 6, 7 we obtain
1 2 2
0 (s) (s) ( (s))
snake C C I C dt
E
(8)where s is the curve parameter, C s( )( ( ), ( )),x s y s is the
initial curve in the original image
I
, parameters α, β impose the elasticity and rigidity of the curve, parameter λdetermines the level of the gradient regions that the curve will attract to andI
is the gradient of the image intensity.
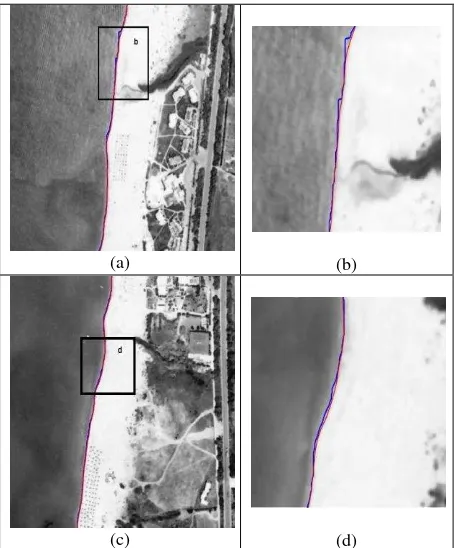
(a) (b)
(c) (d)
Figure 6. Estimation of second approach: (a), (c) close-up of the initial image in two different locations showing the results of the two methods. Blue line refers to the estimated coastline extracted from the first approach while red line refers to the optimized coastline obtained from the second approach; (b), (d) provide a more detailed aspect of (a), (c) respectively in order to have a better understanding of the improvement of the coastline estimation.
In our method we use one boundary curve on the top and one on the bottom of the image. The two end points of curve are restricted to lie on the boundary curves. We initialize the curve using the already extracted coastline, obtained from the first approach. Afterwards we estimate iteratively the next possible position of the curve for 150 iterations by minimizing the energy of the snake bounded by the two boundary curves. Examples of this application are presented in Fig. 6 with red line. It is worth noticing that on the same images we have traced the result of the first (initial) segmentation approach. combination of the two approaches, with the first providing the initial estimate for the second method, forms an efficient scheme for coastline segmentation.
3. CONCLUSIONS
The present study provides an automated coastline extraction methodology using aerial images through image processing techniques aiming at region segmentation and edge detection. Following the elimination of possible noise distortion in the input data and the enhancement of the edges of interest through an anisotropic diffusion algorithm, we apply region segmentation in order to split the image into two groups of regions, land and sea. The processes of thresholding, edge
detection and active contour fitting improve the accuracy of the extracted coastline.
As for future work, we intend to improve the accuracy of the coastline estimation by implementing the transform for moving from image coordinates to real-world coordinates and view the image as a projective mapping from the 3D word coordinate system. This can be implemented by using geo-referenced images and provide a pixel-to-real-distance conversion, i.e., pixels/cm conversion scheme. Furthermore, this conversion may provide a robust basis for post processing and computations of real-world measures, such as coastline length, coast surface and erosion levels.
Alesheikh, A. A., Ghorbanali, A. and Nouri, N., 2007. Coastline change detection using remote sensing. International Journal of Environmental Science & Technology, 4(1), pp. 61-66.
Chalabi, A., Mohd-Lokman, H., Mohd-Suffian, I., Karamali, K., Karthigeyan, V. and Masita, M., 2006 May. Monitoring shoreline change using Ikonos image and aerial photographs: a case study of Kuala Terengganu area, Malaysia. In ISPRS Commission VII Mid-term Symposium “Remote Sensing: From Pixels to Processes”, Enschede, the Netherlands, pp. 8-11.
Dellepiane, S., De Laurentiis, R. and Giordano, F., 2004. Coastline extraction from SAR images and a method for the evaluation of the coastline precision. Pattern Recognition Letters, 25(13), pp. 1461-1470.
Google Earth, 2014. Google Earth virtual globe. http://earth.google.com.
Kass, M., Witkin, A. and Terzopoulos, D., 1998. Snakes: Active contour models. International Journal of Computer Vision 1(14), pp. 321–331.
Liu, H. and Jezek, K., C., 2004. Automated extraction of coastline from satellite imagery by integrating Canny edge detection and locally adaptive thresholding methods. International Journal of Remote Sensing 25(5), pp. 937–958.
Otsu, N., 1979. A threshold selection method for grey level histograms, IEEE Transactions on Systems Man Cybernetics. SMC-9 (1), pp. 62–66.
Perona, P., Malik, J., 1987. Scale space and edge detection using anisotropic diffusion, Proc. IEEE Comp. Soc. Workshop on Computer Vision (Miami Beach, Nov. 30– Dec. 2, 1987), IEEE Computer Society Press, Washington, pp. 16–22.
processing. Photogrammetric Engineering and Remote Sensing, 57(7), pp. 947-955.
Shemesh, M. and Ben-Shahar, O., 2011. Free boundary conditions active contours with applications for vision, Advances in Visual Computing, vol. 6938, pp. 180-191.