Detection of High Local Groundwater Inflow to Rock Tunnels using ASTER Satellite Images
M. Sharafia, *, S. Khazaei b
a
Dept. of Geology University, University Bu-Ali Sina, Hamadan, Iran –[email protected] b
Dept. of Civil Engineering, University of Imam Hussein, Tehran, Iran– [email protected]
KEY WORDS: Tunnel, Groundwater Inflow, ASTER satellite images, Cuesta ridge.
ABSTRACT:
High local groundwater flow into rock tunnels may lead to a potential hazard and is an important factor influencing construction time and costs. Geological features such as fault zones and open fractures can be the source of very high local groundwater inflows. Having a reliable estimation of location groundwater inflows is essential before excavation of tunnels. To reduce the costs and time of field works, remote sensing investigations can be a good solution. The main aim of the present study is to propose a methodology for detecting the geomorphic markers of cuesta in the high local groundwater inflow to Nosoud tunnel using the satellite imagery data. For this purpose, a reflectance image from the ASTER satellite sensor was used. Our Experiments show that cuesta springs, caused by hydraulic fracturing, can be detected using the normalized difference vegetation index (NDVI) map, computed on the ASTER image, and analyzing the topographic and morphometric features of the area. Moreover, observations in tunnel excavation stage showed that crossing through open fractures in hard and thick layers is the major cause of water inflow into the tunnel, which corresponds to the surface hydrogeological evidences obtained from the ASTER image.
* Corresponding author.
1- Introduction
Water leakage into tunnels and rock caverns is a major technical problem in underground constructions. Water seepage and inflows are time consuming and lead to economic damages. Several disastrous events in tunneling are associated with large volumes of local groundwater inflow through geological features such as fault zones and open fractures. Some of these geological features and its related disasters have been frequently reported from several tunnels on Iran, such as Long Zagros tunnel and Alborz tunnel and others countries [1]. Therefore, it is essential to have a reliable estimation of location and amount of groundwater inflows before excavation of tunnels. Using in-situ investigations, many researchers have tried to predict groundwater flow into rock tunnels during the last decades. It is difficult to use the in-situ investigations in border areas of Iran, because of the geopolitical constrains, land mine fields, rugged terrain, lack of roads, terrorists attacks and so on.
To overcome such problems and to reduce the cost and time of field work, remote sensing investigations can be a good solution. In fact, the remote sensing images can discriminate geological features as they have different morphologies. Some of the geological applications of remote-sensing analysis are fault detection and identification [2, 3], stratigraphic mapping [4] and lineament extraction [5]. Cuesta, as a geomorphic marker, is the main indicator for high local groundwater inflow into a rock tunnel is of.
Cuesta have been made as a result of the erosion and tectonic activities interaction. This is a good indicator for determination of lithology, thickness and brittleness of rock layers. In the present study, an attempt has been made to propose a methodology for detecting the geomorphic markers of cuesta in the reliable estimation of location high local groundwater inflow into Nosoud tunnel using the satellite imagery data. For
this purpose, a reflectance image of the Advanced Spaceborne Thermal Emission and Reflection Radiometer (ASTER) sensor was used.
The Advanced Spaceborne Thermal Emission and Reflection Radiometer (ASTER), which are aboard the Earth Observing System (EOS) TERRA platform, records solar radiation in 14 spectral bands. It measures reflected radiation in three bands in VNIR and in six bands in SWIR, with 15- and 30-m resolution, respectively [6]. ASTER also has a back-looking VNIR telescope with 15-m resolution. Thus, stereoscopic VNIR images can be acquired at 15-m resolution. In addition, emitted radiation is measured at 90-m resolution in five bands in the TIR. The swath width is 60 km, but ASTER’s pointing capability extends the total cross-track viewing capability to 232 km which can be used for generating digital-elevation models (DEM) [6].
2-Materials
2-1 Study area
In this paper, Nosoud tunnel, a supply water tunnel in a border region of west Iran, was studied. Figure 1 shows the location of this tunnel area. Moreover, Fig. 2 shows a color composite (bands 3, 2 and 1) of the ASTER image used in the study. Nosoud tunnel passes through hard and open fractured limestone with high local groundwater inflows. Along this tunnel, two discrete zones with local inflows of few up to 382 l/s have been recorded at km 6.5 and 8.5 in length. Observations during excavation suggest that open fractures in the limestone layers are the main reason for the high water inflow. The limestone thick layers outcrop in form of cliffs constituting the upper parts of the cuesta.
Fig. 1. Location of the study area
Fig. 2. A RGB color composite (bands 3, 2 and 1) of the ASTER image used.
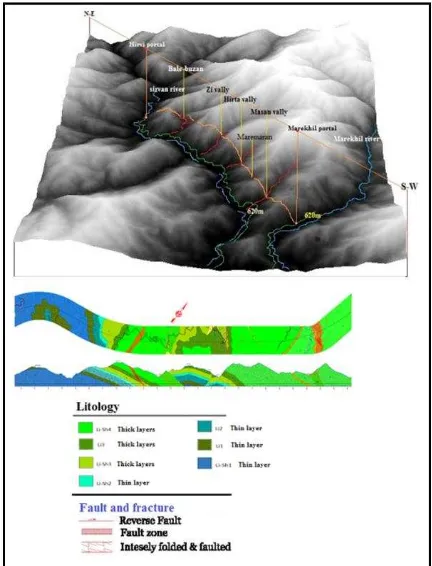
Sedimentary rocks including limestone and shale are the main lithology in the study area. Layer thicknesses were determined about 3 to 300 cm (layering) and more than 300 cm (clif) according to the classification presented in the Engineering Geology Field Manual (Fig. 3). The engineering geological units of the area were divided into four groups consisting of layered limestone Li, Li-Sh, fracteres and Crushed Zones (FZ1 and CZ2).
The important morphological features of the study area are cuesta ridge. Cuestas have a forehead, the cut-resistant layer making up the upper part of the cuesta cliff. Moreover, they have a mild slope and concave in the frontal heels, called subsequente (Fig. 4).
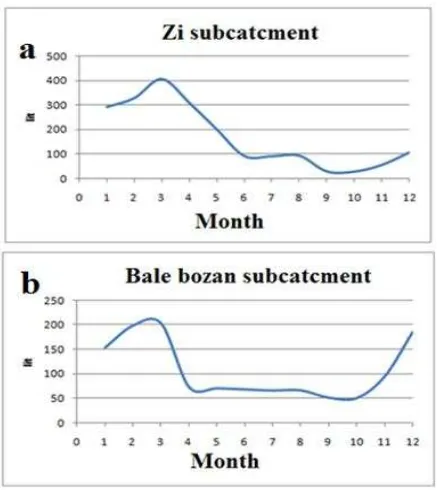
The highest amount of reported rainfall in the study area is 750 mm in March (Fig. 5). Hydrological study shows that Sirvan River is the general direction of groundwater and surface flow there. However, 26 springs are available in the study area. Most of these springs belong to Zi, hirta and bale bozan subcatchments. Also, all springs are located at an altitude higher than 630 m, which is the tunnel axis altitude. Figure 6 shows monthly changes in spring discharges for the subcatchment Zi and bale bozan. From Fig.5, flow rates in January and February are the greatest. Based on precipitation and springs discharge, water penetrating into underground (water nutrition) and the withdrawal of water from springs (groundwater discharge) in average take less than a month. This is due to fracture development and increasing the water flow rate in the subcatchments.
1
Fractures zone
2
Crushed zone
Fig 3. 3D location (top) and the geology map (down) of the Nosoud tunnel.
Fig 4. Structural and morphological characterization of cuesta in the study area.
Fig 5. The graph of monthly rainfall in the study area.
Fig 6. Monthly changes in spring discharge.
2-2 Methodology
Figure 7 shows the flowchart of research methodology used for detection of high local groundwater inflow to tunnel. The methodology includes three steps: i) Geological survey for generating a geology map of the study area, ii) processing the ASTER image to generate a DEM of the area as well as thematic maps of vegetation and geological structure features, cuesta ridge and faults, and iii) Overlaying the maps obtained from geological survey and ASTER image processing.
Our experiments show that the cuesta can be distinguished in decorrelation-stretch products of color–infrared standard images because of their albedo, color and textural characteristics. After image processing using the software ENVI, cuesta ridge is extracted. Also, slope derivatives of the digital elevation model (DEM) obtained from VNIR stereoscopic images enhance this photo-interpretative. Note that the vegetation map is obtained using index NDVI3 as follows:
) 1 (
where and are pixel reflectance values in the red band (band 2 ASTER) and near infrared (band 3 ASTER), respectively. In order to recognition of springs; the study procedure is to make a DEM, mapped drainage and subcatchment and traced flow direction of springs according to the spring's position. The vegetation index in the around and along the spring’s flow path was investigated in this way. In order to determination potential of satellite imagery to derive regional fault system type and orientation, a lineament map was drawn using the technique of automatic extraction lineaments. Automated method based on STA (Segment Tracing Algoritm) techniques [21] using PCI Geomatica software was applied to
3
Normalized Difference Vegetation Index
extract fractures. STA method based on highlight a line of pixels as an element of vector by local changes in the grey band digital photos. In this study, bands 1, 2, 3 and DEM model of aster were used. Eight hill shad models with Radiation angle of 30 degrees from horizontal and Azimuth of 10, 45, 90, 130, 180, 270, 240 and 320 degrees were obtained to extraction of lineaments.
Fig.7. Flowchart of research procedure.
3- Experimental results
Cuesta ridge have been developed in the study area and created a stepper landscape indicating the presence of hard thick layers (limestone) and soft thin layers (limestone and shale) sequence. Developments of the springs and fractures in the cliff forming unites were studied after detection and mapping of cuestas in the area (Fig. 8).
Fig 8. Cuesta map obtained in the study area
Plants growing around of springs located in these units indicate that there is a significant relationship between groundwater seepage and the vegetation density in the study area An useful indicator for groundwater seepage and spring formation is suitable growing conditions for plants with high greenness. To estimate the (probably)location of the springs, a possible map
of the spring’s distribution is prepared accompanied with a
(DR) determination for NDVI values. The results of statistical analysis of the estimation of the spring’s position are given in Fig. 9. According to NDVI index, the location and probability density of springs with a detection rate (DR) of 74% were drawn in Fig. 10.
Fig 9. The plot of NDVI pixels vs. the number of springs detected.
Fig 10. Location of possible springs
The structural features controlling groundwater in the area fault. The field study show that limstone units have pressure strength values more than 150 Mega Pascal. These brittle units, in respond to tectonic pressures, led to development of the faults. Also, shear displacement caused to abrupt changes in the slope and edge structure developing.
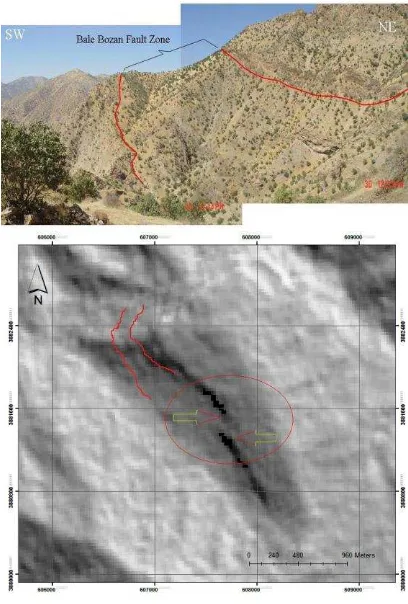
Experiments show that these changes are recognizable on ASTER image according to their steep slopes, NW-SE trends and sharp slope changes. They are associated with fractures on the ground surface due to displacement of the thick layer units of limestone. To study the effects of this displacement, the hill shade of the area was drawn with an azimuth radiation of 45° and a radiation angle of 30° inclination. The displacement effect of the cliff forming units in the bale bozan faulte zone is observable in the building hill shade models (Fig. 11).These
displacements are caused by formation of minor strike-slip fault branches. The map of lineations was prepared using the automatic extraction linement (Fig. 12a). There was appropriate conformity between lineaments and fault azimuths (Fig. 12).
Fig 11. Earthly image (up) of Bale bozan Fault zones and identified through hill shade (down).
Fig 12. Integrated mapping lineaments and faults in the study area.
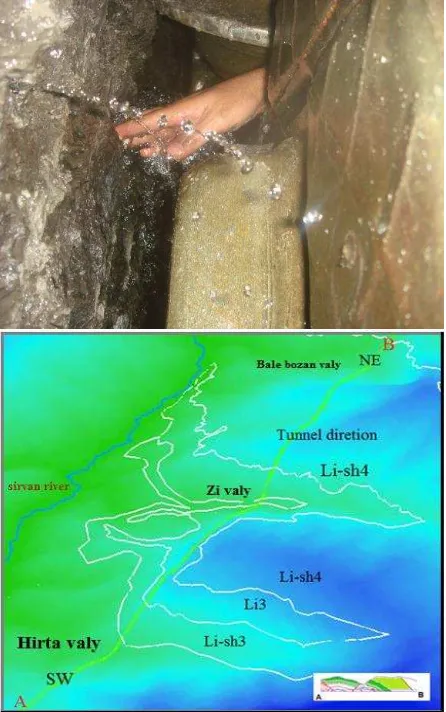
The results of integration of data layers geological map, spring distribution and faults show that the Li3 ، Li-Sh3and Li-sh4 units have the greatest potential in High Local Groundwater Inflow in the tunnel (Fig. 13). These unites constitute the cliff forming upper part of cuesta in the study area. According to drilling observations, the maximum value of water inflow in the tunnel in dealing with these units is 382 lit/s. The value of water inflow is directed into the tunnel through open fractures (Fig. 13).
Fig 13. Top: a view of the tunnel face and entrance of water through cracks. Down: 3D view of engineering geology units
Li3, Li-Sh3andLi-sh4 .
4- Conclusions
In this study, an experimental method using ASTER satellite images was used to predict the groundwater inflow into the Nousoud tunnel. The presence of fractures in thick layers of limestone was an efficient factor in conducting of groundwater seepage into the tunnel. To identify this factor, the probability distribution of springs, features of cuesta and faults using ASTER images were studied. The displacement caused by the presence of faults and edge structural appearance in hill shade model was a useful indicator to fracture detection in the region. Our experiments show that the cuesta can be distinguished in decorrelation-stretch products of color–infrared standard images because of their albedo, color and textural characteristics. Also, slope derivatives of the DEM obtained from VNIR stereoscopic images enhance this photo-interpretative. Moreover, NDVI
index with a detection rate of 74% was determined to identify the possible location of springs in the study area. The prediction of inflow groundwater into the tunnel in dealing with Li3, Li-Sh3 and Li-sh4 units indicated that data from satellite images are reasonable.
Acknowledgement
The authors would like to thank Mohammad Miri for helping to edit this paper.
References
[1] H.R. Zarei, A. Uromeihy, M. Sharifzadeh, 2011. Evaluation of high local groundwater inflow to a rock tunnel by characterization of geological features. Tunnelling and Underground Space Technology 26 (2011) 364–373
[2] Philip G (2007) Remote sensing data analysis for mapping active faults in the northwestern part of Kangra Valley, NW Himalaya, India. Int J Remote Sens 28(21):4745–4761
[3] Gloaguen R, Marpu P, Niemeyer I (2007) Automatic extraction of faults and fractal analysis from remote sensing data. Nonlinear Proc Geophys 14:131–138
[4] Bedini E (2009) Mapping lithology of the Sarfartoq carbonatite complex, southern West Greenland, using HyMap imaging spectrometer data. Remote Sens Environ 113(6):1208– 1219
[5] Kaya Ş, Müftüolu O, Tüysüz O (2004) Tracing the geometry of an active fault using remote sensing and digital elevation model: Ganos segment, North Anatolian Fault zone, Turkey. Int J Remote Sens 25(19):3843–3855
[6] Fujisada, H. (1995). Design and performance of ASTER instrument. Proceedings of SPIE, the International Society for Optical Engineering, 2583, 16– 25.