ALS AND TLS DATA FUSION IN CULTURAL HERITAGE DOCUMENTATION AND
MODELING
A.Fryskowska a *,P.Walczykowski a, P.Delis a M. Wojtkowska a
a
Department of Remote Sensing and Photogrammetry, Geodesy Institute, Faculty of Civil Engineering and Geodesy, Military University of Technology, Warsaw, Poland - (afryskowska, pwalczykowski, pdelis, michalina.wojtkowska)@wat.edu.pl,
Commission III, WG III/2
KEY WORDS: Airborne Laser Scanning, Data Fusion, Accuracy, Point Cloud, Heritage Documentation, 3D Transformation
ABSTRACT:
One of the most important aspects of documenting cultural heritage sites is acquiring detailed and accurate data. A popular method of storing 3D information about historical structures is using 3D models. These models are built based on terrestrial or aerial laser scanning data. These methods are seldom used together. Historical buildings usually have a very complex design, therefore the input data, on the basis of which their 3D models are being built, must provide a high enough accuracy to model these complexities. The data processing methods used, as well as the modeling algorithms implemented, should be highly automated and universal. The main of the presented research was to analyze and compare various methods for extracting matching points. The article presents the results of combining data from ALS and TLS using reference points extracted both manually and automatically. Finally, the publication also includes an analysis of the accuracy of the data merging process.
* Anna Fryskowska, [email protected]
1. INTRODUCTION
1.1.Purpose of experiments
An appropriate method of acquiring accurate and detailed data is an essential aspect when preserving information on cultural heritage structures. One such method of preserving three dimensional information on historical structures is a 3D model (Kolbe et al., 2009). The are many methods of generating 3D buildings models. Very popular is method using aerial imagery widely described in (Elberink i Vosselman, 2006), (Habib i in., 2006), (Frueh i Zkhor 2003), (Albert, 2003), (Brenner i in., 2003), (Wyngaerd, 2002), or (Chua, 1997).
One of the modern and highly accurate techniques used to acquire precise data for 3D modeling is terrestrial laser scanning (TLS). However, due to the shape, size and location of cultural heritage sites for example in narrow streets of old towns, it is often impossible to conduct terrestrial laser scanning measurements. In such situations, the top layers of the structures, including the roofs, should be complemented from other data. One possibility of completing these data in the upper layers of the structures is using aerial laser scanning (ALS) and integrating these two types of data. When integrating these data using relative registration based on a direct transformation of point sets to a common coordinate system (usually a global coordinate system defined by the ASL), the coordinates are recalculated using a predefined function, whose parameters are based on reference points, which are considered as the tie points or pseudo-homologous points. In this case, the main objective will be to determine these coordinates with the highest possible accuracy. Depending on what type of initial input data is available, two types of orientations can be distinguished: coarse orientation (a technique used for approximating transformations between data sets without known matching points) and detailed orientation (when the initial transformation or orientation parameters are known) (Csanyi i Toth, 2007). The paper
presents the results of combining TLS and ALS data using a historical synagogue building as an example. More details concern to this subject was published by authors in (Kedzierski, Fryskowska, 2014).
2. EXPERIMENT
The ScanStation2 laser scanner was used to acquire terrestrial geodata. Aerial data was obtained using a LSM LitteMapper laser scanning system, which includes an aerial Q580i Riegl laser scanner and aerial Hasselblat H-39 camera.
The subject of the study is the Nożyk Synagogue (pol. Synagogi
im. Małżonków Rywki i Zalmana Nożyków) located in Warsaw
(SYNAG). This building has a relatively complex structure. It has a multi-plane roof with numerous additional elements on it as well as many ornaments and decorations on the facade of the building (fig.1). Scanning was conducted from 6 positions. Registration of the point clouds from individual stations was done using a 9 target. The fitting accuracy of scans was below 1 cm.
The International Archives of the Photogrammetry, Remote Sensing and Spatial Information Sciences, Volume XL-5/W7, 2015 25th International CIPA Symposium 2015, 31 August – 04 September 2015, Taipei, Taiwan
This contribution has been peer-reviewed.
Figure 1. Section of the point cloud showing the entrance to the synagogue from an impulse terrestrial laser scanner
The average resolution of the point cloud was equal to 2.5cm. 2.1. Research problem
When dealing with historical buildings, automatic point extraction is usually much more complicated and ambiguous. Such structures usually have a very architecturally diversified elevation, many details, ornaments and embellishments, especially in the top layers of the buildings, where the roof meets the facade. Points located on the pillars and elements of Moorish ornamentation are the most unambiguous points to be identified on the surface of the synagogue building. Figure 2 shows an example of a corner of the synagogue building on both the aerial and terrestrial laser scanning data.
Figure 2. Corner of the synagogue building, A and B – ALS data, C – TLS
During the preliminary interpretation of the ALS data it is difficult to determine from which 'level' of the roof the laser beam was reflected. For example, the corner point marked C in figure 2 can be located either at the point marked no. 1 or 15. When working with the ALS data (2. A and B) is not possible to determine whether a point - vertex corresponds to a location on the lower or upper part of the dome without detailed verification. The classification of points in terms of correctness of the choice can be assessed visually and geometrically. For the final transformation, reference points were located on the roofs corners and were all located on decorations and embellishments. These points were appointed by means of three methods: direct-manual, semi-automatic using an approximation of edge points and automatic using a 3D model.
2.2. Research - point extraction - three methods
The simplest method of determining characteristic points is
using the ‘direct method’ i.e. manually. Determining the
coordinates of the corners of buildings can therefore be done by directly defining their position as the position of the extremes (vertices) within a set of points representing eg. the roof of the building.
This is a "point " approach based on real vertex points. Such an approach is not justified when working with an ALS point cloud which is characterized by a low density and having a small number of "neighbors". Determination of the edge points is, on the one hand, more unambiguous than in the case of TLS, but on the other hand, points selected using this method have low credibility - they maybe a classification error or a random point resulting from eg. a failure to unambiguously determine its correct position.
Characteristic points, such as the corners of the roof (roof hip intersections) and their coordinates can be determined automatically, eg. using 3D modeling tools. This will be named
‘automatic method’.
The basic approach to extracting these points ie. the corners of the roof, is to define and generate planes through approximated points representing specific parts of the building - the roof, walls and defining points of intersection of these planes. In order to accurately determine the location of the matching points, it is essential to establish, as truly as possible, the actual position of vertices in the given point cloud's coordinate system. If we assume that the vertex of the edge of the building / roof will always be closely associated with the edge and not the surface of the roof or wall, then it is reasonable to firstly locate the points which had been correctly classified as the edge, then to define straight lines and then to designate their point of intersection. This method use simply linear approximation and
further in the paper will be called ‘semi-automatic method’.
These three methods were used in further research work. Figure 3 shows the adopted identification for selected matching points.
Figure 3. Diagram of the SYNAG structure with characteristic points (roof peaks) numbered according to the adopted
identification
2.4. Research work - 3D transformations
Proper integration also requires an accurate transformation between coordinate systems. Thanks to the above analyses and the extraction of characteristic points, it was possible to select the desired matching points to perform the transformation. In such instances, two types of transformations can be used: conformal (linear) transformations and polynomial The International Archives of the Photogrammetry, Remote Sensing and Spatial Information Sciences, Volume XL-5/W7, 2015
25th International CIPA Symposium 2015, 31 August – 04 September 2015, Taipei, Taiwan
This contribution has been peer-reviewed.
transformations of higher orders. Analyses were conducted based on the conformal 3D transformation and affine transform. The following points were selected as matching points for the transformation: 18, 15, 16, 6, 24 and 11. Table 1 shows the mean errors of the transformations.
Table 1. The mean errors of the transformation for SYNAG structure
Based on analyses, it can be concluded that the overall transformation error was greatest for the method based on the 3D model and the linear approximation method regardless of the type of transformation. For this type of building, the greatest accuracies were obtained when reference points were selected manually.
For methods that are based on line approximation, the accuracy increased in the range of 10-30% on average, compared to the 3D model method. For each method of selecting matching points, the affine transformation gives the smallest errors.
3. RESULTS AND ACCURACY ASSESSMENT
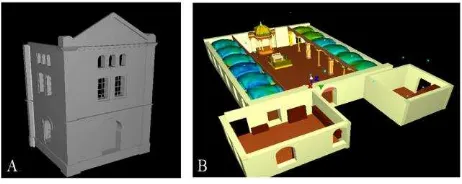
A 3D model was created from the combined data. Most often, the point clouds are modeled to the form of a solid 3D model of the building. A fragment of the model is shown in figure 4.
Figure 4. Fragment of the 3D model- synagogue building, A – part of the facade, B – interior
3D models are usually classified due to their level of detail, which is directly related to the density of points and the accuracy of the definition of the XYZ coordinates. An analysis of the 3D model was conducted based on data characterized by different resolutions. An analysis was made on how well the construction elements of the building and related facilities have been resolved and modeled. An approximate accuracy of the created models was determined based on statistical and comparative analyses (model - cloud, model - the area). For selected sections of the structure, 3D models of the interior were also made. An example of a 3D model of the interior of the synagogue building is given in fig. 4 B. The accuracy of the model depends on the chosen method and the density of the point cloud. In the presented case of the SYNAG building, the 3D model accuracy of the interior amounted to approx. 2 cm.
Typically the accuracy assessment is based on visual analysis. In order to analyze the geometrical models, reference data (direct measurements) was used and the differences between the 3D model and these reference data were determined. The accuracy of the resulting model is in the 8-12cm range for TLS data itself, and in the 15-23cm range for the model generated from the combines ALS and TLS data.
4. CONCLUSIONS
The accuracy of the combined data and resulting 3D models is a fundamental photogrammetry problem because apart from the input data itself, the methods of combining, filtering and modelling of the data have a huge affect on the accuracy of all 3D products. As a result of the study, it was concluded, that it is possible to integrate geodata from photogrammetric laser scanning systems for the purpose of developing accurate 3D models of cities. The accuracy of the 3D models built on the basis of laser scanning is related to the density of the point cloud : the more dense, the higher the accuracy of the product. ALS data should be characterized by a density of not less than 8-10 pts / m2. Terrestrial laser scanning has no such restrictions. The selection of appropriate algorithms to extract edge points is a key aspect of the later determination of characteristic points located at the corners of buildings.
ACKNOWLEDGEMENTS
This paper has been supported by the Military University of Technology, the Faculty of Civil Engineering and Geodesy, Department of Remote Sensing and Photogrammetry.
REFERENCES
Albert J., Bachmann M., Hellmeier A., 2003, Zielgruppen und
Anwendungen für Digitale Stadtmodelle und Digitale Geländemodelle. Erhebungen im Rahmen der SIG 3D der GDI, NRW.
Brenner C., Dold C., Julge K., 2003, Fusion, interpretation and combination of geodata for the extraction of topographic objects, Proceedings of the InternationalSociety for Photogrammetry, Remote Sensing and Spatial Information Sciences, (ISPRS Congress) 2003; Volume XXXIV, Part 3/W3. Csanyi N., Toth C., 2007, Improvement of lidar data accuracy using lidar-specific ground targets, Photogrammetric Engineering & Remote Sesning, 73(4), pp. 385-396.
Chua, C. J. R., 1997, Point signatures: A new representation for 3d object recognition, International Journal of Computer Vision 25(1), pp. 63–85.
Elberink S., Vosselman G., 2006, 3D Modeling of topographic objects by fusing 2D maps and lidar data, International Archives of Photogrammetry, Remote Sensing and Spatial Information Sciences, Vol. 36 (part 4).
Früh Ch., Zakhor A., 2003, Constructing 3D City Models by
Merging Aerial and Ground Views, IEEE Computer Graphics and Applications, Vol. 23, No. 6. (2003), pp. 52-61.
method
The International Archives of the Photogrammetry, Remote Sensing and Spatial Information Sciences, Volume XL-5/W7, 2015 25th International CIPA Symposium 2015, 31 August – 04 September 2015, Taipei, Taiwan
This contribution has been peer-reviewed.
Habib A., Cheng R., Eui-Myoung K., Mitishita E.A., Frayne R., Ronsky J.L., 2006, Automatic Surface matching for registration of LiDAR Data and MR Imagery, ETRI Journal, Vol. 28, No. 2, pp. 162-174.
Kedzierski, M.; Fryskowska, A., 2014, Terrestrial and Aerial Laser Scanning Data Integration Using Wavelet Analysis for the Purpose of 3D Building Modeling. Sensors 2014, 14, 12070-12092.
Kolbe T., Nagel K., Stadler A., 2009, CityGML – Standard in Photogrammetry, 52nd Photogrammetric Week in Stuttgart, September 7-11.
Wyngaerd, J.V., 2002, Automatic crude patch registration: Toward automatic 3D model building, Computer Vision and Image Understanding 87, pp. 8 –26.
The International Archives of the Photogrammetry, Remote Sensing and Spatial Information Sciences, Volume XL-5/W7, 2015 25th International CIPA Symposium 2015, 31 August – 04 September 2015, Taipei, Taiwan
This contribution has been peer-reviewed.