EXTENDING LKN CLIMATE REGIONALIZATION WITH SPATIAL
REGULARIZATION: AN APPLICATION TO EPIDEMIOLOGICAL RESEARCH
Alexander Liss a,*, Yulia R. Gel b, Alexandra Kulinkina a, Elena N. Naumova a,c
a Department of Civil and Environmental Engineering, Tufts University, Medford, USA ([email protected]) b University of Texas, Dallas, USA
c Friedman School of Nutrition Science and Policy, Tufts University, Boston, USA
Commission VIII, WG VIII/2
KEY WORDS: Remote Sensing, Geographic Information Systems, Environmental Health, Climate Classification, Geospatial Statistics
ABSTRACT:
Regional climate is a critical factor in public health research, adaptation studies, climate change burden analysis, and decision support frameworks. Existing climate regionalization schemes are not well suited for these tasks as they rarely take population density into account. In this work, we are extending our recently developed method for automated climate regionalization (LKN-method) to incorporate the spatial features of target population. The LKN method consists of the data limiting step (L-step) to reduce dimensionality by applying principal component analysis, a classification step (K-step) to produce hierarchical candidate regions using k-means unsupervised classification algorithm, and a nomination step (N-step) to determine the number of candidate climate regions using cluster validity indexes. LKN method uses a comprehensive set of multiple satellite data streams, arranged as time series, and allows us to define homogeneous climate regions. The proposed approach extends the LKN method to include regularization terms reflecting the spatial distribution of target population. Such tailoring allows us to determine the optimal number and spatial distribution of climate regions and thus, to ensure more uniform population coverage across selected climate categories. We demonstrate how the extended LKN method produces climate regionalization can be better tailored to epidemiological research in the context of decision support framework.
1. INTRODUCTION 1.1 Climate and health
Climate, climate change and adaptation are the issues of heightening concern in public health research. The effect of climate on human health and wellbeing in both developed and developing worlds is profound and multifaceted. The climate change affects vector borne and water borne diseases, food security and mental health (WHO (World Health Organization) 2009, World Meteorological Organization and World Health Organization 2015, Crimmins 2016) The impact could be direct or indirect, immediate or delayed, localized or widespread depending on causal, temporal and spatial aspect. For vector borne and water borne diseases the effects of climate change can be examined by better understanding habitat suitability for causal pathogens and their routes of transmission. For obvious reason the deteriorating effects of climate change and extreme weather on human health is likely to be best measured in locations with high population, better healthcare provision and monitoring. Recent studies show that the magnitude of the effect of extreme weather on human health and pathogen habitat depends on the baseline climate conditions, which may mitigate or aggravate the overall changes. Thus, the accurate climate regionalization is needed to accurately quantify and forecast such effects.
1.2 Climate regionalization
There are number of climate regionalization schemes exist. One of the well-known and often used regionalization schemes is Köppen-Geiger (KG) climate classification system. The KG climate classification system, developed in 1884 by the Russian/German climatologist Wladimir Köppen, is based on the
fundamental concept that regional climate can be defined by a prevalent phenology (Geiger and Pohl 1954, K̈ppen, Volken et al. 2011). However, due to the technological limitations in the pre-satellite era it was not possible to reliably define phenology over large and remote areas. Consequently, the temperature and precipitation were used as available proxies to determine regions with similar climate. While the KG climate classification is still actively and widely used to quantify climate variation (Chen and Chen 2013), the arbitrary nature of suggested parameters in KG climate classification system has been criticized (Thornthwaite 1943). Furthermore, this commonly used scheme does not account for population density and thus is not well suited for the tasks of capturing population-relevant properties.
1.3 Application of Satellite Remote Sensing to Climate Regionalization
remote sensing technology. For example, the Normalized Difference Vegetation Index (NDVI) (Carroll, DiMiceli et al. 2000) is defined as the ratio between the difference and the sum of the amount of sunlight reflected by vegetation canopy in the NIR and Red optical bands, respectively:
���� =��� − ���� + � (1)
The spectral characteristics of the NDVI index allow the differentiation of phenology and states of vegetation. The greater values of the index indicate healthier vegetation cover with vigorous growth while lower values indicate declining, stressed or dying vegetation. NASA, using data provided by Moderate-resolution Imaging Spectra-radiometer (MODIS) on board NASA's Terra and Aqua satellites, produces worldwide NDVI composites with 16 days overlapping temporal resolution and various spatial resolutions (LPDAAC-NASA 2000-2013).
1.4 LKN regionalization
Our recently proposed automated climate regionalization method called LKN-regionalization is based on k-means clustering algorithm over time-space (Liss et al. 2014). This method is using distributed NDVI scenes, which allow capturing both essential climate properties, and changes in climate patterns. The LKN method consists of the data limiting step (L-step) to reduce dimensionality by applying principal component analysis, a classification step (K-step) to produce hierarchical candidate regions using k-means unsupervised classification algorithm, and a nomination step (N-step) to determine the number of candidate climate regions using cluster validity indexes. Using comprehensive set of multiple satellite data streams, arranged as time series the method is capable of defining climate regions over large spatial extents. This is essential for large-scale epidemiological studies to account for geographic heterogeneity.
1.5 Objectives
In this study, we are extending LKN-method to incorporate the spatial features of target population by including a regularization term reflecting the spatial distribution of target population. We illustrate this extension with an example of climate Processes Distributed Active Archive Center (LP DAAC), USGS/Earth Resources Observation and Science (EROS) Center, Sioux Falls, South Dakota (LPDAAC-NASA 2000-2013). We arranged NDVI data so that it covers entire extent of our study region. Each of the two EOS satellites, Aqua and Terra, produced composites on overlapping 16 days schedule. By combining data streams from both satellites, it was possible to construct a time series with 8 days temporal resolution. The Vegetation Index data was aggregated in a layered space-time series. Normalized index allowed us to reduce or eliminate the effect of seasonally changing lighting conditions, thin clouds, atmospheric and anisotropic distortions. The water reflectance pattern differs significantly from almost any other land surface material by absorbing most of the incoming radiation. In order to avoid the misclassification due to the water reflectance pattern, the water bodies were masked for the analysis.
Population density raster for Africa was downloaded from WorldPop site (Worldpop 2015). It was clipped in ArcGIS to the extent of the NDVI data set.
2.2 Reducing correlation and clustering
The time series of 8-days NDVI rasters naturally has a very high degree of spatial and temporal correlation. Following the original LKN-methodology we reduced dimensionality and orthogonalized this data by applying Principal Component (PC) decomposition to original time series. We retained 12 components as per the original methodology.
The original methodology employs cluster analysis to define regions with similar climate. It aims to assign a finite set of labels (also known as categories or classes) to a very large number of multidimensional objects (pixels, representing a defined area on the ground in our case) based on their similarity. Conventional clustering algorithm given a set of n data point distributed over time t ��,� ∈ ��∗�seeks to minimize the clustering objective
2.3 Determination of the number of regions
The clustering algorithm requires that the number of climate regions to be specified a priori. The LKN method employs cluster validity index criterion to decide optimal number of regions. We extend this approach by using several cluster validity criterion and adding a regularization term penalizing number of regions formed. In general cluster validity criterion measures goodness of clustering. In commonly used cluster validity indexes compactness of the clusters are compared with the dispersion of the cluster centroids. We are using three generally employed cluster validity indexes, Calinski-Harabasz(Caliński and Harabasz 1974), Dunn(Dunn 1974) and Davies-Bouldin(Davies and Bouldin 1979). We have trivially transformed these indexes so that for each one of them the optimal solution seeks to minimize the validation criteria with respect to number of clusters. In addition to the cluster criterion we also added the regularization term ��−�. The validation criteria therefore becomes:
��� �� � �|� − ��−� (3)
where � �|� is the validity index for the clustering solution of the data set x with k regions, and � is a regularization constant.
2.4 Regionalization and population distribution
3. RESULTS 3.1 Regionalization
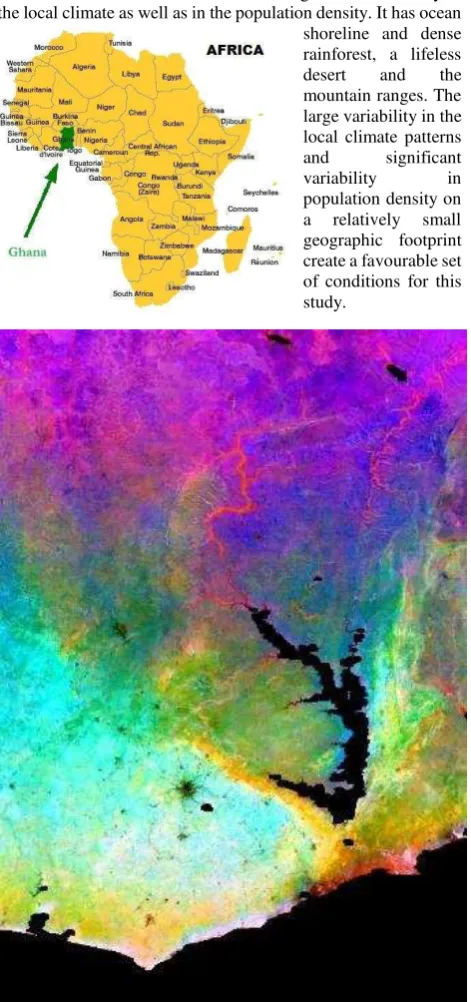
For this analysis, we studied the North West African country Ghana. Situated on the south shore of the West Africa’s Gulf of Guinea, and on the shores of the Lake Volta, one of the largest fresh water bodies in the World, it has a significant variability in the local climate as well as in the population density. It has ocean shoreline and dense rainforest, a lifeless desert and the mountain ranges. The large variability in the local climate patterns and significant variability in population density on a relatively small geographic footprint create a favourable set of conditions for this study.
We have downloaded 2760 MODIS tiles (h17v7, h17v8, h18v7 and h18v8), from the MOD13A2 and MYD13A2 collection. After pre-processing (mosaicking the tiles, extracting NDVI and QA SDSs, clipping to the study area, and re-projecting) the downloaded tiles, we performed principal component analysis as described in the method section. Top 12 principal components retained 96.9% of the total information in 46 components. The
pseudo-colour image of the first three principal components presented in Figure demonstrate a good separation of colours. The distinct spatial features can be clearly seen in that figure.
We proceeded by clustering the first 12 principal components using k-means clustering algorithm with a range of 2 to 28 classes. The validity of each clustering result was assessed by the Calinski-Harabasz cluster validity index. The index reaches minimum value at the � = . It also is minimized at � = 5 and
� = 5 regions, suggesting that these could also be considered as the candidate values (Figure 2).
Figure 2. Calinski-Harabasz index value
We have added the regularization term as described in the method section, and also included two additional cluster validity measures. The two added indices do not confirm the Calinski-Harabasz’s selection of the 3-region solution as a preferred one. Instead, with added regularization all three indexes concur, that the better overall solution to the climate regionalization are 8 or 15 clusters for the study area (Figure 3).
Figure 3. Regularized cluster validation criteria
3.2 Distribution of the population
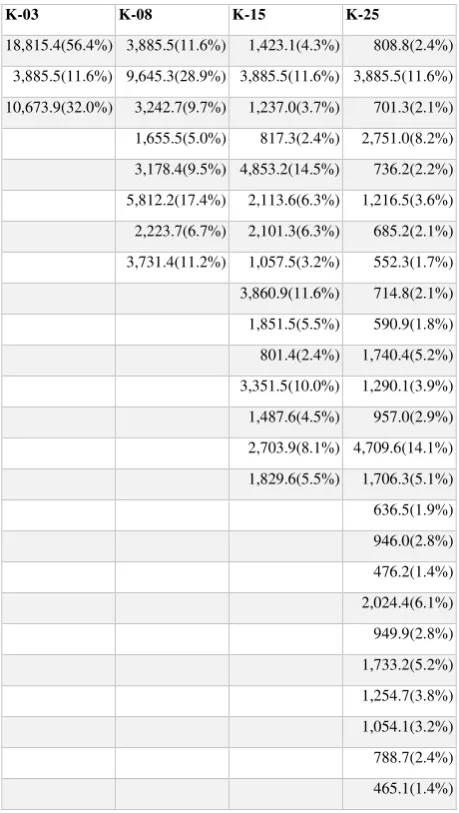
The population in the study region distributed very unevenly. The two major cities, Accra and Kumasi, account for nearly 20 percent of the total population of 33 million. In the Table 1 we aggregated number of people residing in each of the assigned climate region. For the first column, K-03, for example, there are three defined regions, with the distribution of population 56.5, 11.5 and 32.0 per cent (18.8, 3.9 and 10.7 million) respectively. It is clear that population is allocated very unevenly to these regions. Increasing number of regions to 8 and 15 (08 and K-15, respectively) as is suggested by the regularized ensemble of cluster validity indexes indeed creates a much more even distribution of the population and leads to a sharp decline in the population variance between the climate regions. The standard deviation of population counts across regions declines from 7.8 for 3 regions, to 2.5 to 1.4 for 8 and 15 regions, respectively Figure 1. Pseudo-color image of the first three principal components Figure 1.Pseudo-color image of the first three principal
Table 1. Population distribution across 3, 8, 15 and 25 climate regions
K-03 K-08 K-15 K-25
18,815.4(56.4%) 3,885.5(11.6%) 1,423.1(4.3%) 808.8(2.4%)
3,885.5(11.6%) 9,645.3(28.9%) 3,885.5(11.6%) 3,885.5(11.6%)
10,673.9(32.0%) 3,242.7(9.7%) 1,237.0(3.7%) 701.3(2.1%)
1,655.5(5.0%) 817.3(2.4%) 2,751.0(8.2%) health, climate change adaptation, and it affects many facets of human life. The ability to detect differences in the climate and the pattern of change of the climate is important and is a subject of a growing body of research. Using an automated method to define climate regions based on the satellite remote sensing data allows uniform definition of regional climate patterns. Furthermore, it allows adapting climate regions to the effects of climate change. We have demonstrated, that by using regularization it is possible to adjust climate regionalization to address needs of epidemiological and public health research. This allows for the tailoring of the regions to the specific discipline, without losing the generality of the LKN methodology.
It is also worth noting that there are several hyper-parameters in this methodology, that may require further study and tuning to the specific areas of interest and the requirements of the research protocol. The number of components extracted from the PCA decomposition, type of the cluster indexes used and the voting methodology for the selection of the suitable number of regions,
and the strength of regularization require additional research to utilize their potential to the fullest.
Future directions. This study is part of our larger effort to assess and evaluate the effect of extreme weather and climate on US elderly residents. We have studied Ghana as a pilot site. Ghana has sufficient diversity in its climate and population density. At the same time it is substantially smaller than Continental United States both in size and population count which made it an ideal site for the development and testing of regionalization methodology.
5. CONCLUSION
We demonstrated the applicability of LKN methodology in application to another region with different climate and demographic patterns. Suggested enhancements and regularization term allows more robust determination of the climate regions. Further study into hyper-parameter determination is required to facilitate integration of this methodology in the wider context of decision support framework
ACKNOWLEDGEMENTS
This study was in part supported by the Tufts Institute for Innovation. Authors thank the School of Engineering, Tufts University for travel support to present preliminary results at scientific conferences. All statements of fact, opinion, or analysis expressed are those of the author and do not reflect the official positions or views of any U.S. Government agency. Nothing in the contents should be construed as asserting or implying U.S. Government authentication of information or endorsement of the author’s views.
REFERENCES
Caliński, T. and J. Harabasz (1974). "A dendrite method for cluster analysis." Communications in Statistics 3(1): 1-27. Carroll, M. L., C. M. DiMiceli, R. A. Sohlberg and J. R. G. Townshend (2000). MODIS Normalized Difference Vegetation Index. University of Maryland.
Chen, D. and H. W. Chen (2013). "Using the Köppen classification to quantify climate variation and change: An example for 1901–2010." Environmental Development 6(0): 69-79.
Crimmins, A., J. Balbus, J.L. Gamble, C.B. Beard, J.E. Bell, D. Dodgen, R.J. Eisen, N. Fann, M.D. Hawkins, S.C. Herring, L. Jantarasami, D.M. Mills, S. Saha, M.C. Sarofim, J. Trtanj, and L. Ziska, Eds. (2016). The Impacts of Climate Change on Human Health in the United States: A Scientific Assessment. Washington, DC, U.S. Global Change Research Program: 312 pp.
Davies, D. L. and D. W. Bouldin (1979). "A Cluster Separation Measure." Pattern Analysis and Machine Intelligence, IEEE Transactions on PAMI-1(2): 224-227.
Dunn, J. C. (1974). "Well-Separated Clusters and Optimal Fuzzy Partitions." Journal of Cybernetics 4(1): 95-104.
Geiger, R. and W. Pohl (1954). "Eine neue Wandkarte der Klimagebiete der Erde nach W. Köppens Klassifikation (A New Wall Map of the Climatic Regions of the World According to W. Köppen's Classification)." Erdkunde 8(1): 58-61.
LPDAAC-NASA (2000-2013). MODIS VEGETATION DATA (MOD13 and MYD13). N. L. P. D. A. A. Center. Sioux Falls, South Dakota, NASA.
Thornthwaite, C. W. (1943). "Problems in the Classification of Climates." Geographical Review 33(2): 233-255.
WHO (World Health Organization) (2009). Improving Public Health Responses to Extreme Weather/Heat-Waves— EuroHEAT: Technical Summary. Copenhagen Ø, Denmark, WHO Regional Office for Europe: 70 pp.
World Meteorological Organization and World Health Organization (2015). Heatwaves and health: guidance on warning-system development: 114.