USE OF COURSE-EMBEDDED PROJECTS
FOR PROGRAM ASSESSMENT
Beverly L. Krilowicz1 and Timothy Downs2
1Depa rtm ent of Biology a nd Microbiology a nd 2Division of Aca dem ic Affa irs, Ca lifornia Sta te University, Los Angeles, Ca lifornia 90032
T
here is increasing demand on science faculty to develop authentic assessment measures for both individual courses and undergraduate programs. We report here on a quarter-long group project used in a neurophysiology course that can be used for either purpose. Small groups of four to five students critically analyze at least 10 articles from the primary scientific literature. The end result of this process is the equivalent of a scientific review article that is presented in two formats, a 10-min oral presentation and a scientific poster presentation. Students perform better on application tasks than on analysis, synthesis, or evaluation tasks associated with the project (P, 0.025) and generally respond positively to process questions (59–82%) but less positively to task questions (36–76%) about group dynamics. The cognitive skills and basic content knowledge required to complete this project are developed throughout the undergradu-ate program. Thus the project is a type of culminating program experience. However, the project also assesses basic course proficiency, because students cannot analyze primary neuroscience research without an understanding of neurophysiological prin-ciples.AM. J. PHYSIOL. 276 (ADV. PHYSIOL. EDUC. 21): S39–S54, 1999.
Key words:authentic assessment; embedded assessment; undergraduate science educa-tion; cognitive tasks associated with science projects; student self-report of group process
There is increasing demand on science faculty to develop authentic assessment measures for both indi-vidual courses and undergraduate programs, i.e., to develop measures of student performance in ‘‘real-life situations’’ (1–3, 7–10). The culmination of most practicing scientists’ work is its communication to colleagues and the lay public. In general, original scientific research is first communicated as a profes-sional conference presentation. Posters are an increas-ingly popular venue for these presentations, whereas 10-min oral ‘‘platform’’ presentations are the tradi-tional communication format. Consequently, senior natural sciences students are thought to benefit signifi-cantly from an exposure to the culture of professional scientific communication by participation in a mock
scientific conference before graduation from under-graduate programs and entry into the workforce. In addition, this requirement provides an ideal opportu-nity for assessment of student performance in an authentic setting.
Graduates with majors in the natural sciences are increasingly exposed to group work environments, either in the traditional laboratory setting or in more modern health care settings (1, 8, 10). Consequently, experiences that encourage the development of group interaction skills will benefit these students as they move into the workforce. Evaluation of these skills as part of an organized program assessment plan pro-vides feedback regarding the extent to which a
program is aiding students in development of these critical career-related skills.
We report here on a quarter-long small group project in use since 1992 in a senior-level neurophysiology course that provides an opportunity for authentic assessment of learning in both the course and the undergraduate program. The assessment data are generated within the framework of the course and are used for overall program assessment but are also used to help assign final course grades. The cognitive skills and basic biological content knowledge required to complete the course project are developed through-out the undergraduate program. Thus the project is a type of culminating or capstone program experience that can be used for program assessment. However, the project also assesses basic course proficiency, because students cannot complete the project with-out an understanding of basic neurophysiological principles.
PROCEDURE
Student Pr oject Pr otocol
Assignment of students to gr oups. Students are assigned to groups (n 54–5 students) by the course instructor. Factors such as class standing, academic major, and grades in prerequisite courses are used to produce balanced groups with no prior history. Group assignments are announced at the beginning of the second week of the quarter, once the final class enrollment has been established.
Pr oject description and assessment criteria. Stu-dents receive a detailed description of the project requirements on the first day of class. This material is supplied as a part of the course syllabus. Briefly, groups critically analyze 10 or more research publica-tions from the primary neuroscience literature, synthe-size these papers into a scientific review article, and then communicate their findings in two media, a scientific poster presentation and a 10-min oral presen-tation. Students are also supplied by the ninth week of the quarter with the detailed grading criteria used to assess the project (APPENDIXES AandB).
Intr oduction to team lear ning and establishment of peer evaluation criteria. One lecture period is used to acquaint students with basic principles of
small group communication and team learning (4). The groups are then given time in class to establish task and process criteria for peer evaluations. The class instructor provides input on these criteria, and students modify their drafts before submission of the final evaluation forms. This is the first task that the students perform as a group, and it begins the establish-ment of a group identity. The final evaluations of group members are due at the end of the quarter and constitute 10% of the final course grade. Task and process criteria used by the groups are summarized in Tables 1 and 2.
Library ex er cise. The second task that the groups perform is a library exercise designed to1) ensure that all students understand the use of on-line scientific bibliographic databases and2) continue the process of group building. Students are prepared for the exercise by library personnel, who provide hands-on
TABLE 1
Task criteria used for peer evaluations
Criterion
Attend group meetings (8) Complete tasks in timely manner (7) Research articles (7)
Involved in discussion at group meetings (6) Help in assembly of poster (6)
Help to write, edit, type poster (5) Attend final class meeting (4) Summarize articles (4) Teach other group members (1) Help in choosing poster topic (1)
Number of groups out of total of 9 groups that used each criterion is indicated in parentheses.
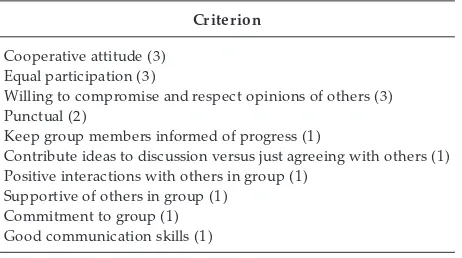
TABLE 2
Pr ocess criteria used for peer evaluations
Criterion
Cooperative attitude (3) Equal participation (3)
Willing to compromise and respect opinions of others (3) Punctual (2)
Keep group members informed of progress (1)
Contribute ideas to discussion versus just agreeing with others (1) Positive interactions with others in group (1)
Supportive of others in group (1) Commitment to group (1) Good communication skills (1)
Number of groups out of total of 9 groups that used each criterion is indicated in parentheses.
TABLE 3
Application tasks 50 43.7 87.4
Title: appropriate
length/de-scriptive 5 5 (0) 100
Introduction: 2–3 paragraphs 3 3 (0) 100 Introduction: uses references 3 2 (0.3) 66.7 Research description: figures/
tables from 6–10 papers 8 5 (0.9) 62.5 Research description:
refer-ences articles 4 3.6 (0.3) 90 Research description: majority
of poster 4 4 (0) 100
Summary:,1 page 3 3 (0) 100
References: lists at least 10
primary articles 6 5.4 (0.3) 90 References: citations in
approved format 2 1.9 (0.1) 95 References:
alphabetical/num-bered 2 1.8 (0.1) 90
General: approved
organiza-tion 2.5 2.3 (0.1) 92
General: readability 2.5 2.2 (0.2) 88 General: mechanics 2.5 2.2 (0.2) 88 General: no larger than 334 ft 2.5 2.3 (0.2) 92 Analysis and synthesis tasks 25.5 20.9 82.0
Introduction: gives general
background 3 2.9 (0.1) 96.7
Research description:
describes methods 8 5.8 (0.7) 72.5 Research description:
interpre-tation of figures 8 6.4 (0.6) 80 Research description: groups
similar results 4 3.4 (0.3) 85 General: paraphrases/no direct
quotes 2.5 2.4 (0.1) 96
Evaluation tasks 22 16.7 75.9
Introduction: how fits into
neuroscience? 3 2.9 (0.1) 96.7 Introduction: states hypothesis 3 2.3 (0.4) 76.7 Research description:
subsec-tion conclusions 4 2 (0.6) 50 Summary: draws general
con-clusions 6 5.4 (0.4) 90
Summary: do results support
hypothesis? 6 4.1 (0.8) 68.3
Other tasks: aesthetics 2.5 2.5 (0) 100
Total score 100 84.1 (3.6) 84.1
Grading criteria are arranged according to cognitive skill level for poster presentations, total points possible for each criterion, and mean (X), standard error (SE), and percentage possible points achieved for each criterion (n59 groups).
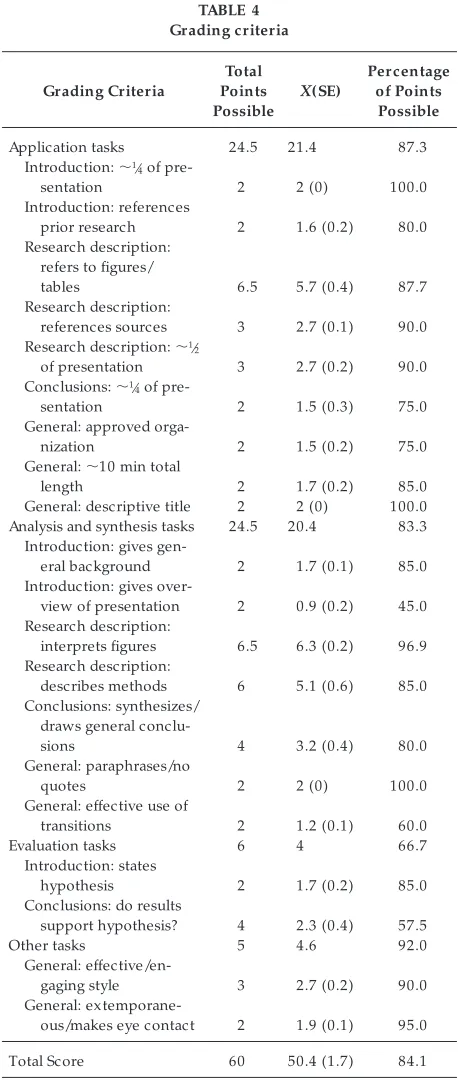
TABLE 4
Application tasks 24.5 21.4 87.3 Introduction:,1⁄4of
pre-sentation 2 2 (0) 100.0
Introduction: references
prior research 2 1.6 (0.2) 80.0 Research description:
refers to figures/
tables 6.5 5.7 (0.4) 87.7
Research description:
references sources 3 2.7 (0.1) 90.0 Research description:,1⁄2
of presentation 3 2.7 (0.2) 90.0 Conclusions:,1⁄4of
pre-sentation 2 1.5 (0.3) 75.0
General: approved
orga-nization 2 1.5 (0.2) 75.0
General:,10 min total
length 2 1.7 (0.2) 85.0
General: descriptive title 2 2 (0) 100.0 Analysis and synthesis tasks 24.5 20.4 83.3
Introduction: gives
gen-eral background 2 1.7 (0.1) 85.0 Introduction: gives
over-view of presentation 2 0.9 (0.2) 45.0 Research description:
interprets figures 6.5 6.3 (0.2) 96.9 Research description:
describes methods 6 5.1 (0.6) 85.0 Conclusions: synthesizes/
draws general
conclu-sions 4 3.2 (0.4) 80.0
General: paraphrases/no
quotes 2 2 (0) 100.0
General: effective use of
transitions 2 1.2 (0.1) 60.0
Evaluation tasks 6 4 66.7
Introduction: states
hypothesis 2 1.7 (0.2) 85.0
Conclusions: do results
support hypothesis? 4 2.3 (0.4) 57.5
Other tasks 5 4.6 92.0
General:
effective/en-gaging style 3 2.7 (0.2) 90.0 General:
extemporane-ous/makes eye contact 2 1.9 (0.1) 95.0
Total Score 60 50.4 (1.7) 84.1
Grading criteria are arranged according to cognitive skill level for oral presentations, total points possible for each criterion, and mean (X), standard error (SE), and percentage possible points achieved for each criterion (n59 groups).
training in the library’s electronic classroom. The training session occurs during a regularly scheduled class period, and the group assignment is due 1 wk later.
Selection of poster topic.The third task that groups perform is the selection of a poster topic. The instruc-tor supplies a list of potential topics, but students are encouraged to suggest others. Topic choices and one supporting article are due the fourth week of the quarter. The next class period is used for meetings between the instructor and the groups to approve or modify the topics.
Pr oject outlines.A detailed outline of the project is due at the beginning of the eighth week of the quarter. Primary literature used to develop the outline is submitted at the same time. The remaining class periods for that week are used for meetings between the instructor and the groups. The meetings are used to discuss the appropriateness of the literature refer-ences submitted by the group and the organization
and content of the proposed outlines. Suggestions for improvement of the project outline are made by the instructor at this meeting. In addition, the students have an opportunity, as a group, to ask questions of or engage in discussion with the instructor.
Final pr oject pr esentations.The final examination period is used for the presentation of the final class projects. The first 1.5 h are used for oral presentations. Each group has 10 min to present its project to the class. Usually, one or two people are chosen by the group to make this presentation. The presentations are assessed by the instructor according to previously distributed criteria (APPENDIX B). The final hour of class is used for a ‘‘scientific conference poster session,’’ where guests from the university community are invited to browse through the posters and ask ques-tions of all group members or engage the authors in discussion. The posters are submitted to the instructor at the end of the scientific conference poster session and are assessed according to previously distributed criteria (APPENDIX A).
FIG. 1.
Student r esponses (n544) to survey question r equesting infor mation about prior ex perience conducting library
r esear ch using computer databases.
Faculty Assessment Pr otocol
Pr ogram and course assessment based on stu-dent surveys.Indirect assessment of student accom-plishment was achieved in spring 1997 with student surveys. Students were surveyed three times during the quarter, at the beginning of week 2 before the ‘‘team learning’’ lecture was given and work in groups had begun (early quarter survey), about midway through the quarter after the detailed outlines for their projects were due (midquarter survey), and at the final class meeting when the final projects were due (end of quarter survey). The early quarter survey contained five questions that assessed prior preparation in the undergraduate program for carrying out complex projects and provided a type of overall assessment of the undergraduate program (APPENDIX C, questions 1–5). Answers to these questions were tabulated and are presented in graphic form (see Figs. 1–5).
All surveys contained questions that assessed the students’ attitudes toward the group process and
provided assessment of the effectiveness of the course interventions at improving group work skills (APPENDIX C, questions 6–10). The questions from the early
quarter survey were phrased slightly differently for the midquarter and end of quarter surveys. The rephras-ing of questions was designed to allow determination of the effect of this course, versus previous experi-ences, on the students’ attitudes toward group work. For example, the question ‘‘I enjoy working on graded projects in small groups,’’ which appeared on the early quarter survey, was changed on the midquarter survey to ‘‘I am enjoying working on this graded small group project,’’ and to ‘‘I enjoyed working on the neurophysiology small group project’’ for the end of quarter survey. Answers to these questions were tabulated and presented in graphic form (see Figs. 6–10). The response distributions obtained from the three surveys were then compared using the Kruskal-Wallis one-way ANOVA followed by Ryan’s procedure (6). Differences were considered statistically signifi-cant atP,0.05.
FIG. 2.
Student r esponses (n 5 44) to survey question r equesting infor mation about prior ex perience with primary
scientific literatur e.
Pr ogram and course assessment based on dir ect assessment of student lear ning.The direct assess-ment of student learning was accomplished in spring 1997 by creating specific grading criteria for both the oral and poster presentations (APPENDIXES A and B).
Each criterion was then assigned to a cognitive skill domain according to Bloom’s taxonomy (Tables 3 and 4; Ref. 5). The grading criteria were sorted into three cognitive skill levels: application tasks, analysis and synthesis tasks, and evaluation tasks. Application tasks were defined as those that required use of abstractions in concrete situations (5). For example, the criterion for assessing the title was that it be ‘‘an appropriate length and descriptive of research results to be dis-cussed.’’ Students were required to use this abstract statement and to produce a title that suited their project. Analysis and synthesis tasks were defined as those that broke a communication down into the constituent elements and arranged the elements to produce a new structure (5). These tasks are separate in Bloom’s taxonomy (analysis tasks are those that
break a communication into its constituent elements, and synthesis tasks are those that arrange the elements to produce a new structure) but were grouped to-gether in this project because it became impossible to separate them. For example, one assessment criterion for the Introduction was ‘‘gives a general background to the topic.’’ To accomplish this task, students needed to break scientific literature into its main points, an analysis task, and then arrange these points to form their Introduction, a synthesis task. Evaluation tasks were defined as those that required the student to make a judgment (5). For example, one criterion for assessment of the Conclusions section was ‘‘states whether results support or refute the original hypoth-esis/model,’’ which requires a judgment on the part of the student.
Overall program assessment was accomplished by use of combined class data to assess general performance by advanced students on specific tasks associated with
FIG. 3.
Student r esponses (n543) to survey question r equesting infor mation about class standing and prior ex perience
with scientific writing.
the projects. The mean, standard error, and percent-age of possible points for each assessment criterion forn 59 groups were calculated. The Kruskal-Wallis one-way ANOVA (6) was then used to compare performance, measured as the percentage of possible points attained, on application, analysis and synthesis, and evaluation tasks. Poster presentation data were analyzed separately from oral presentation data. These ANOVA did not reach statistical significance (P . 0.05). Consequently, the data from the oral and poster presentations were combined, as were the task catego-ries. A Mann-Whitney U-test (6) was then used to compare performance on application tasks to perfor-mance on the higher-order analysis, synthesis, and evaluation tasks. Differences were considered statisti-cally significant atP,0.05.
In addition, the scores received by individual students on the projects were used to help assign final grades in the class (n 544). That is, the group project grades
were used for partial assessment of each individual student’s performance in the course.
RESULTS
Pr ogram Assessment Based on Student Surveys
The students’ responses to survey questions address-ing prior program experiences indicated that they were well prepared to undertake this advanced project. The majority of students had some experience with scientific databases (Fig. 1; 40 of 44 students), knew what the primary scientific literature was (Fig. 2; 41 of 44 students) and had made use of it in a previous course (Fig. 2; 34 of 43 students), had completed an upper-division writing course that required them to write a scientific review article (Fig. 3; 25 of 44 students), and had some experience with oral presen-tation of scientific information (Fig. 4; 30 of 44 students) but little experience with the poster
presen-FIG. 4.
Student r esponses (n 5 44) to survey question r equesting infor mation about prior ex perience with oral
pr esentation of scientific infor mation.
tation format (Fig. 5; 23 of 44 students had no experience).
Course Assessment Based on Student Surveys
Students’ responses to survey questions about the group process were surprisingly positive. The major-ity of students answered ‘‘agree’’ or ‘‘strongly agree’’ to the question about their overall enjoyment of the group process (Fig. 6; 59–73%), their satisfaction with work outcomes (Fig. 7; 66–82%), and their percep-tions about interacpercep-tions in the group (Fig. 8; 75–81%). Their responses to group process questions were not influenced by their involvement in this course project (P.0.05, Kruskal-Wallis one-way ANOVA).
More complex and interesting results were obtained with survey questions that addressed task issues dealing with workload. At midquarter the students’ responses to the question about even distribution of work assignments were significantly more positive than at the beginning of the quarter (P , 0.02, Kruskal-Wallis one-way ANOVA followed by Ryan’s
procedure). Seventy-six percent of student responses were positive at the midquarter survey, whereas only forty-eight to fifty-seven percent of responses were positive at either the early or end of quarter surveys (Fig. 9). Similar results were obtained with the ques-tion about equal participaques-tion by all group members (P , 0.03, Kruskal-Wallis one-way ANOVA followed by Ryan’s Procedure). Sixty percent of student re-sponses were positive at the midquarter survey, whereas only thirty-six and forty-eight percent of responses were positive at the early and end of quarter surveys, respectively (Fig. 10).
Pr ogram and Course Assessment Based on Dir ect Assessment of Student Lear ning
Generally, students performed better on application tasks than on higher-order analysis and synthesis tasks (Tables 3 and 4). Students received 87.4 and 87.3% of the possible points on application tasks associated with the poster and oral presentations, respectively. In contrast, they received only 82 and 83.3% of the possible points on analysis and synthesis tasks and
FIG. 5.
Student r esponses (n544) to survey question r equesting infor mation about prior ex perience with scientific poster
pr esentations.
75.9 and 66.7% of the possible points on evaluation tasks associated with poster and oral presentations, respectively. However, we could not show a statisti-cally significant difference without combining data from both projects and then comparing performance on the application tasks to that on the combined analysis, synthesis, and evaluation tasks [89% of avail-able points on application tasks (n523 tasks) vs. 79% of available points on analysis, synthesis and evalua-tion tasks (n 519 tasks); P, 0.025, Mann-Whitney U-test].
DISCUSSION
Overall, the students’ answers to the survey questions (Figs. 1–5) indicate that their undergraduate program prepared them well for performing the types of complex projects that will be required of them as professional scientists or health care providers (1–3, 7–10). Most students had received some training in
the use of scientific databases, had prior exposure to the primary scientific literature, had completed their junior-level discipline-specific writing course in which they were required to write a scientific review article, and had some experience with oral presentation of scientific information. In contrast, during this course most students were exposed for the first time to communication of scientific information in the poster format. These survey results suggest that the early years of the undergraduate program are providing adequate opportunity for students to develop the skills needed to excel in the more complex, authentic assignments that are encountered in the senior year.
The students’ performance on the poster (Table 3) and oral (Table 4) presentations reinforce the self-report survey data that students are well prepared for performance of career-level tasks. The overall goal of the neurophysiology project was to produce a review
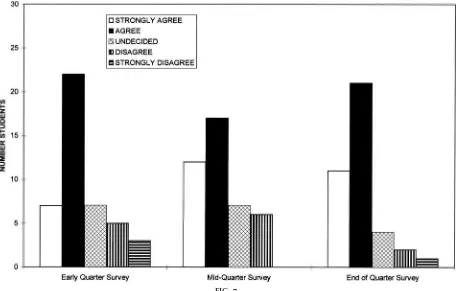
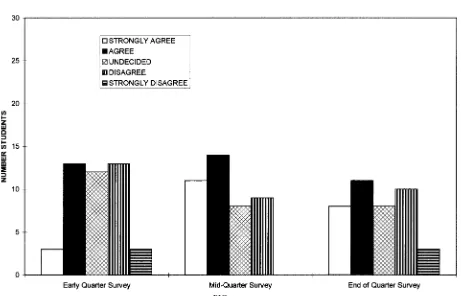
FIG. 6.
Student r esponses to early quarter (n544), midquarter (n542), and end of quarter (n540) survey questions
asking whether student ‘‘enjoyed working on graded pr ojects in small gr oups.’’ Ther e was no significant effect of
the time the survey was conducted on r esponse distributions (PG0.05, Kruskal-Wallis one-way ANOVA). Positive
r esponses: 59–73%; undecided r esponses: 17–30%; negative r esponses: 10–11%.
of the primary literature on a topic of current interest in neuroscience that was presented in both poster and oral forms. Tables 3 and 4 indicate that even the simplest of tasks associated with these assignments were relatively complex application tasks, i.e., level 3 in Bloom’s taxonomy of cognitive skills, with 1 the lowest and 6 the highest (5). Consequently, the students’ performance on the poster and oral presenta-tions, receiving 84.1% of the possible points, indicates that advanced students are prepared to undertake and excel in the execution of extremely complex, cogni-tively demanding, authentic assignments.
The current study is the first in the higher education science literature to present data on student achieve-ment on an authentic assessachieve-ment task categorized as a function of cognitive skill level (Tables 3 and 4). Other researchers have described authentic, open-ended assignments (7, 8, 10), have reported student re-sponses to the assignments (10), and have used final
grades to document increased student learning in a course that used traditional examinations plus portfo-lios as course assessment tools instead of just examina-tions (3). However, none of these studies attempted to determine the cognitive skills required of students and their performance levels when engaged in the learn-ing process.
The results of this study have implications for under-graduate program design. For example, students per-formed better on application tasks than on analysis, synthesis, and evaluation tasks associated with this assignment. If the program faculty determine that performance on the higher-order cognitive tasks should be better than reported here, they will need to think about the introduction of exercises requiring such skills at the introductory and sophomore/junior levels.
Overall, the students were remarkably positive about involvement in group projects (Figs. 6–10). Most
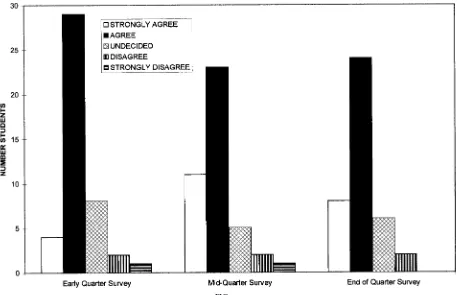
FIG. 7.
Student r esponses to early quarter (n544), midquarter (n542), and end of quarter (n539) survey questions
asking whether student ‘‘was satisfied with the work outcomes for gr oup pr ojects.’’ Ther e was no significant effect
of the time the survey was conducted on r esponse distributions (PG0.05, Kruskal-Wallis one-way ANOVA). Positive
r esponses: 66–82%; undecided r esponses: 10–17%; negative r esponses: 8–18%.
students answered in the affirmative to process ques-tions about group work (59–82%). The response distributions did not change significantly during the quarter, suggesting that involvement in the current group project did not change students’ positive atti-tudes toward the process of group work. In contrast, response distributions to task questions regarding group work were significantly influenced by involve-ment in the current project (Figs. 9 and 10). At the beginning of the quarter, about one-half of the stu-dents felt that work assignments had been evenly distributed and 36% felt that there had been equal participation by all group members in prior work groups. Their involvement in the neurophysiology group project had a positive effect on their perception of group task issues, with 76% responding that work assignments were evenly distributed and 60% believ-ing that all members were participatbeliev-ing equally at midquarter. However, by the last day of the quarter, responses to task questions had returned to the lower
early quarter survey levels, with only about one-half of the students leaving the course believing that work assignments had been evenly distributed and 48% feeling that all members of the group had participated equally. What is not clear is whether this pattern is normal in the group process or whether there is something instructors can do to keep the positive responses at the higher midquarter survey level. It is possible that the 10-wk quarter was not a long enough period of time to allow students inexperienced in the group process to work through conflicts associated with complex decision making (4). Future experience with the group process may produce individuals who are more efficient at conflict resolution (4) and retain a more positive attitude about group task issues.
Prior science education research has addressed the importance of exposing undergraduate students to group projects in preparation for professional careers (8, 10). However, only Wright (10) reports on student
FIG. 8.
Student r esponses to early quarter (n544), midquarter (n542), and end of quarter (n540) survey questions
asking whether ‘‘interactions in assigned work gr oups have been positive.’’ Ther e was no significant effect of the
time the survey was conducted on r esponse distributions (P G0.05, Kruskal-Wallis one-way ANOVA). Positive
r esponses: 75–81%; undecided r esponses: 12–18%; negative r esponses: 5–7%.
responses to a questionnaire regarding the group process. The mean scores on nine questions submit-ted to students at the end of a semester-long analytical chemistry course ranged from 4.5 to 3.2 on a scale of 1 to 5 with 15strongly disagree and 55strongly agree (10). This result agrees with that from the current study, suggesting that natural science students enjoy group projects.
The project reported here, currently in use in an upper-division neurophysiology course, is a type of culminating program experience that could easily be adapted to any subdiscipline within the biological sciences or to any of the other natural sciences. The cognitive skills and basic content knowledge required to complete this project are developed throughout the undergraduate program and, consequently,
perfor-mance on the project can be used as an authentic program assessment tool. An improvement on the current assessment design would be to have profession-als other than the course instructor assess the final projects.
Appendix A:
Grading Criteria Used for Poster Pr esentations
Title: (5 pts.)
1.Title is an appropriate length and descriptive of research results to be discussed.
Incomplete or Below Average Good Excellent not included average
Intr oduction (15 pts.; all points given equal weight): 1.Gives a general background to the topic
Incomplete or Below Average Good Excellent not included average
FIG. 9.
Student r esponses to early quarter (n544), midquarter (n542), and end of quarter (n540) survey questions
asking students whether ‘‘work assignments in work gr oups have been evenly distributed among the gr oup
members.’’ Midquarter distribution differ ed fr om early quarter and end of quarter distributions at P F 0.02
(Kruskal-Wallis one-way ANOVA followed by Ryan’s pr ocedur e). For early and end of quarter surveys 48–57% of r esponses wer e positive, wher eas 76% of r esponses wer e positive for midquarter survey. For early and end of quarter surveys 14–20% of r esponses wer e undecided, wher eas 12% of r esponses wer e undecided for midquarter survey. For early and end of quarter surveys 29–32% of r esponses wer e negative, wher eas 12% of r esponses wer e negative for midquarter survey.
Introduction: (continued)
2.Explains explicitly or implicitly how the topic fits into the broad context of neuroscience
Incomplete or Below Average Good Excellent not included average
3.Uses the last few sentences to state the hypothesis(es) or model to be explored in the poster
Incomplete or Below Average Good Excellent not included average
4.Appropriate length (2–3 paragraphs)
Incomplete or Below Average Good Excellent not included average
5.Uses appropriate techniques to reference articles (authors’ names, year of publication, or number, as in references section) Incomplete or Below Average Good Excellent not included average
Description of Resear ch (40 pts.;#1–4weightedD23#5–6):
1.Includes figures or tables from or summary figures based on 6–10 of the primary articles
Incomplete or Below Average Good Excellent not included average
2.Includes a verbal description/interpretation of these tables/ figure
Incomplete or Below Average Good Excellent not included average
3.There is a synthesis of information from the different papers instead of 10 separate article summaries:
a) Groups together results that can be used to address the same hypothesis or same part of the model
Incomplete or Below Average Good Excellent not included average
b) Draws conclusions at the end of each subsection, if appropriate Incomplete or Below Average Good Excellent not included average
4.Describes methods in appropriate detail to understand the results
Incomplete or Below Average Good Excellent not included average
5.Uses appropriate techniques to reference primary articles (authors’ names, year of publication, or number, as in references section) Incomplete or Below Average Good Excellent not included average
FIG. 10.
Student r esponses to early quarter (n544), midquarter (n542), and end of quarter (n540) survey questions
asking students whether ‘‘all members of the gr oup participated equally while working on gr oup pr ojects.’’ Early
quarter survey differ ed fr om midquarter survey atPF0.03 (Kruskal-Wallis one-way ANOVA followed by Ryan’s
procedure). Positive: 36% of early quarter responses, 60% of midquarter responses, and 48% of end of quarter responses. Undecided: 28% of early quarter r esponses, 19% of midquarter r esponses, and 20% of end of quarter r esponses. Negative: 36% of early quarter r esponses, 21% of midquarter r esponses, and 32% of end of quarter r esponses.
Description of Research: (continued)
6.This section constitutes the majority of the poster
Incomplete or Below Average Good Excellent not included average
Summary or Conclusions (15 pts.;#1–2weighted twice#3):
1.Synthesizes and draws general conclusions based on results summarized above, i.e., identifies 1–3 ‘‘take-home messages’’ or global conclusions
Incomplete or Below Average Good Excellent not included average
2.States whether results support or refute the original hypothesis/ model
Incomplete or Below Average Good Excellent not included average
3.Appropriate length (,1 page)
Incomplete or Below Average Good Excellent not included average
Refer ences (10 pts.;#1weighted 33#2–3):
1.Lists at least 10 primary articles
Incomplete or Below Average Good Excellent not included average
2.Citations are in the following format:
Complete author list with last name first followed by initials, article title with first word capitalized, journal title underlined or in italics, journal volume: pages (inclusive), year.
Incomplete or Below Average Good Excellent not included average
3.List is alphabetized and numbered
Incomplete or Below Average Good Excellent not included average
General (15 pts.; all points given equal weight): 1.Paraphrases instead of using direct quotes
Incomplete or Below Average Good Excellent not included average
2.Overall organization follows the directions given in the syllabus Incomplete or Below Average Good Excellent not included average
3.Readability: wording, sentence and paragraph structure Incomplete or Below Average Good Excellent not included average
4.Mechanics: usage, punctuation, spelling
Incomplete or Below Average Good Excellent not included average
5.Adheres to the established size limit (3 ft34 ft)
Incomplete or Below Average Good Excellent not included average
6.Aesthetics of presentation
Incomplete or Below Average Good Excellent not included average
Appendix B:
Grading Criteria Used for Oral Pr esentations
Intr oduction (10 pts.; all points given equal weight): 1.Gives a general background to the topic
Incomplete or Below Average Good Excellent not included average
2.States the hypothesis(es) or model to be discussed
Incomplete or Below Average Good Excellent not included average
3.Provides a clear overview of the presentation to follow Incomplete or Below Average Good Excellent not included average
4.Appropriate length; i.e., not more than1⁄4of the presentation Incomplete or Below Average Good Excellent not included average
5.Makes reference to appropriate prior research, i.e., ‘‘Smith found . . . ,’’ or ‘‘It has been shown by both the Smith and Garcia groups that . . .’’)
Incomplete or Below Average Good Excellent not included average
Description of Resear ch (25 pts.;#1–3weightedD23#4–5):
1.Figures or tables are referred to during the presentation Incomplete or Below Average Good Excellent not included average
2.Includes a verbal description/interpretation of these tables/ figures
Incomplete or Below Average Good Excellent not included average
3.Describes methods in appropriate detail to understand the results
Incomplete or Below Average Good Excellent not included average
4.Uses appropriate techniques to reference sources, i.e., ‘‘Smith found . . . ,’’ or ‘‘It has been shown by both the Smith and Garcia groups that . . .’’)
Incomplete or Below Average Good Excellent not included average
5.This section constitutes the majority of the presentation (,1⁄2of the presentation)
Incomplete or Below Average Good Excellent not included average
Summary or Conclusions (10 pts.;#1–2weighted 23#3):
1.Synthesizes and draws general conclusions based on results summarized above, i.e., identifies 1–3 ‘‘take-home messages’’ or global conclusions
Incomplete or Below Average Good Excellent not included average
2.States whether results support or refute the original hypothesis/ model
Incomplete or Below Average Good Excellent not included average
3.Appropriate length (,1⁄4of the presentation)
Incomplete or Below Average Good Excellent not included average
General (15 pts.; all points given equal weight): 1.Paraphrases instead of using direct quotes
Incomplete or Below Average Good Excellent not included average
2.There is a clear organizational structure that follows the direc-tions given in the syllabus
Incomplete or Below Average Good Excellent not included average
General: (continued)
3.Effective and engaging presentation style
Incomplete or Below Average Good Excellent not included average
4.Speaker is extemporaneous and makes eye contact with the audience
Incomplete or Below Average Good Excellent not included average
5.There are good transitions between sections and between topics within a section
Incomplete or Below Average Good Excellent not included average
6.Adheres to established time limit (10 min total for presentation and audience questions)
Incomplete or Below Average Good Excellent not included average
7.Title is descriptive of research results that are discussed Incomplete or Below Average Good Excellent not included average
Appendix C:
Early Quarter Survey Used in Indir ect Assessment of Student Accomplishment
DIRECTIONS: Please choose the best answer to the following questions.
1.Which of the following statements best describes your prior experience with use of computer databases to conduct library research?
I have never used computer databases to conduct library research.
I have limited experience and am self-taught in the use of computer databases to conduct library research.
I have limited experience but received formal training in the use of computer databases to conduct library research.
I have extensive experience and am self-taught in the use of computer databases to conduct library research.
I have extensive experience and received formal training in the use of computer databases to conduct library research.
2.Which of the following statements best describes your prior experience with the primary scientific literature?
I do not know what the primary scientific literature is.
I know what the primary scientific literature is but have never been required to make use of it.
I have been required, in a previous course, to make use of the primary scientific literature.
I use the primary scientific literature regularly, on a monthly basis.
I use the primary scientific literature regularly, on a daily or weekly basis.
3.Which of the following statements best describes your class standing and experience with scientific writing?
I am an undergraduate and have not taken my required upper-division writing course.
I am an undergraduate and am currently enrolled in my upper-division writing course.
I am an undergraduate and was required to write a scientific review article in my upper-division writing course.
I am an undergraduate and was not required to write a scientific review article in my upper-division writing course.
I am a graduate student and have never written a scientific review article.
I am a graduate student and have written a scientific review article.
4.Which of the following statements best describes your prior experience with oral presentations of scientific information that made use of slides or overheads?
I have never made an oral presentation of scientific information. I have made an oral presentation in a class.
I have made an oral presentation at a campus or regional meeting.
I have made an oral presentation at a national or international meeting.
5.Which of the following statements best describes your prior experience with scientific poster presentations?
I have never attended a poster session. I have attended a poster session as an observer. I have attended a poster session as a presenter.
6.I enjoy working on graded projects in small groups.
strongly agree undecided disagree strongly
agree disagree
7.In the past, I was satisfied with the work outcomes for group projects.
strongly agree undecided disagree strongly
agree disagree
8.In the past, interactions in work groups I have been assigned to have been positive.
strongly agree undecided disagree strongly
agree disagree
9.The work assignments for previous group projects I have been assigned to have been evenly distributed among the group mem-bers.
strongly agree undecided disagree strongly
agree disagree
10. While working on previous group projects, I have felt that all members of the group participated equally.
strongly agree undecided disagree strongly
agree disagree
This research was supported by National Institutes of Health Grant 5SO6-GM-08101-26 and a California State University, Los Angeles, Sabbatical Leave Award to B. L. Krilowicz.
Address for reprint requests and other correspondence: B. L. Krilowicz, Dept. of Biology and Microbiology, California State Univ., 5151 State University Dr., Los Angeles, CA 90032 (E-mail: [email protected]).
Received 2 March 1998; accepted in final form 6 January 1999.
Refer ences
1. Advisory Committee to the National Science Foundation
Dir ectorate for Education and Human Resour ces.Sha ping
the Future: New Expecta tions for Undergra dua te Educa tion in Science, Ma them a tics, Engineering, a nd Technology. Wash-ington, DC: National Science Foundation, 1996.
2. Angelo, T. A., and K. P. Cr oss. Cla ssroom Assessm ent Techniques: A Ha ndbook for College Tea chers(2nd ed.). San Francisco: Jossey-Bass, 1993.
3. Barr ow, D. A.The use of portfolios to assess student learning:
a Florida college’s experiment in a general chemistry class.J. Col. Sci. Tea ch. 22: 148–153, 1992–1993.
4. Beebe, S. A., and J. T. Masterson.Com m unica ting in Sm a ll
Groups: Principles a nd Pra ctice(4th ed.). New York: Harper-Collins, 1994.
5. Bloom, B. S., J. T. Hastings, and G. E. Madaus.Ha ndbook of
Form a tive a nd Sum m a tive Eva lua tion of Student Lea rning.
New York: McGraw-Hill, 1971.
6. Kirk, R. E.Experim enta l Design: Procedures for the Beha
v-iora l Sciences. Belmont, CA: Wadsworth, 1968.
7. McIntosh, W. J.Assessment in higher education: establishing
continuous feedback between students and instructors.J. Col. Sci. Tea ch. 26: 52–53, 1996.
8. Mehler, A. H. Integration of examinations and education.
Biochem . Educ. 20: 10–14, 1992.
9. Wester n Association of Schools and Colleges Accr editing
Commission for Senior Colleges and Universities.
Achiev-ing Institutiona l Effectiveness Through Assessm ent: A Re-source Ma nua l to Support WASC Institutions. Oakland, CA: Western Association of Schools and Colleges, 1992.
10. Wright, J. C. Authentic learning environment in analytical
chemistry using cooperative methods and open-ended lab-oratories in large lecture courses.J. Chem . Educ. 73: 827–832, 1996.