STUDY RELATING TO THE SPATIAL DISTRIBUTION OF GROUND WATER
QUALITY FOR DIFFERENT ELEMENTS USING LEGACY DATA OF RWS&S,
ANDHRA PRADESH, INDIA
Prathapani Prakash1*, Aswini Kumar Das 2, C.V.S. Sandilya 3 1
Associate Project Manager, Geosceinces Division, APSRAC, Ameerpet, Hyderabad, 500038, India - [email protected] 2
Associate Project Manager, Geosceinces Division, APSRAC, Ameerpet, Hyderabad, 500038, India - [email protected] 3 Scientist 'SE', Geosceinces Division, APSRAC, Ameerpet, Hyderabad, 500038, India - [email protected]
KEY WORDS: Ground water quality, Chemical elements, Water Level Decline, Global Warming, GIS, Remote Sensing
ABSTRACT:
The state of Andhra Pradesh, India falls in water stress4 area. The primary objective of this study is to examine the spatial distribution of different chemical elements with respect to its contamination level. About 70% of drinking water needs in rural areas and 40% drinking water needs in urban areas are met from groundwater resources. In the last decades, rapid population growth coupled with agricultural expansion due to subsidized power to agriculture has significantly increased demand on groundwater resources. Combined to this, the effect of Global warming has put stress on ground water which is resulting in declines in water levels and deterioration of ground water quality. This may be evidenced by the fact that the phreatic aquifer which was in use two decades ago, is existing no more now in some of the parts of the study area and the water is being drawn from deeper aquifers beyond phreatic aquifers. The study has been carried out for which one or more elements are contaminated and to study its spatial distribution.
* Corresponding Author:Prathapani Prakash, Associate Project Manaager, Geosciences Division, APSRAC ([email protected])
4 Water stress - Annual per capita water supply for all uses is in between 1000 and 1700 m3
per person. 1. INTRODUCTION
Groundwater is a vital natural resource. It is estimated that approximately one third of the world’s population use groundwater globally for drinking. In some parts of the world such as large areas of the southern India, groundwater is the unique source of water. In general, the state of Andhra Pradesh is characterized by scarcity of water and rapid growth in population. Water is therefore the most important constraint for future development in this region. However, it is anticipated that the process of development will continue, resulting in greater demands for fresh water and declining groundwater level. India as a country in the southern Asia is confronted by multiple water-related problems, such as drought and environmental degradation from overexploitation of aquifers in the southern and western parts of the country.
Understanding the groundwater quality is important as it is the main factor determining its suitability purposes. In the study area, it is observed that the extensive agricultural activities and urbanization resulted in the contamination of the aquifer in recent years.
The study has been carried out for the spatial distribution of following 6 elements contaminated in the study area:
Fluoride (F), Chloride (Cl), Total Hardness (TH), Total Alkalinity (TA), Total Dissolved Solids (TDS) & pH.
2. STUDY AREA
The study area includes the undivided Andhra Pradesh state which is falling in the south eastern part of India with an areal
extent of 2,75,068 Sq. Km. It lies in between longitudes 770 to 84.400 E and latitudes 12.410 to 220 N.
2.1 Physiographic of the Study Area
The State of AP is endowed with a variety of physiographic features ranging from hills and undulating plains to coastal deltaic environment. The state has three major river basins - Godavari, Krishna and Pennar. The climate in A.P. is semi-arid to arid. Geomorphologically, the state can be categorized into pedi-plains, coastal alluvial plains and hill ranges.
The state receives an annual rainfall of 940 mm on an average, with wide variations among the districts. It ranges from 1200 mm in Srikakulam District to about 550 mm in Anantapur District. The majority of the rainfall (66%) is received from the south-west monsoon during June-September, while the north-east monsoon (October-December) contributes about 25% of the rainfall. Major constraints are imposed by the spatio-temporal variations in water availability, though in aggregate terms, the water is sufficient to meet current demands in all but the driest years (FAO, 2004).
2.2 Geology & Hydrogeology of the Study Area
The State of AP is underlain by rock types ranging from Archaean to recent alluvium with varied texture and structure. Nearly 85% of the state, i.e., about 2.33 lakh sq km, is underlain by hard rock’s - igneous, volcanic and metamorphic rocks, mainly Granites, Gneisses, Charnokites and Khondalites in the Eastern Ghats, Cuddapah (Middle and Upper Proterozoic), Kurnool and Deccan traps (Eocene). The remaining 15% of the area, i.e., 0.42 lakh sq km is underlain by soft rocks - Tertiary and Gondwana sandstones & shales and alluvium of recent age. Dolerite dykes, quartz reefs, feldspathic and pegmatite veins The International Archives of the Photogrammetry, Remote Sensing and Spatial Information Sciences, Volume XL-8, 2014
extending from a few meters to a few kilometers cut across the country rocks at many places. The dolerite dykes have been emplaced along major prominent fractures. The vertical joints in granites are also aligned to the major direction of fractures / lineaments. Fluorite and apatite rocks contain fluoride- bearing minerals and are the main source of fluoride in groundwater.
The groundwater quality varies from place to place and hence there may be pockets of better and usable groundwater in these poor quality groundwater areas also.
2.3 Soils
Soils play an important role in improving groundwater recharge. The soils of the state are broadly classified into red, black and alluvial. Red sandy soils cover the largest area in the state (67%) and occur widely in the Telangana and Rayalaseema regions. The black soils are in general transported by rivers. The deltaic alluvial soils, coastal alluvial soils and coastal sandy soils are formed by the riverine system.
3. GROUND WATER DEVELOPMENT: A
SPATIO-TEMPORAL ANALYSIS
3.1 Estimates of Groundwater in India
India with 2.4% of the world’s total area has 16% of the world’s population, but has only 4% of the total available fresh water. This clearly indicates the need for water resources development, conservation and their optimum use. At the aggregate level, India is not short of water.
As per the assessment of Central Water Commission (1993), the water resources potential of the country is estimated to be of the order of 1869 billion cubic metres (bcm), which includes replenishable groundwater that gets charged on annual basis. Within the limitations of physiographic conditions, socio-political environment, legal and constitutional constraints and the technology available at hand, the utilizable water resources of the country have been assessed at 1123 bcm, of which 690 bcm is from surface water and 433 bcm from groundwater sources (CWC-1993). Harnessing of 690 bcm of utilizable surface water is possible only if matching storages are built.
The annual replenishable groundwater resource for the entire country is 433 bcm. The overall contribution of rainfall to the country’s annual replenishable groundwater resource is 67% and the share of other sources, including canal seepage, return flow from irrigation, seepage from water bodies and water conservation structures taken together is 33%.
In the state of AP, the contribution of other sources is more than the national average of 33%, mainly because of canal seepage and intensive irrigation. The southwest monsoon being the most prevalent contributor of rainfall in the country, about 73% of the country’s annual replenishable groundwater recharge takes place during the kharif period of cultivation. Keeping 34 bcm as the allocation for natural discharge during the non-monsoon season, the net annual groundwater available for utilization in the entire country is about 399 bcm
3.2 Estimates of Groundwater in Andhra Pradesh
The state’s total water resources, both ground and surface water are estimated to be about 108.15 bcm (3820 tmc) (about 9.5% of country), out of which about 62.29 bcm (2200 tmc) is currently being utilized for drinking, agriculture, industry and power generation purposes. The per capita annual water resources work out to be slightly more than 1400 cum, and the utilization is about 800 cum (AP Water Vision, 2004). The current percentage of withdrawal of available water in AP is 58%. By the year 2050, Andhra Pradesh will come in to the status of water "severe" state from the present state of water "stress". This calls for efforts towards efficient management supported by appropriate policy framework for appropriate water governance.
3.3 Groundwater Development in AP: A Spatio-Temporal Analysis
A recent expert group report (GoI, 2007) indicated that groundwater resources in the country are under severe stress. In 2004, an alarming 28% of the blocks in the country were in the category of semi-critical, critical or over exploited, compared to only 7% in 1995. This is clearly indicating the increase in water demand over a period of time. The rate of extraction far exceeds the rate of replenishment in many blocks, leading to a progressive lowering of the water table.
3.4 GEC Report of AP
Groundwater resource of the state is estimated on a regular basis by the MoWR in close collaboration with the Ground Water Department of Government of AP. As per the methodology followed, the status of groundwater is simply given as a ratio of the utilization and recharge, which is called the SGD. It can also be called the stage of groundwater utilization for clarity.
The assessment is done based on 1229 watershed assessment units spread across the state of Andhra Pradesh. There is a separate categorization for over exploited villages mainly used for A.P. state regulation. Recharge computations have been made separately for ayacut (command) and non- ayacut (non-command) areas. It is observed that most of the groundwater development is confined to the non-ayacut areas.
The state has been categorized into four zones, viz., safe (<70%), semi-critical (70% to 90%), critical (90 to 100%) and over exploited (>100%), based on the percentage of groundwater exploitation.
On an average, the density of wells increased from five wells to over 10 wells per sq km. However, in hard rock areas, it is over 20 wells per sq km, while in some pockets it is as high as 100 wells per sq km. Consequently, well yields decreased considerably and water levels went down alarmingly.
3.5 Why is Water Quality an Issue?
Water resources management has often focused on satisfying increasing demands for water without adequately accounting for the need to protect water quality and preserve ecosystems and biodiversity. Rapidly growing cities and industries, expansion of the mining industry, and the increasing use of chemicals in agriculture have undermined the quality of many rivers, lakes, and aquifers. Poor water quality can create health hazards, threaten downstream irrigation areas; reduce industrial capacity The International Archives of the Photogrammetry, Remote Sensing and Spatial Information Sciences, Volume XL-8, 2014
through loss of hydropower production and costs arising from removing pollutants; destroy ecosystems; and affect biodiversity. If pollution makes the water unfit for human use, degraded surface and groundwater quality can even add to water shortages in water-scarce regions.
Maintaining good water quality is a growing concern in water resources management around the world. In developing countries, major water quality concerns include fecal contamination from the disposal of untreated or partially treated municipal and domestic wastewater into surface water bodies, and the increased use of pesticides, fertilizers, and herbicides in agriculture. Trace chemicals and pharmaceuticals, which are carcinogens and endocrine disrupters, are now seen as a water quality concern in the industrialized world. As these examples demonstrate, water quality issues depend very much on the context. Thus, chlorination of drinking water can introduce trihalomethanes, which are carcinogenic.
Even though water quality deterioration is often not as visible as water scarcity, its impacts can be just as serious with significant economic consequences. Health hazards, agricultural production losses, and losses of ecological function and biodiversity have long-term effects that are costly to remediate and impose real suffering on those affected. Sediments eroded from watersheds increase turbidity and reduce storage capacity in dams.
3.6 Key Water Quality Issues
Both natural processes and human activities can cause deterioration in water quality. Water quality standards have been developed to assess the suitability of water for drinking as per Bureau of Indian Standards Organization (ISO) 10500: 1991.
4. METHODOLOGY
The legacy data from line department (Rural Water Supply & Sanitation Department, Govt. of Andhra Pradesh) is the main input used for the study. It consists of the ground water quality data pertaining to 6 elements which are (1) Total Dissolved Solids (TDS), (2) Total Hardness (TH), (3) Fluoride (F), (4) Total Alkalinity (TA), (5) Chloride (Cl) & (6) pH.
Contamination spread of element-wise distribution from a single element to 6 elements are plotted against to each habitation for pre and post monsoon seasons separately and its spatial distribution is studied using satellite remote sensing techniques and with respect to other collateral data as mentioned below:
1. Geology
2. Hydrogeomorphology
3. Groundwater Exploitation (GEC) Report 4. Forest layer
5. Irrigation Command Area Map 6. Ground water level map
5. RESULTS AND DISCUSSION
5.1 Groundwater Quality Study in Pre-Monsoon Season
5.1.1 Groundwater Quality Variations during Pre-Monsoon Season
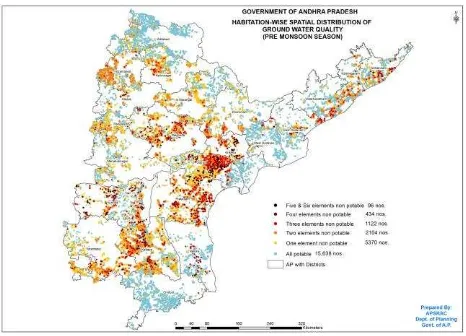
The spatial distribution of elements contaminated during pre-monsoon season (Fig. 1) is plotted against to each habitation. In the map the distribution of fresh samples are also shown below the contaminated sources. It is noted that the fresh water is available along with the contaminated water in some of the patches.
Figure 1. Map showing the spatial distribution of elements contaminated during pre-monsoon season
The following is the status of element-wise number of sources potable and or contaminated during the pre monsoon season:
Total sources
quality tested 1,05,505 - All elements
potable 79,688 75.53%
At least one element quality affected source
25,817 24.47%
The following is the list of number of elements contaminated against to total number of source(s) during pre-monsoon season (Table 1):
Sl No
Element(s) contaminated
Total sources quality affected, nos
% of quality affected to total sources in A.P.
1 1 16,694 15.82%
2 2 5,454 5.17%
3 3 2,607 2.47%
4 4 909 0.86%
5 5 140 0.13%
6 6 13 0.01%
Table 1. Status of percentage of elements contamination
In the pre-monsoon season, if we put the order of districts which are having contaminated sources / elements, the following is the order of importance:
Guntur, Prakasam, Kadapa, Ananthapur, Warangal, Khammam, Nalgonda, Rangareddy, Kurnool, Nizamabad, Karimnagar & Krishna
The following table shows the major contaminated elements out of total quality tested sources in Andhra Pradesh (Table 2):
Only Fluoride (F) affected sources 10.46%
Only Total Hardness (TH) affected sources 3.37%
TDS & TH affected sources 2.76%
TDS, TH & CL affected sources 1.07%
Other elements combination (quality
affected) 6.81%
All potable sources 75.53%
Table 2. Status of percentage of major elements
The following graph (Figure 2) shows the distribution of major contaminated sources with combination of different elements as against to total quality tested sources (1,05,505):
Figure 2. Distribution of contamination elements
5.1.2 Groundwater Quality vs Groundwater Development during Pre-Monsoon Season
The spatial distribution of elements contaminated versus Ground water categorization is studied. From the study it is revealed that, the ground water quality is severely affected in Semi-critical, Critical and Over exploited zones as compared to Safe areas.
5.1.3 Ground Water Quality vs Ground Population during Pre-Monsoon Season
With the available data, the ground water quality versus population likely to be affected are studied for entire Andhra Pradesh. It is assumed that out a total population of 2.26 Crores covered, about 54 Lakh people are likely to be affected with at least one or more elements for entire A. P.
The following districts are more quality affected during pre monsoon period: Anantapur, Prakasam, Nalgonda, Guntur, Kurnool, Karimnagar, Kadapa, Karimnagar, Warangal.
5.2 Groundwater Quality Study in Post-Monsoon Season
5.2.1 Groundwater Quality Variations during Post-Monsoon Season
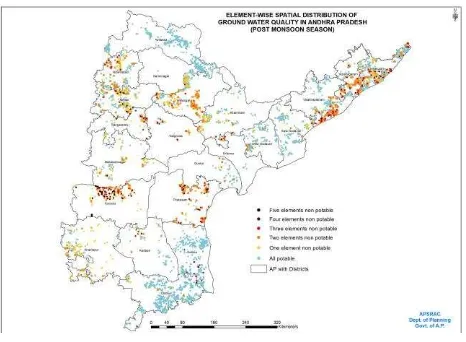
The spatial distribution of elements contaminated during post-monsoon season (Fig. 3) is plotted against to each habitation. In the map the distribution of fresh samples are also shown below the contaminated sources. It is noted that the fresh water is available along with the contaminated water in some of the patches.
Figure 3. Map showing the spatial distribution of elements contaminated during post-monsoon season
The following are the status of element-wise sources potable and or contaminated during the post monsoon season:
Total sources
quality tested 26,492 All elements
potable 21,682 81.84 %
At least one element quality affected source
4,810 18.16 %
The following is the list of number of elements contaminated against to total number of source(s) during post-monsoon season (Table 3):
Sl No
Element(s) contaminated
Total sources quality affected, nos
% of quality affected to total sources in A.P.
1 1 3,003 11.34 %
2 2 1,147 4.33 %
3 3 437 1.65 %
4 4 170 0.64 %
5 5 53 0.20 %
Table 3. Status of percentage of elements contamination
The following districts are more quality affected during post monsoon period:
Warangal, Kurnool, Prakasam, Medak, Srikakulam, Vishakapatnam, Vizayanagaram, Nizamabad, Ananthapur, & Rangareddy
The following table shows the major contaminated elements out of total quality tested sources in Andhra Pradesh during post monsoon season (Table 4):
Only Fluoride (F) affected sources 6.38 %
Only Total Hardness (TH) affected sources 3.39 %
TDS & TH affected sources 2.62 %
TDS, TH & CL affected sources 0.73 %
Other elements combination (quality
affected) 5.04 %
All potable sources 81.84 %
Table 4. Status of percentage of major elements
The following graph (Fig. 4) shows the distribution of major contaminated elements as against to total number of sources quality tested (26,492):
Figure 4. Distribution of contamination elements
5.2.2 Ground Water Quality vs Ground water development stage during Post-Monsoon Season
The spatial distribution of elements contaminated versus Ground water categorization is studied and. From the study it is revealed that, the ground water quality is severely affected in Semi-critical, Critical and Over exploited zones as compared to Safe areas.
5.2.3 Ground Water Quality vs Ground Population during Post-Monsoon Season
With the available data, the ground water quality versus population likely to be affected are studied for entire Andhra Pradesh. It is assumed that out a total population of 73.12 Lakhs covered; about 16.24 Lakh people are likely to be affected with at least one or more elements for entire A. P.
The following districts are more quality affected during post monsoon period: Kurnool, Anantapur, Prakasam, Warangal, Guntur, Nalgonda, Mahabubnagar, Krishna, Rangareddy, Vizianagaram, Kadapa
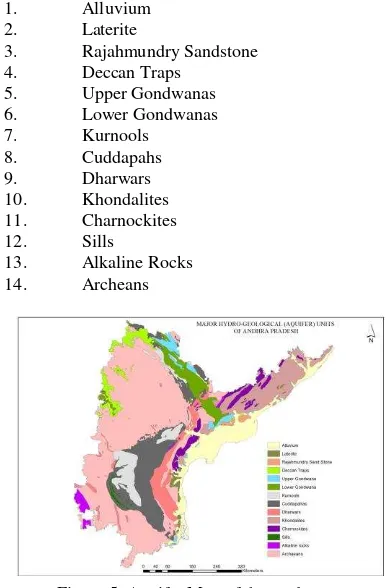
5.3 Major Hydro-Geological (Aquifer) Unit-wise Ground Water Quality
Hydrogeological point of view there is 14 major units in Andhra Pradesh. Major hydrogeological units (Aquifers) are as shown in Fig. 5. They are:
1. Alluvium
2. Laterite
3. Rajahmundry Sandstone 4. Deccan Traps
5. Upper Gondwanas 6. Lower Gondwanas
7. Kurnools
8. Cuddapahs
9. Dharwars
10. Khondalites 11. Charnockites 12. Sills
13. Alkaline Rocks 14. Archeans
Figure 5. Aquifer Map of the study area
Alluvium:
The Alluvium is spread across the state along the coastal zone covering part of the districts namely Srikakulam, Vizianagaram, Vishakapatnam, East Godavari, West Godavari, Krishna, Guntur, Prakasham & Nellore. It also occurs in part of Khammam district along the river Godavari. In parts of Srikakulam, Vishakapatnam, Guntur, Prakasham & Nellore districts, the ground water quality problem is existing for the elements of Total Dissolved Solids (TDS), Total Hardness (TH), Chloride (Cl). For other alluvium areas it is in permissible limits.
Laterite:
Laterite cappings occur in part of the districts namely Vizianagaram, Vishakapatnam, Prakasham, Nellore. It also occurs in some of the areas over Deccan Traps in Nizamabad, Medak and Rangareddy districts. The ground water is poor for the elements namely Total Dissolved Solids (TDS), Total Hardness (TH) & Chloride for the coastal districts which were underlain by laterite. Other areas it is within the permissible limits.
Rajahmundry Sandstone:
Rajahmundry Sandstone occurs in part of the districts of East Godavari, West Godavari & Krishna districts. In general the ground water quality is within permissible limits in Rajahmundry Sandstone formation.
Deccan Traps:
Deccan Traps covers part of the districts of Adilabad, Nizamabad, Medak & Ranga Reddy districts. It also occurs along with the Rajahmundry Sandstone. In general the ground The International Archives of the Photogrammetry, Remote Sensing and Spatial Information Sciences, Volume XL-8, 2014
water quality is good except for Adilabad district where the fluoride is out of range for a few sources.
Upper Gondwanas:
Upper Gondwanas spread across in part of the districts of Adilabad, Karimnagar, Warangal, West Godavari & Krishna along the Godavari graben. In general the ground water quality is within the permissible limits except for a few sources. Lower Gondwanas:
Lower Gondwanas spread across in part of the districts of Adilabad, Karimnagar, Warangal, Khammam & West Godavari along the Godavari graben. In general the ground water quality is within the permissible limits except for a few sources. Kurnools:
Kurnools formation is spread across in part of districts of Kadapa, Kurnool, Mahbubnagar, Guntur, Nalgonda, Adilabad, Karimnagar & Warangal. For the districts pertaining to Kadapa, Kurnool, Mahbubnagar & Guntur districts, there is major contamination of the elements Total Dissolved Solids (TDS), Total Hardness (TH), Chloride (Cl) & Fluoride. For northern districts (Adilabad, Karimnagar & Warangal) which were underlain by Kurnools formation in Andhra Pradesh, the ground water quality is within the permissible limits.
Cuddapahs:
Cuddapahs formation is spread across in part of districts of Chittor, Kadapa, Ananthapur, Kurnool, Nellore, Prakasam, Mahbubnagar, Nalgonda, Guntur, Adilabad, Khammam & Warangal districts. In Kadapa, Kurnool & Prakasam districts the ground water quality is poor for at least some of the quality is within the permissible limits except for a few sources. Dharwars:
Dharwars formation is spread across in part of districts of Anantapur, Nellore, Prakasam, Guntur, Krihsna, Khammam, Nalgonda, Mahbubnagar, Kurnool and a narrow patch along Warangal-Karimnagar boundary. The ground water quality problem is existing in the districts of Nellore, Prakasam, Guntur, Ananthapur, Kurnool, Mahbubnagar & Khammam districts for some of the elements of TDS, TH, Cl, F.
Khondalites:
Khondalites formation is spread across in part of districts of Srikakulam, Vizianagaram, Vishakapatnam, Khammam, East Godavari, West Godavari, Krishna, Guntur & Praksam. The ground water quality in general is good except some of the districts of Srikakulam, Vizianagarm & Vishakapatnam where the ground water is out of range for the elements TDS, TH & Cl.
Charnockites:
Charnockites formation is spread across in part of districts of Srikakulam, Vizianagaram, Vishakapatnam, Khammam, East Godavari, West Godavari, Krishna, Khammam & Prakasam districts. It occurs along with Khondalites formation in majority of the areas. The ground water quality problem is existing for the portion which was covered between Archeans and Khondalite and recent alluvium covering the districts of Guntur & Prakasam districts for most of the elements. This zone is highly contaminated. For other areas it is within the permissible limits except for a few sources.
Sills:
Sills formation is spread across the part of districts of Kadapa, Kurnool & Anantapur districts. Ground water quality is out of range in Kadapa district where it is existing along with Cuddapahs formation.
Alkaline rocks:
Alkaline rocks formation is spread across in the western part of Anantapur district. In general the ground water quality is within the permissible limits except for a few sources.
Archeans:
The Archeans formation is widely spread across the entire state except for a few districts namely Srikakulam, Vizianagaram, Vishakapatnam & East Godavari. The ground water quality is within the permissible limits for the districts of Adilabad, Chittor, Nellore & Khammam. The ground water quality is poor in other areas at least for some of the elements. The districts which were highly contaminated are Nalgonda, Warangal, Nizamabad, Karimnagar, Guntur, Kurnool, Anantapur, Kadapa for at least some of the elements.
5.4 Temporal variations during pre and post monsoon seasons
The temporal variations for pre as well as post monsoon seasons is studied for entire Andhra Pradesh by calculating the Mean, Minimum, Maximum and Standard Deviations for the data pertaining to 2010 - 2012 years. It is inferred that in general there is considerable decrease in mean values from pre monsoon season to post monsoon season for almost all the elements. This implies that because of recharge from the monsoon, the post monsoon values are getting decreased for the elements.
5.5 What Influences Groundwater Quality ?
5.5.1 Geogenic / Natural conditions
The chemical composition of ground water varies because of many complex factors that change with depth and over geographic distances. Rain and snow are the major sources of recharge to ground water. They contain small amounts of dissolved solids and gases such as carbon dioxide, sulfur dioxide, and oxygen. As precipitation infiltrates through the soil, biologically-derived carbon dioxide reacts with the water to form a weak solution of carbonic acid. The slightly acidic water dissolves soluble rock material, thereby increasing the concentrations of chemical constituents such as calcium, magnesium, chloride, iron, and manganese. As ground water moves slowly through an aquifer the composition of water continues to change, usually by the addition of dissolved constituents (Freeze and Cherry, 1979). A longer residence time will usually increase concentrations of dissolved solids. Because of short residence time, ground water in recharge areas often contains lower concentrations of dissolved constituents than water occurring deeper in the same aquifer or in shallow discharge areas.
As groundwater flows through an aquifer it is naturally filtered. This natural filtering process creates water that is usually free from disease causing bacteria and lower in suspended solids than surface water. The longer water remains in an aquifer, the longer it has to dissolve minerals and filter contaminants.
5.5.2 Anthropogenic activities
Human activities influence groundwater quality primarily through contamination. Major sources of groundwater contaminants include untreated industrial and sewage, landfills, septic systems, abandoned water wells and excessive use of agrochemicals (fertilizers and pesticides).
Aquifers vary in their susceptibility to contamination. Shallow aquifers consisting of permeable sediments are extremely The International Archives of the Photogrammetry, Remote Sensing and Spatial Information Sciences, Volume XL-8, 2014
vulnerable, as contaminated surface water can enter them very quickly. In contrast, deep aquifers or those of less permeable materials are less vulnerable either because of the longer travel and filtering time or the overlying protective confining layers of rock preventing the downward migration of contaminants.
Because of over draft of ground water for different purposes like domestic, agriculture and industrial use, combined with erratic rainfall is likely to impose water quality problem along with lowering water levels. If the rate of discharge over exceeds, there is a chance of land subsidence as well.
If the contaminated groundwater migrates to a surface water body such as a wetland or lake, those supplies can also be affected. Preventing groundwater contamination is the most effective and practical solution. Prevention is achievable through a combination of actions including:
Public awareness programs
Groundwater monitoring
Identifying highly susceptible aquifers
Developing and following best management practices
Proper site selection for activities and industries using hazardous chemicals
Enhanced containment for storage of wastes and chemicals on vulnerable soils
Reducing chemical use wherever possible
Responding quickly to spills
Proper construction, maintenance and plugging of water wells
6. CONCLUSION
The majority of sources of Andhra Pradesh are contaminated with Fluoride (geogenic), TDS (geogenic/anthropogenic) and Total Hardness (geogenic/anthropogenic). TDS & TH are out of range mostly in command areas. This could be because of extensive irrigation practised in command areas and recharge from the nutrient rich surface waters.
In the coastal command areas along with TDS & TH, there is contamination of Chloride as well. This may be because of sea water ingress, anthropogenic activity and over exploitation. Ingress of seawater into coastal aquifers as a result of over-extraction of groundwater will made water supplies more saline, unsuitable for drinking and irrigation.
The origin for fluoride contamination occurs geogenically. Fluoride in ground waters occurs because of fluoride bearing minerals present in the parent rock. When the fluoride is dissolved in ground waters because of chemical action with water, the concentration of fluoride is getting increased. The fluoride is existing naturally in higher percentage in the rocks of some of the areas of Andhra Pradesh. When we compare the fluoride contamination in A.P. with ground water exploitation areas, it occurs more severely in areas where it is in critical and over exploited areas. This could be due to over draft of ground water for irrigation, industrial and also for
domestic uses. The erratic rainfall could have acted as catalyst for overexploitation when the deficit rainfall occurs. Because of over draft of ground water especially for irrigation, the areas are becoming contaminated with fluoride. If sufficient rainfall occurs and the draft is within the limits, there could have less contamination.
The ground water quality problem is more severely observed in Semi-Critical, Critical & Over Exploited zones as compared to other safe areas.
In Khondalites and Charnockitic terrain the ground water quality problem is existing especially in the districts of Srikakulam, Vizianagaram Vishakapatnam & part of East Godavari. The ground water quality problem is existing mostly in command areas for the elements Total Dissolved Solids, Total Hardness & Chloride.
It is observed that in forested and safe areas the ground water quality problem does not existing. This implies that the natural cleansing is being done in forested areas and the quality is within permissible limits.
ACKNOWLEDGEMENTS
Authors would like to thankful to Rural Water Supply & Sanitation Department (RWS&S), Govt. of Andhra Pradesh for providing the ground water quality data for entire Andhra Pradesh and specially acknowledge Sri Sanjay Gupta, former Director General, Andhra Pradesh State Remote Sensing Applications Centre (APSRAC) for his valuable suggestions in completing the research study.
REFERENCES
A.K. Das, P. Prakash, C.V.S. Sandilya, and S. Subhani, (2014), “Development of Web-Based Application for Generating and Publishing Groundwater Quality Maps Using RS/GIS Technology and P. Mapper in Sattenapalle, Mandal, Guntur District, Andhra Pradesh”, Proceedings of the 48th Annual Convention of Computer Society of India -- Volume II, AISC, 249, pp 679--686.
APHA (1992). Standard Methods for the examination of water and wastewater’ 18th, 20th ed., Am. Public Health Assoc. Washington, DC, USA.
Basch, M.E., and Funkhouser, R.V., 1985, Irrigation impacts on groundwater levels in Jasper and Newton Counties, Indiana, 1981-84: Indiana Department of Natural Resources, Division of Water, Water Resources Assessment 85-1.
Bergeron, M.P., 1981, Effect of irrigation pumping on the ground-water system in Newton and Jasper Counties, Indiana: U.S. Geological Survey, Water-Resources Investigation 81-38.
Dynamic Ground Water Resources of Andhra Pradesh, 2008-09 (Vol I & II), December 2011
ESRI (2002). “Using Arc GIS spatial analyst”, ESRI Press, Redlands.
Freeze, R.A., and Cherry, J.A., 1979, Groundwater: New Jersey, Prentice?Hall.
Global water supply and sanitation assessment report (2000).
Retrived in February, 8, 2007 from
http://www.who.int/water_sanitation_health/monitoring/globala ssess/ en/.
Gogu RC., Carabin G., Hallet V., Peters V., Dassargues A., (2001), “GIS-based hydrogeological databases and groundwater modeling”, Hydrogeology Journal, Vol.9, pp 555 -569.
Hem, J.D., 1985. Study and Interpretation of the Chemical Characteristics of Natural Water. U.S. Geological Survey Water-Supply Paper 2254.
Indian Standards Institution. (1983), Indian standard for drinking water IS 10500.
Kamaraju MVV., (1977), “Groundwater potential evaluation of West Godavari district, Andhra Pradesh State, India – A GIS approach”, Ground Water, 34(2), pp 318-334.
Lehr, J.H., Gass, T.E., Pettijohn, W.A., and DeMarre, J., 1980, Domestic water treatment: New York, McGraw-Hill, 264 p.
M. Srinivasa Reddy, V. Ratna Reddy, Centre for Economic and Social Studies, Begumpet, Hyderabad - 500016, Research Unit for Livelihoods and Natural Resources (Supported by Jamsetji Tata Trust), Centre for Economic and Social Studies, Begumpet, Hyderabad-500016
P.K.Ramam and V.N.Murty(1997) Geology of Andhra Pradesh, Geological Society of India, 1997.
Raghunath HM (1987) Groundwater. Wiley-Eastern Ltd., New Delhi.
Rosenshein, J.S., and Hunn, J.D., 1968, Geohydrology and ground-water potential of Lake County, Indiana: Indiana Department of Natural Resources, Division of Water, Bulletin 31.
Satish Kumar T, Sudarshan V and Kalpana G (2007) Geochemical characterization of groundwater, banks of Musi river, Hyderabad city, A. P. India. Poll. Res. 26(4), 795-800.
Srinivasa Gowd S., (2005), “Assessment of groundwater quality for drinking and irrigation purposes: a case study of Peddavanka watershed, Anantapur District, Andhra Pradesh”, Indian Journal of Environmental Geology, 48, pp 702-712.
Subramani T., Elango L., Damodarasamy S.R., (2005), “Groundwater quality and its suitability for drinking and agricultural use in Chithar River Basin, Tamil Nadu”, Indian Journal of Environmental Geology, 47, pp 1099-1110.
Sujatha D and Rajeswara Reddy B (2004) Seasonal variation of groundwater quality in the southeastern part of Ranga reddy district, A. P. J. App. Geochem. 6(2), 321-329.
Todd DK. (2007), Groundwater Hydrology, Wiley- India Edition.
Turco, R.F., and Konopka, A.E., 1988, Agricultural impact on groundwater quality: Purdue University, Water Resources Research Center, Technical Report 185.
Twelfth Five Year Plan – 2012-2017, Group On Major & Medium Irrigation and Command Area Development Report, Ministry of Water Resources, Government of India, New Delhi, November, 2011
Twelfth Five Year Plan – 2012-2017, Working Group on Rural Domestic Water and Sanitation Report, Ministry of Drinking Water and Sanitation, Government of India, September 2011.
Vasudeva RPHV (2004). Environmental impact assessment of diversion weirs/check Dams in the tribal area of Visakhapatnam district. Project report.
WHO (1996). Guidelines for Drinking-Water Quality, Recommendation, Vol. 1, 16-17.
Working Paper No. 92, RULNR Working Paper No. 7, December, 2010 Groundwater: Development, Degradation and Management (A Study of Andhra Pradesh)
World Health Organization. (1983), International Standards for Drinking Water, Geneva.
World Health Organization. 1996. Total dissolved solids in Drinking-water: Background document for development of WHO Guidelines for Drinking water Quality. http://www.water-research.net/totaldissolvedsolids.htm.