DEM ASSESSMENT DERIVED FROM CLOSE RANGE PHOTOGRAMMETRY: A CASE
STUDY FROM KADAVUR AREA, KARUR DISTRICT, TAMIL NADU, INDIA
S. Anbarasan a, *, R.Sakthivel b
a
Reserach Scholar, Centre for Remote Sensing, Bharathidasan University, Tiruchirappalli, Tamil Nadu, India -
[email protected]
b
Assistant Professor, Centre for Remote Sensing, University, Tiruchirappalli, Tamil Nadu, India -
[email protected]
Commission V, WG V/6
KEY WORDS: Digital Close Range Photogrammetry (DCRP), DEM Assessment, Commercial Digital camera.
ABSTRACT:
Close-Range Photogrammetry is an accurate, cost effective technique of collecting measurements of real world objects and conditions, directly from photographs. Photogrammetry utilizes digital images to obtain accurate measurements and geometric data of the object or area of interest, in order to provide spatial information for Engineering design, spatial surveys or 3D modeling. The benefits of close-range Photogrammetry over other field procedures are purported to be: Increased accuracy; complete as-built information; reduced costs; reduced on-site time; and effective for small and large projects. The same basic principle of traditional Aerial Photogrammetry can be applied to stereoscopic pictures taken from lower altitudes or from the ground. Terrestrial, ground-based, and close-range are all descriptive terms that refer to photos taken with an object-to-camera distance less than 300m (1000 feet). (Matthews, N.A, 2008). Close range Photogrammetry is a technique for obtaining the geometric information (e.g. position, distance, size and shape) of any object in 3D space that was imaged on the two dimensional (2D) photos, (Wolf, P.R, et.al, 2000) DEM Generation requires many processing and computation, such as camera calibration, stereo matching, editing, and interpolation. All the mentioned steps contribute to the quality of DEM. Image on close range Photogrammetry can be captured using three kind of camera: metric camera, semi-metric camera, and non-metric camera (Hanke, K., et.al, 2002). In this paper DEM quality assessed at Kadavur area, Karur district, Tamil Naudu, India using Close Range Photogrammetry technique, Commercial Digital Camera and Leica Photogrammetry Suite.
1. INTRODUCTION
1.1 Digital Elevation Model
Digital Elevation Model (DEM) is a digital data represented an easting northing and height of object position, in which it can be derived from many data sources and techniques. One such method is a close-range Photogrammetry. It is a technique for obtaining three dimensional (3D) geometric information of any object that was imaged on two dimensional (2D) photographs by an analytical stereo model. Analytical stereo model involves three main steps; interior, relative, and absolute orientations. It requires Ground Control Points (GCP) to determine positions and orientation of the camera and also parameters of coordinate transformations. By these orientations coordinates all features on overlapping area can be transformed into ground coordinate system.
1.2 DCRP Technique
Digital Close Range Photogrammetric digital methods have been successfully applied to many applications such as archaeology, architecture, automotive and aerospace engineering, accident reconstruction and etc (Carbonell, 1989; Atkinson, 1996). With the rapid development in technology, improvement of hardware and software products have affected development in digital close range Photogrammetry. Some studies can be made more economically, more accurately and faster using the recent digital close range Photogrammetry technology or technique. A major advantage with photogrammetric methods is the positive relationship between photo scale and precision. Typically high precision is required for studies involving small areas (i.e large scale photography) and a lower precision is acceptable for larger areas (i.e smaller scale imagery is most efficient) (Chandler et al., 2001).
1.3 The concepts of precision, accuracy and reliability in relation to DEM Quality Assessment
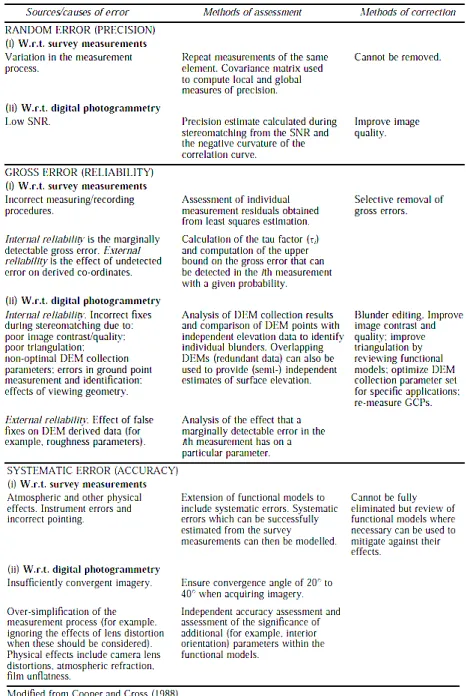
The overall “quality” of the elevation data produced using stereomatching algorithms is of fundamental importance in this research, because this will directly affect any roughness statistics calculated from the DEMs. The quality of a DEM is a function of the accuracy, reliability and precision of the survey/photogrammetric measurements and the block bundle adjustment itself. In order to construct a thorough, systematic data quality assessment procedure, it is necessary to identify the different types of potential errors and their sources (Table 1) and to quantify the probability of there
being errors of a specified size and type. Blunders or mistakes
which occur during survey measurement, photogrammetric measurement or stereomatching may be referred to as gross errors; these can be considered to determine the reliability of the DEM (Table I). Cooper and Cross (1988) define reliability as “a measure of the ease with which outliers may be detected”. In their assessment of the quality of survey data sets, Cooper and Cross (1988) also make the distinction between internal reliability and external reliability. Internal reliability is seen as the size of the marginally detectable gross error in a measurement whereas external reliability is a measure of the effect of this error on the parameters (for example, co-ordinates) or on data computed from them. The tau factor (ti) can be used to quantify the internal reliability of a particular survey measurement and this is simply the ratio of the standard error of a measurement to that of the corresponding correction (Cooper and Cross, 1988).
Table 1. Types and sources of error in conventional survey and close range digital photogrammetry.
Local measures of precision require the variance of individual parameters to be computed from the covariance matrix of the parameter. Global measures of precision, such as the a posteriori variance of unit weight (the variance factor), can be used to quantify the effects of random errors in a complete set of co-ordinates or other derived quantities. The precision of
automated image measurement and stereomatching is positively related to (i) the number of pixels that are associated with a
target (Chandler and Padfield, 1996); and (ii) the signal-to-noise ratio (SNR) of the imagery (Vision International, 1995). Higher image SNRs also lead to fewer gross errors (false fixes) in the
Since the aim of this research is to assess the DEM derived from Digital Close Range Photogrammetry. The equipment and software used were easy to get and its availability.
i) Sony Digital Camera: 10.2 Mega Pixels
Figure: 1 Sony Digital Camera
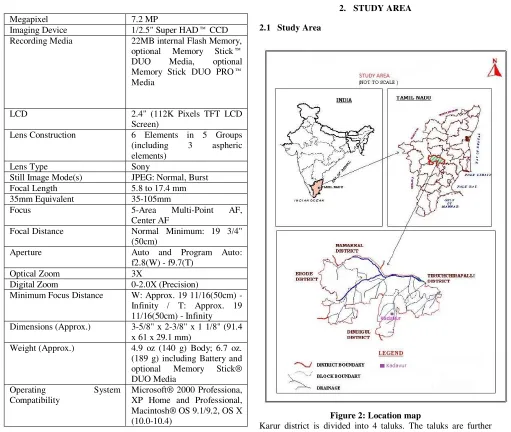
Megapixel 7.2 MP
Imaging Device 1/2.5" Super HAD™ CCD Recording Media 22MB internal Flash Memory,
optional Memory Stick™ DUO Media, optional Memory Stick DUO PRO™ Media
LCD 2.4" (112K Pixels TFT LCD
Screen)
Lens Construction 6 Elements in 5 Groups (including 3 aspheric elements)
Lens Type Sony
Still Image Mode(s) JPEG: Normal, Burst
Focal Length 5.8 to 17.4 mm
35mm Equivalent 35-105mm
Focus 5-Area Multi-Point AF,
Center AF
Focal Distance Normal Minimum: 19 3/4" (50cm)
Aperture Auto and Program Auto:
f2.8(W) - f9.7(T)
Optical Zoom 3X
Digital Zoom 0-2.0X (Precision)
Minimum Focus Distance W: Approx. 19 11/16(50cm) - Infinity / T: Approx. 19 11/16(50cm) - Infinity Dimensions (Approx.) 3-5/8" x 2-3/8" x 1 1/8" (91.4
x 61 x 29.1 mm)
Weight (Approx.) 4.9 oz (140 g) Body; 6.7 oz. (189 g) including Battery and optional Memory Stick® DUO Media
Operating System
Compatibility
Microsoft® 2000 Professiona, XP Home and Professional, Macintosh® OS 9.1/9.2, OS X (10.0-10.4)
Table 2: Technical Specifications of SONY DSC S730
ii) Leica Photogrammetry Software. iii) Global Mapper.
iv) Garmin GPS.
2. STUDY AREA
2.1 Study Area
Figure 2: Location map
Karur district is divided into 4 taluks. The taluks are further divided into 8 blocks, which further divided into 203 villages.
Table 3: Karur Taluk and Block details
2.2 Geology of Tamil Nadu and Kadavur
Crystalline rocks of Archaean to late Proterozoic age occupy over 80% of the area of Tamil Nadu, while the rest is covered by Phanerozoic sedimentary rocks
mainly along the coastal belt and in a few inland River valleys. The hard rock terrain comprises Charnockite and Khondalite groups and their migmatitic derivatives, supracrustal sequences of Sathyamangalam and Kolar groups and Peninsular Gneissic Complex (Bhavani Group), intruded by ultramafic-mafic complexes, basic dykes, granites and syenites. The sedimentary rocks of the coastal belt include fluviatile, fluvio-marine and marine sequences, such as Gondwana Supergroup (Carboniferous to Permian and Upper Jurassic to Lower Cretaceous), marine sediments of Cauvery basin (Lower Cretaceous to Paleogene), Cuddalore Formation (Mio-Pliocene) and sediments of Quaternary and Recent age. The crystalline rocks of the state are derived through a complex evolutionary history during Archaean and Proterozoic times with multiple deformations, anatexis, intrusions and polyphase metamorphic events, (GSI, 2010-11).
2.3 Geomorphology of Karur
The entire area of the district is a pediplain. The Rangamalai hills and Kadavur hills occurring in the southern side of the district constitutes the remnants of the much denuded Eastern Ghats and rise to heights of over 1031 m above mean sea level. From these hills the district slopes gently towards north east and forms a vast stretch of plain country till the eastern boarder of the district. There are numerous small residual hills represented by Ayyarmalai, Thanthonimalai and Velayuthampalayam hills. The general elevation of the area is ranging between 100 m and 200m above mean sea level The prominent geomorphic units identified in the district through interpretation of Satellite imagery are 1) Structural hill, 2) Loam and River Alluvium Soil. Red soil is the predominant one covering major part of the district followed by Thin Red soil and Red loam. The red soils are predominantly seen in Kadavur, Kulithalai, Krishnarayapuram, Thanthoni and Thogamalai blocks. The thin red soils are seen in Aravakurichi and
Image management follows the standard approach in LPS_PM (Leica Photogrammetry Suite – Photogrammetry Management) software as follows
Taple 4. Process Flow
3.1.1 Image Acquisition
The Photogrammetric accuracy is dependent on image scale so 3D Modeling of Quarry must be taken by overlapping digital images acquired with Non-Metric camera Sony Alpha DSLR-A230 and focal length vary from 18mm to 55mm lens. Special care was undertaken so as the horizontal image angles be of small values. This is a fundamental restriction imposed by the structure of the Digital Photogrammetric Stations which are used for Photogrammetric mapping. Wide angles between stereo-pairs do not permit stereoscopic view and as a consequence calculations and three dimensional restitution. The overlapping images has been taken with 20˚ to 45˚ angle in Kadavur Quarry
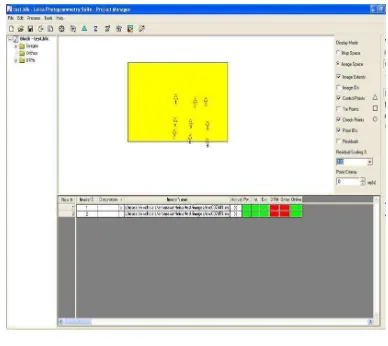
3.1.2 Create New Project
A new project using Sony digital camera images (7.2 mega pixels) of Kadavur Quarry, Tiruchirappalli, India. The images are in the format of .jpg format. Here transformed Cartesian Co-ordinate system is used as mentioned
Figure 3: Project Manager in LPS - GCP Points
Decimal numbering of all sections is recommended. If bold printing is not available to you, use underlining, instead, but only for subheadings and subsubheadings, not for Major Headings.
3.1.3 Add imagery to the block file
Using Add frame tools all the images are added in the LPS project Manager.
3.1.4 Define the Camera Model
According to this paper, the Sony Digital camera- Cybershot has been used which is entered in the Digital Camera Frame Editor dialog box. And other parameter such as Focal Length, Interior Orientation (pixel size of X0, Y0) and Exterior Orientation.
3.1.5 Perform automatic tie point collection
At this point in the process the control points (Fig.4) are collected in overlapping areas of images in the block file that determine the approximate exterior orientation parameters. Using point Measurement tool the Automatic tie point 4 Define the Camera Model 5 Perform automatic tie point
collection
6 Perform Aerial Triangulation
7 DEM Generation
8 DEM Assessment
Figure 4: Automatic Tie Points
Figure 5: Point Measurement (GCP, Tie points, Check points residual checking)
3.1.6 Perform Aerial Triangulation: Now the control points are added using control point sketch. Then Aerial Triangulation property was setup and the run the AT process. Based on the GCP points and Image points residual error (Fig.7) the adjustment was repeated until the residual error within tolerance.
GCP points residual
3.1.7 DEM Generation
DEM was generated from all coordinate points resulted from previous stage and then interpolated by Triangular Irregular Network (TIN) method. The TIN method was selected because of the simplicity and it’s characteristic to maintain the position of known points.
.
3.2 DEM Assessment
The DEM was generated by adding 10% of measured points to the particular surface, which the points were well distributed on the surface. The same process was repeated adding each time an additional 10% of the measured points, until the last DEM was created with 100% of the points. The point density ranging from 10% to 100% given. Each model was then compared to the reference DEM. Each model was then compared to the reference DEM so the morphological of the rock surface were viewed and determined.
Figure 6: Relationship between RMS Error and Point Density
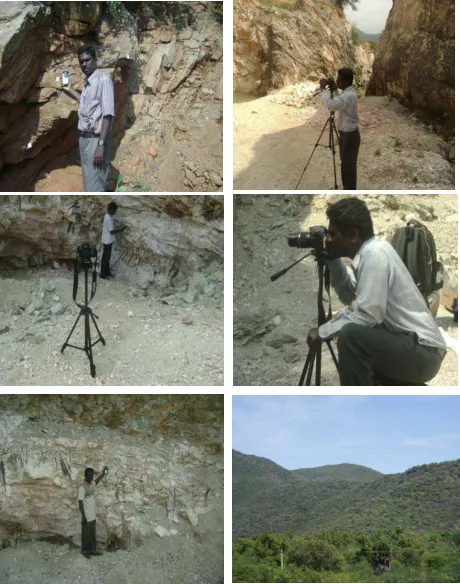
3.3 Field Photos:
The following photos are Field survey photo at Kadavur area.
Figure 7: Field Photos
0 0.1 0.2
10 20 30 40 50 60 70 80 90 100
igh
t
R
M
S
E
r
r
o
r
(
m
)
Point density (%)
RELATIONSHIP BETWEEN
RMS ERROR AND POINT
DENSITY
3.4 References and/or Selected Bibliography
References from Journals:
Atkinson, K.B., 1996. Close Range Photogrammetry and Machine Vision, Whittles Publishing, Scotland.
Carbonell M., 1989. “Arquitectural photogrammetry”. In: Karara HM, editor, Non-Topographic Photogrammetry. Falls Church, Virginia: ASPRS
Cooper, M. A. R. and Cross, P.A., 1988. Statistical concepts and their application in photogrammetry and surveying. Photogrammetric Record, 12(71): 637–663.
References from Other Literature:
Matthews, N.A., 2008. Aerial and Close-Range Photogrammetric Technology: Providing Resource Documentation, Interpretation, and Preservation. Technical Note 428. U.S. Department of the Interior, Bureau of Land Management, National Operations Center, Denver, Colorado. 42 pp.
4. CONCLUSION
4.1 Conclusion
DEM can be derived by using point-based matching from stereo photographs by Digital Stereo Model for Kadavur area. Significant improvement on the DEM quality was achieved by adding point density up to 60%. Increasing point density above 60% shows minimal variation on the error in elevation interpolation. Digital Close Range Photogrammetry (DCRP) can be applied due to reliability, accuracy, safety and cost advantages over conventional measurement techniques. In addition to these advantages, the 3D models which are obtained can be used for to measure the finite particles of rock surface and it’s orientation of structural weakness such as small fracture , small cracks and cleavage. The geological structures are identified such as cleavage, minor cracks and minor fractures and mica assemblages. And any irrespective of the field to gather more finite detail information using DCRP technique.