CO-REGISTRATION BETWEEN MULTISOURCE REMOTE-SENSING IMAGES
Joz Wu a,*, Chi Chang b, Hsien-Yu Tsai b, Ming-Che Liu b a
CSRSR, National Central University, Jhongli, Taiwan – [email protected]
bDept. of Civil Engineering, National Central University, Jhongli, Taiwan – [email protected]
Commission III, WG III/5
KEY WORDS: Registration, Least-Squares Matching, SIFT, TPS, RANSAC
ABSTRACT:
Image registration is essential for geospatial information systems analysis, which usually involves integrating multitemporal and multispectral datasets from remote optical and radar sensors. An algorithm that deals with feature extraction, keypoint matching, outlier detection and image warping is experimented in this study. The methods currently available in the literature rely on techniques, such as the scale-invariant feature transform, between-edge cost minimization, normalized cross correlation, least-squares image matching, random sample consensus, iterated data snooping and thin-plate splines. Their basics are highlighted and encoded into a computer program. The test images are excerpts from digital files created by the multispectral SPOT-5 and Formosat-2 sensors, and by the panchromatic IKONOS and QuickBird sensors. Suburban areas, housing rooftops, the countryside and hilly plantations are studied. The co-registered images are displayed with block subimages in a criss-cross pattern. Besides the imagery, the registration accuracy is expressed by the root mean square error. Toward the end, this paper also includes a few opinions on issues that are believed to hinder a correct correspondence between diverse images.
* Corresponding author. This is useful to know for communication with the appropriate person in cases with more than one author. 1. INTRODUCTION
In general, there are image feature- and area-based matching methods. Linear features can be extracted from a portion of an image where the gray-level gradient varies (Tupin and Roux, 2003). On the other hand, the coefficient of correlation between two image windows may serve as an index for gauging the degree of similarity (Wolf and Dewitt, 2000). A hybrid method allowing for both feature- and area-based matching techniques is considered more versatile than either method operating alone. No doubt, the design of a hybrid strategy could lead to a more complex algorithm with heavy computation. Often, this is a blessed trade-off because of the increased reliability of point determination.
This paper is motivated to devise an algorithm that stresses not only the matching accuracy and robustness between images, but also the scale- and rotation-invariance between them. Many generic methods for feature extraction and image registration exist (Dare and Dowman, 2001; Mikolajczyk and Schmid, 2005). In particular, Lowe (2004) published a scale-invariant feature transforming methodology, which allows us to generate a large number of descriptor-based keypoints. Gross errors in the coordinates of the image keypoints have to be detected and removed, on a probabilistic basis (Schwarz and Kok, 1993; Vennebusch et al., 2009). Indeed, the filtered feature points possess good coordinate approximates. They may serve as initial values for the subsequent high-precision least-squares image matching.
2. METHODOLOGY 2.1 Feature Points by SIFT
The SIFT (Scale-Invariant Feature Transform) algorithm by Lowe (2004) has been famously known for its insensitivity to imaging scale and orientation changes, and to scene illumination differences, thereby allowing it to be widely
accepted in disciplines like computer vision, photogrammetry and remote sensing. In the framework of image pyramiding, convolution with blurring Gaussian kernels is carried out first. The images are consecutively differenced to yield a stack of scale-space images containing potential high-pass feature points.
Symbol D is used to represent the resulting images as
x x x x x x
2 2
2 1 ) ( ) (
D D D
D T T , based on truncated
Taylor’s expansion with the capital superscript standing for
transposition, and with xT (x ,y ,), a vector having the line
x (pixel), sample y (pixel) and scale coordinates. For an extreme keypoint, the differentiated equation of D with respect
to x is 0
x x
x
D D
2 2
. Consequently, one obtains
x x x
D 1 D 2 2
) (
ˆ . After back-substitution, the image is
identified as
x x
x ( ) ˆ
2 1 ) ˆ
( D D T
D
(1)
The magnitude and orientation of gray-level gradients in the image closest to a keypoint results in an orientation histogram that accounts for a relative rotation between image windows, within a plus or minus 5-degree tolerance. Based on the aligned image at a keypoint, an SIFT user sets up a vector of 128 descriptive elements. Search for the corresponding point to form a pair relies on a minimization of the Euclidean distance between two descriptive vectors.
2.2 Area-based Matching
Generally speaking, the method of LSM (Least-Squares Matching) outperforms that of normalized cross correlation because the former incorporates affine parameters into the
International Archives of the Photogrammetry, Remote Sensing and Spatial Information Sciences, Volume XXXIX-B3, 2012 XXII ISPRS Congress, 25 August – 01 September 2012, Melbourne, Australia
matching model. For the target g(x ,y) and search q(l ,s) images, the line and sample coordinates (pixel) are expressed as
y
Differencing pixel values may lead to a gray-level function as .
mean residual error having the Gaussian distribution, or
)
Linear expansion at approximate unknowns results in a system
of error equations, defined as vAxl with 02Q . By referring to Mikhail (1976), one obtains the least-squares solution of unknown parameters as
l Q A Q
x x T 1 (2)
where apart from scaling, the covariance matrix,
1 1
)
(
A Q A
Qx T , results from error propagation. The
solution for measurement residuals is given by the lAx term, resulting in vQvQ1l, where Qv (Q AQxAT) is the
corresponding covariance matrix.
A variance-component estimator is eventually formed by Wu et al. (2009) as
The simplified BIQUE (Best Invariant Quadratic Unbiased Estimator) by Crocetto et al. (2000) is an alternative method. Intuitively, adaptive weights in terms of the inverse of
i unchanged during iterative processing.
2.3 Reliability of the Matched Points
As implied, RANSAC (Random Sample Consensus) distinguishes inliers from outliers by requiring that any n -member subgroup of inlying data points leads to only one set of model parameters. When the w symbol stands for the probability of a data point consistent with an affine transformation model and the z symbol for the probability of selecting an error-free n-member set, Fischler and Bolles (1981) have shown that the number k of attempts for the removal of
outliers can be computed by equating the (1wn)k term with
According to Schwarz and Kok (1993), the vi residual
normalized by the standard deviation of vi has a tau distribution, which is related to Student’s t distribution by
2
where nu means the degree of freedom. The normalized residuals are treated in hypothesis testing as a test statistic, gauged by a threshold at a 5 percent significance level. The
blunder is removed one at a time so that the algorithm is termed IDS (Iterated Data Snooping).
As calculation of the covariance matrix for a large number of data residuals can grow burdensome, the RANSAC algorithm is usually conducted first. For the remaining data points, IDS could be invoked to ensure that indeed they are regular samples of an experiment at hand. Because of the difference in theory, RANSAC and IDS are expected to be complementary.
2.4 Thin-plate Spline Interpolation
TPS (Thin-Plate Splines) stands for a flexible function in that it emulates the minimized bending energy of a metal plate on multiple tie-point constraints. A trend surface stems from a global, affine transformation between two overlapping images.
If the x and y symbols denote the transformed line and sample coordinates (pixel), coordinate discrepancies at m
conjugate points can be expressed as xT(x1x1 , interpolation point, TPS actually involves both trend and discrepancy values, conforming to the concept of a remove-and-restore operation (Darbeheshti and Featherstone, 2009).
In determining weights, a special matrix is defined as
where with rjk meaning a Euclidean distance between points j
and k, both {1,2, ,m}, )K(r is the so-called fundamental solution of the biharmonic equation and takes on the form
2 2
log )
(r r r
K . An interim vector consisting of weight
coefficients is computed to be wxK1x and wyK1y,
in the respective line and sample directions.
At a place i other than the locations of the m tie points, a vector
exists, kTi (K(ri1),K(ri2), ,K(rim)). In association with the
x
w and wy weights, the ki vector is employed for an
interpolation in a field of coordinate discrepancies, as follows (Du et al., 2008)
The corresponding values from the trend function have to be added to those of Equation 7, or xixi and yiyi, in order to achieve the TPS-based warping and resampling for the purpose of image registration. Later, the difference in performance between an affine transform and the thin-plate spline warping methods will be assessed.
3. MULTISOURCE IMAGE TESTS 3.1 SPOT and Formosat images
A combination of SPOT green (500–590 nm) and Formosat infrared (760–900 nm) bands and a plain rural area (Figure 1;
International Archives of the Photogrammetry, Remote Sensing and Spatial Information Sciences, Volume XXXIX-B3, 2012 XXII ISPRS Congress, 25 August – 01 September 2012, Melbourne, Australia
400 400 and 600 600 pixels, respectively) are chosen for a test on image registration. SIFT could only provide faulty tie points because of stark differences in the gray-level appearance, especially of farmland.
SPOT-5 (green band)
© 2006 CNES
Formosat-2 (infrared band)
© 2006 NSPO Master Slave Figure 1. Distribution of 119 edge-detected, cost-optimized and LSM-matched conjugate tie-points, after removal of blunders by IDS at a 5 percent significance level.
Figure 2. Registration between the dark SPOT-5 green and bright Formosat-2 infrared images, in a regularly gridded format; to the right, a local aquiculture pond area is enlarged.
Still, an alternative technique depends on three to four manual seed points in an initial affine transform to align the experimental images. One detects linear edges by the Canny operator. Point correspondence is then established by the least cost resulting from a function that is made dependent upon between-point distance and between-edge angular error.
Potential homologous point pairs serve as input to LSM in terms of Equations 2–3, where the least-squares IDS is activated to safeguard against likely blunders. The final matching result is displayed in Figure 4. The TPS algorithm utilizes the available tie points to warp the Formosat-2 Level-1A 8-m slave image onto the geocoded SPOT-5 10-m master image. Figure 2 displays the warped result, employing alternate square subimages for visual impression.
As far as the accuracy of image registration is concerned, 57 point pairs were chosen randomly for checking. With 4 peripheral corner points serving as basic control, there were in total 62 tie points in controlling image warping. The computer program was executed for a series of 30 trial runs, and the averaged distance RMS error amounted to 0.50 pixels, as seen in Figure 3. Accuracy difference between the affine transform
and TPS warping results that passed a significance test could be partly due to an uneven point distribution.
Figure 3. Comparison of registration accuracy between affine- and TPS-based methodologies, during which there were 57 different check points each time. The RMS values are different, and their difference is significant, by a Fisher test at a 10 percent level.
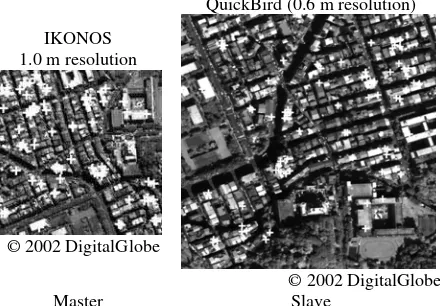
3.2 IKONOS and QuickBird images
An urban sector near a temple in Taipei and its meter-level panchromatic 1A satellite images are illustrated in Figure 4. The 400 400 pixels IKONOS master image was scanned with 1.0-m ground sampling distance on February 21, 2002. The 800 800 QuickBird 0.6-m resolution slave image was taken on December 15, 2002. In total, there are 84 matched point pairs.
IKONOS 1.0 m resolution
© 2002 DigitalGlobe
QuickBird (0.6 m resolution)
© 2002 DigitalGlobe
Master Slave Figure 4. Satellite images from different viewing angles with
84 image tie-points determined by employing an algorithm that involves the SIFT, RANSAC and LSM techniques.
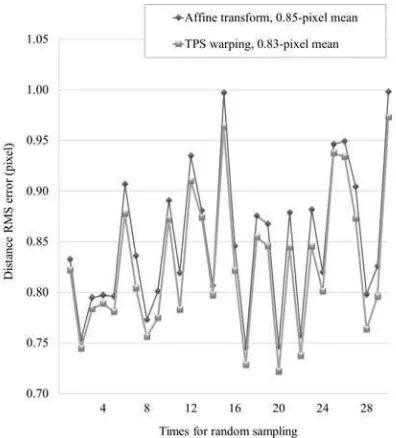
The TPS-structured method is employed to co-register the IKONOS and QuickBird images. Part of the registered QuickBird image to the IKONOS image is displayed in Figure 5. In close inspection, roof edges are continuously linked across the boundary. As usual, the effect on registration accuracy of randomly distributed 44 control and 40 check points is documented in Figure 6. Since all conjugate points lie on rooftops, it appears that an affine relationship between the space images can accommodate geometric distortion very well.
International Archives of the Photogrammetry, Remote Sensing and Spatial Information Sciences, Volume XXXIX-B3, 2012 XXII ISPRS Congress, 25 August – 01 September 2012, Melbourne, Australia
Figure 5. Co-registration between the diagonal QuickBird and off-diagonal IKONOS subimages, overlaid in a checkerboard mode; A zooming-in window is attached for a close look at the seams.
Figure 6. Registration accuracy of high-resolution satellite images in radial RMSs; while the number of control and check points did not change, their spatial distribution altered. Both the affine and TPS algorithms work equally well, at a 10 percent significance level.
4. CONCLUSIONS AND OUTLOOK
Both the RANSAC and IDS processings are aimed at an exclusion of gross errors, with RANSAC being the preferred approach because it is a fast technique in handling huge datasets. If two images look dissimilar in brightness, the SIFT processing may be replaced by a technique based on between-edge cost minimization. Our algorithmic development takes full advantage of the complementary characteristics. Practically, it is meaningful to continue experimentation to learn under which circumstances the TPS methodology can reveal its merits.
Nonetheless, trials with the current computer program version to co-register optical Formosat-2 and radar ERS-2 images were poor and thus unworthy of noting. This is a persisting challenge that awaits to be overcome. Consequently, in a generalized term, one of our research goals is to devise a method that allows us to efficiently conduct digital interpretations regarding the fusion between heterogeneous images and line maps.
REFERENCES
Crocetto, N., M. Gatti, and P. Russo, 2000. Simplified formulae for the BIQUE estimation of variance components in disjunctive groups, Journal of Geodesy, 74(6), pp. 447–457. Darbeheshti, N., and W. E. Featherstone, 2009. Non-stationary
covariance function modeling in 2D least-squares collocation,
Journal of Geodesy, 83(6), pp. 495–508.
Dare, P., and I. Dowman, 2001. An improved model for automatic feature-based registration of SAR and SPOT images, ISPRS Journal of Photogrammetry and Remote Sensing, 56(1), pp. 13–28.
Du, Q., N. Raksuntorn, A. Orduyilmaz, and L. M. Bruce, 2008. Automatic registration and mosaicking for airborne multispectral image sequences, Photogrammetric Engineering & Remote Sensing, 74(2), pp. 169–181.
Fischler, M. A., and R. C. Bolles, 1981. Random sample consensus: a paradigm for model fitting with applications to image analysis and automated cartography, Communications of the ACM, 24(6), pp. 381–395.
Lowe, D. G., 2004. Distinctive image features from scale-invariant keypoints, International Journal of Computer Vision, 60(2), pp. 91–110.
Mikhail, E. M., 1976. Observations and Least Squares, University Press of America, Lanham, Maryland, 497 p. Mikolajczyk, K., and C. Schmid, 2005. A performance
evaluation of local descriptors, IEEE Transactions on Pattern Analysis and Machine Intelligence,27(10), pp. 1615–1630. Schwarz, C. R., and J. J. Kok, 1993. Blunder detection and data
snooping in LS and robust adjustments, Journal of Surveying Engineering, 119(4), pp. 127–136.
Tupin, F., and M. Roux, 2003. Detection of building outlines based on the fusion of SAR and optical features, ISPRS Journal of Photogrammetry and Remote Sensing, 58(1–2), pp. 71–82.
Vennebusch, M., A. Nothnagel, and H. Kutterer, 2009. Singular value decomposition and cluster analysis as regression diagnostics tools for geodetic applications,
Journal of Geodesy, 83(9), pp. 877–891.
Wolf, P. R., and B. A. Dewitt, 2000. Elements of Photogrammetry with Applications in GIS, McGraw-Hill, Singapore, 608 p.
Wu, J., C. Chang, C. P. Wang, and M. C. Liu, 2009. Conjugate image points by an adaptive estimator for the gray-level variance, Journal of the Chinese Institute of Engineers, 32(5), pp. 657–665.
International Archives of the Photogrammetry, Remote Sensing and Spatial Information Sciences, Volume XXXIX-B3, 2012 XXII ISPRS Congress, 25 August – 01 September 2012, Melbourne, Australia