COMBINATION OF GENETIC ALGORITHM AND DEMPSTER-SHAFER THEORY OF
EVIDENCE FOR LAND COVER CLASSIFICATION USING INTEGRATION OF SAR
AND OPTICAL SATELLITE IMAGERY
H. T. Chu* and L. Ge
School of Surveying and Spatial Information Systems, The University of New South Wales, Sydney NSW 2052, AUSTRALIA
Ph. +61 2 93854174, Fax. +61 2 9313 7493 ht.chu@student.unsw.edu.au
Commission VII, Working Group VII/4
KEY WORDS: Accuracy, Classification, Feature, Integration, Land Cover, Landsat, SAR, Texture
ABSTRACT:
The integration of different kinds of remotely sensed data, in particular Synthetic Aperture Radar (SAR) and optical satellite imagery, is considered a promising approach for land cover classification because of the complimentary properties of each data source. However, the challenges are: how to fully exploit the capabilities of these multiple data sources, which combined datasets should be used and which data processing and classification techniques are most appropriate in order to achieve the best results. In this paper an approach, in which synergistic use of a feature selection (FS) methods with Genetic Algorithm (GA) and multiple classifiers combination based on Dempster-Shafer Theory of Evidence, is proposed and evaluated for classifying land cover features in New South Wales, Australia. Multi-date SAR data, including ALOS/PALSAR, ENVISAT/ASAR and optical (Landsat 5 TM+) images, were used for this study. Textural information were also derived and integrated with the original images. Various combined datasets were generated for classification. Three classifiers, namely Artificial Neural Network (ANN), Support Vector Machines (SVMs) and Self-Organizing Map (SOM) were employed. Firstly, feature selection using GA was applied for each classifier and dataset to determine the optimal input features and parameters. Then the results of three classifiers on particular datasets were combined using the Dempster-Shafer theory of Evidence. Results of this study demonstrate the advantages of the proposed method for land cover mapping using complex datasets. It is revealed that the use of GA in conjunction with the Dempster-Shafer Theory of Evidence can significantly improve the classification accuracy. Furthermore, integration of SAR and optical data often outperform single-type datasets.
1. INTRODUCTION
1.1 Integration of optical and SAR
Synergistic uses of different kind of remote sensing data, particularly, multispectral and SAR imagery for land cover classification has become an attractive research area since advantages of each kind of data sources can be integrated together in order to enhance the classification performance. Many studies based on the combination approach using different datasets and classification techniques have been conducted (e.g. Erasmi and Twelve 2009, Sheoran et al. 2009, Chu and Ge 2010, Ruiz et al. 2010). Most authors reported that the integration of multiple types of data has led to improvement in classification performance.
Although use of multiple types of remote sensing data has high potential to increase the classification accuracy it also makes data volume increase rapidly with large amount of highly correlated features and redundant information. Unfortunately, employing large data volume does not always result in an increase in classification accuracy. In contrary, it will also increase uncertainty within dataset and could reduce classification accuracy significantly. According to Kavzoglu and Mather (2003) a large amount of data inputs decreases
out that utilisation of too much input data may not improve (but can actually decrease) the classification accuracy, and it is important to select only input variables that are useful for discriminating land cover classes. Hence, the challenging task is how to select optimally combined datasets which give the best classification.
The Feature Selection (FS) techniques often employed to search for optimal or nearly optimal input datasets. Many FS methods have been used in remote sensing such as exhaustive search, forward and backward sequential feature selection, simulated annealing and Genetic Algorithm (GA). Numerous studies have shown that the GA technique is very efficient in dealing with large datasets and has a larger chance to avoid a local optimal solution than other methods (Huang et al. 2006, Zhou et al. 2010). Another advantage of the GA techniques is its capability to search for input features and parameters of classifier simultaneously.
1.2. Classification techniques
Applying appropriate classification algorithms is also very important for land cover classification. The traditional parametric classification algorithms such as Minimum Distance, Maximum Likelihood (ML) classifiers have been used widely to
However, the major limitation of these classifiers relied on its statistic assumptions which are not sufficiently model remote sensing data (Waske and Benediksson, 2007). This nature cause remarkable difficulties for parametric classifiers to incorporate different kinds of data for classification. Unlike conventional classifiers, the non-parametric classification algorithms such as Artificial Neural Network (ANN) or Support Vector Machine (SVM) are not constrained on the assumption of normal distribution and are therefore considered more appropriate for handling complex datasets.
1.3. Classifier combinations
One of the recent technical development for mapping land cover features is classifier combination or Multiple Classifier System (MCS). Each kind of classification algorithm has its own merits and limitations. The classifier combination techniques can take advantages of each classifier and improve the overall accuracy. Application of multiple classifier system (MCS) in remote sensing has been discussed in Benediksson et al. (2007). There are many methods for combine classifier such as Majority Voting, Weigh Sum, Bagging or Boosting. Du et al. (2009) used different combination approach including parallel and hierarchical classifier systems, training samples manipulation with Bagging and Boosting techniques for classifying hyperspectral data. Foody et al. (2007) integrated five classifiers based on majority voting rule for mapping fenland East Anglia, UK. Salah et al. (2010) employed the Fuzzy Majority Voting techniques to combine classification results of three classifiers over four different study areas using lidar and aerial images. The other technique which has been applied successfully for classifier’s combination is Dempster-Shafer (DS) theory (Du et al. 2009, Trinder and Salah 2010).
Although both FS and the MCS techniques have been used widely for classify remote sensing data this study is probably the first effort to integrate these techniques for classifying multi-source satellite imagery.
In this study, an approach, in which synergistic use of a FS methods with Genetic Algorithm (GA) and multiple classifiers combination based on Dempster-Shafer Theory of Evidence, is proposed and evaluated for classifying land cover features in New South Wales, Australia. We called this approach FS-GA-DS model.
2. STUDY AREA AND USED DATA
The study area was located in Appin, New South Wales, Australia, centred around the coordinate 150o44’ 30” E; 34o 12’ 30” S. The site is characterised with diversity of covered features such as native dense forest, grazing land, urban & rural residential areas, facilities and water surfaces.
Remote sensing data used for this study includes:
Optical: Three Landsat 5 TM+ images acquired on 25/03/2010, 10/9/2010 and 31/12/2010 with 7 spectral bands and the spatial resolution is 30m. In this study 6 spectral bands except the thermal band were used.
Synthetic Aperture Radar (SAR): 6 ENVISAT/ASAR VV polarization and 6 ALOS/PALSAR HH polarization images acquired in 2010 (Table 1).
Satellite/Sensors Date Polarization Mode
04/01/2010 HH Ascending
22/05/2010 HH Ascending
ALOS/PALSAR 07/07/2010 HH Ascending
22/08/2010 HH Ascending
07/10/2010 HH Ascending
22/11/2010 HH Ascending
03/04/2010 VV Descending
24/06/2010 VV Ascending
ENVISAT/ASAR 25/06/2010 VV Descending
27/06/2010 VV Ascending
28/06/2010 VV Descending
25/09/2010 VV Descending
Table 1. ENVISAT/ASAR and ALOS/PALSAR images for the study area.
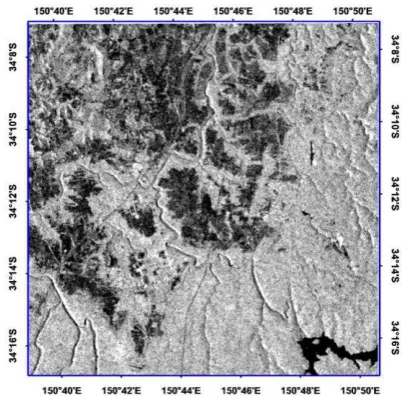
Figure 1. ENVISAT/ASAR VV polarized image acquired on 25/09/2010
Figure 2. ALOS/PALSAR HH polarized image acquired on 07/10/2010
Figure 3. Landsat 5 TM+ images (false colour) acquired on coordinate system (UTM projection, WGS84 datum) and resampled to 15m pixel size. The Enhanced Lee Filter with a 5x5 window size was applied to filter speckle noises in the SAR images. SAR backscattered values were converted to decibel (dB) by the following equation:
where Db, DN are magnitude values.
Textural data, which provides information on spatial patterns and variation of surfaced features, plays an important role in image classification (Sheoran et al. 2009). In this work, first- and second-order texture measures (grey-level co-occurrence matrix or GLCM) were extracted for classification. The First Principal Components (PC1) images computed from each of multi-date ALOS/PALSAR, ENVISAT/ASAR and Landsat 5 TM+ image datasets were used for generating multi-scale textural information. Finally, three first-order texture measures, including Mean, Variance and Data range, and four GLCM texture measures, namely Variance, Homogeneity, Entropy and Correlation with 4 window sizes 5x5, 9x9, 13x13 and 17x17 were selected.
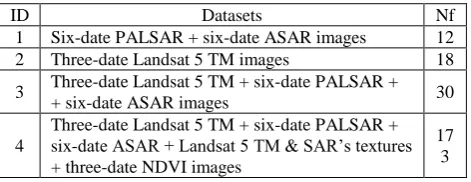
Normalized Difference Vegetation Indices (NDVI) images were computed from the Red and Near Infrared bands of Landsat 5 TM+ images. Four different combined datasets had been generated and applied for the classification processes (Table 2).
ID Datasets Nf
1 Six-date PALSAR + six-date ASAR images 12 2 Three-date Landsat 5 TM images 18 3 Three-date Landsat 5 TM + six-date PALSAR +
+ six-date ASAR images 30
4
Three-date Landsat 5 TM + six-date PALSAR + six-date ASAR + Landsat 5 TM & SAR’s textures + three-date NDVI images
17 3
3.2 Classification
Three non-parametric classifiers are employed for classification processes, including Artificial Neural Network (ANN) with a Back Propagation algorithm (BP), Kohonen Self-Organizing Map (SOM) and the Support Vector Machine (SVM).
Artificial neural network (ANN)
Artificial Neural Networks are nonparametric method which has been used largely in remote sensing, particularly for classification (Tso and Mather 2009, Bruzzone et al. 2004). The Multi Layer Perception (MLP) model using the Back Propagation (BP) algorithm is the most well-known and commonly used ANN classifiers. The ANN classifier often provides higher classification accuracy than the traditional parametric classifiers. (Dixon and Candade 2008, Kavzoglu and Mather 2003). In this study, we used the MLP-BP model with three layers including input, hidden and output layer. The number of neurones in the input layer is equal to a number of parameters were set as follows: Maximum number of iteration: 1000; learning rate: 0.01-0.1; training momentum: 0.9. The classification were run using the Matlab 2010b ANN toolbox.
Self-Organizing Map Classifier (SOM)
The Self-Organizing Map (SOM), which was developed by the Tewu Kohonen in 1982, is another popular neural network classifier. The SOM network has unique property that it can automatically detects (self-organizing) the relationships within the set of input patterns without using any predefined data models (Salah et al. 2009, Tso and Mather 2009). Previous studies revealed that SOM are effective method for classifying remotely sensed data (Salah et al. 2009, Lee and Lathrop 2007). In this work, the input layer is dependent on different input datasets. The output layer of SOM was a two dimension array of 15x15 of neurons (total 225 neurons). The neurones in the input layer and output layer are connected by synaptic weights which are randomly assigned within a range of 0 to 1.
Support Vector Machines (SVM)
SVM is also a favourite non-parametric classifier. This is a recently developed technique and is considered as a robust and reliable in the field of machine learning and pattern recognition (Waske and Benediksson, 2007, Kavzoglu and Colkesen 2009). SVM separates two classes by determining an optimal hyper-plane that maximises the margin between these classes in a multi-dimensional feature space (Kavzoglu and Colkesen 2009). Only the nearest training samples –namely ‘support vectors’ in the training datasets are used to determine the optimal hyper-plane. As the algorithm only considers samples close to the class boundary it works well with small training sets, even when high-dimensional datasets are being classified. The SVMs have been applied successfully in many studies using remote sensed imagery. In these studies the SVMs often provided better (or at least at same level of) accuracy as other classifiers (Waske and Benedikson, 2007). In this work, the SVM classifier with a Gausian radical basis function (RBF) kernel has been used because of its highly effective and robust capabilities for handling of remote sensing data (Kavzoglu and Colkesen 2009). Two parameters need to be optimally specified in order to ensure the best accuracy: the penalty parameter C and the width
For other cases a grid search algorithm with multi-fold cross-validation was used.
GA techniques
The concept of the GA method is based on the natural selection process, which has its roots in biological evolution. At the function and operations such as selection, crossover and mutation. The application of GA model involves designing of the chromosomes, the fitness function and architecture of the system. The chromosome is usually an array of bits which represents the individuals in the population. An objectives function play important role in the GA method, it is designed and utilized to evaluate the qualities of candidate subsets. In this paper, we proposed a fitness function which made uses of classification accuracy, number of selected features and average correlation within selected features.
where OA = overall classification accuracy (%) WOA = weight for the classification accuracy, Wfs = weight for the number of selected features NS = number of selected features
N = the total number of input features.
Cor = average correlation coefficients of selected bands The values of WOA and Wfs were set within 0.65-0.8 and 0.2-0.35, respectively. The other parameters for the GA were:
Population size = 20-40; Number of generations = 200; Crossover rate: 0.8; Elite count: 3-6; Mutation rate: 0.05. Firstly, the GA was implemented for each combined datasets using the SVMs, ANN and SOM classifiers. These processes will give the classification results of each classifier with corresponding optimal datasets and parameters. After that the classification results were combined using Dempster –Shafer theory. The commonly used Majority Voting (MV) algorithm SOM classifier over different datasets using feature selection and non-feature selection approach is summarised in the table 3.
Datasets
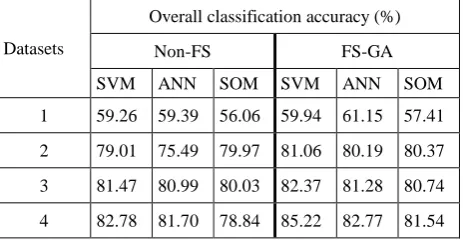
Table 3. Comparison of classification performance between FS-GA and non-FS approach.
The classification results illustrated the efficiencies of the synergistic uses of multi-date optical and SAR images. Both non-FS and FS with GA (FS-GA) methods gave significant increase in classification accuracy while the combined datasets (3rd and 4th) were applied.
As for the non-FS approach the combined multi-date Landsat 5 TM+ and SAR data increase overall accuracy by 2.46% and 22.1% for SVM, 5.5% and 21.6% for ANN and 0.06% and 23.97% for SOM compared to the cases that only multi-date Landsat 5 TM+ or SAR images was used. These improvements were even more significant while the FS method were applied. Textural information and NDVI are valuable data for land cover classification. In most of cases, the integration of these data enhances classification results noticeably. For instances, with the FS-GA approach, the classification of a combination of original optical and SAR images with their textural and NDVI data (4th dataset) gave increases of overall accuracy by 2.85%, 1.49% and 0.80% for SVM, ANN and SOM classifiers, respectively.
It is clearly that, the FS-GA approach performed better than the traditional non-FS approach. For all of datasets and classifiers that have been evaluated, the FS-GA approach gave significant improvements in the classification accuracy. The increases of overall classification accuracy ranging from 0.29% (ANN classifier with the 3rd dataset) to 2.70% (SOM classifier with the 4th dataset). The highest accuracy of 85.22% was achieved by necessary increase the classification accuracy. In a non-FS method, the accuracy of classification using SOM algorithm for the 4th dataset was actually reduced by 1.19% compared to the case of 3rd dataset. However, this problem does not happen while applying the FS-GA technique. In this case, the accuracy of SOM algorithm slightly increased by 0.80%.
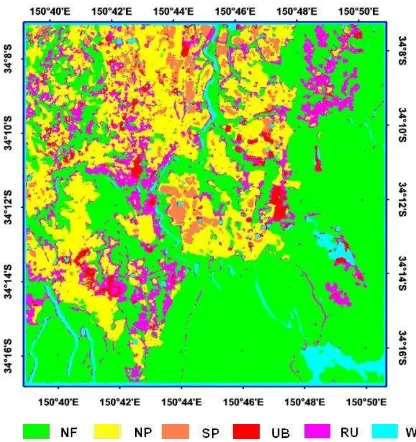
The Figure 4 below showed the results of classification using the FS-GA techniques with the SVM classifier which gave the best accuracy among single classifier for the 4th dataset.
Figure 4. Results of classification using FS-GA with SVM classifier.
The improvements of classification accuracy by using FS-GA technique for different classifiers and combined datasets is shown in the Figure 5.
Figure 5. Improvements of accuracy by applying FA-GA techniques for SVM, ANN and SOM classifiers.
The comparison of classification results between the best classifier in non-FS, FS-GA approach and the multiple classifier combination using Dempster-Shafer theory (FS-GA-DS) is given in the table 4 and figure 6.
Datasets Overall classification accuracy (%) Non-FS FS-GA FS-GA-DS
1 59.39 61.15 62.56
2 79.97 81.06 82.30
3 81.47 82.37 83.80
4 82.78 85.22 88.29
Table 4. Comparison of best classification results using non-FS, FS-GA and FS-GA-DS classifier combination method.
Figure 6. Comparison of best classification results of non-FS, FS-GA and FS-GA-DS methods on different datasets.
Although the FS-GA model has already produced significant increase in the classification accuracy of evaluated multisource remote sensing datasets, the integration of multiple classifiers combination with FS-GA method has even further remarkably improved the classification performance. The FS-GA-DS algorithm always gave better accuracy than any best single classifier in all cases. The range of classification improvements was from 1.24% for the 2nd dataset to 3.07% for the 4th dataset as compared to the FS-GA model. Of course, increases in classification are even much more significant as compared to the traditional non-FS method. The highest classification accuracy obtained by the FS-GA-DS model was 88.29% with the largest combined datasets. The comparison of improvements in classification performance between GA and non-FS; FS-GA-DS and FS-GA was given in the figure 7 below.
One of the probably reason behind the successful of the FS-GA-DS model is its capability to integrate various optimal (or nearly optimal) solutions given by the GA method for specific classifier such as SVM, ANN or SOM to enhance the generality of the final solution.
Figure 7. Improvements of overall classification accuracy achieved by using FS-GA and FS-GA-DS model.
The Majority Voting (MV) algorithm is also very effective for combining classification results. However, it gave a slightly lower accuracy than the DS algorithm. Results of MV and DS algorithms were shown in the Table 5.
Algorithm Datasets
1 2 3 4
DS 62.56 82.30 83.80 88.29 MV 61.98 82.30 83.52 88.22 Table 5. Classification accuracy by applying DS and MV
5. CONCLUSIONS
In this paper, the integration of FS using GA method and the MCS techniques with DS algorithm has been proposed and implemented for classifying different combined datasets of multi-date ENVISAT/ASAR, ALOS/PALSAR and Landsat 5 TM+ images. Results of classification revealed that the proposed (FS-GA-DS model) method outperform both classical non-FS and FS-GA method. The FS-GA-DS model always gave significantly higher accuracy than any single best classifier. The FS-GA-DS method produced the highest overall classification accuracy of 88.29% for the largest combined dataset consisted of original SAR and optical images, their textural information and NDVI. The FS-GA method is also an effective method for classification of multisource remote sensing data, though it is less accurate than the FS-GA-DS method. Finally, the classification results confirm the advantages of multisource remote sensing data, particularly the integration of SAR and optical data, for land cover mapping. The combination approach often performed better than any single typed dataset.
6. REFERENCES
Benediktsson, J.A., Chanussot, J. and Fauvel, M., 2007. Multiple Classifier Systems in Remote Sensing: From Basics to Recent Developments: MCS 2007, LNCS 4472, Springer Verlag, Berlin 2007, pp. 501-512.
Bruzzone, L., Marconcini, M., Wegmuller, U., Wiesmann, A., 2004. An advanced system for the automatic classification of multitemporal SAR images. IEEE transaction on Geoscience and remote sensing, 42(6), pp. 1321 – 1334.
Chu, H.T., and Ge, L., 2010. Land cover classification using combination of L- and C-band SAR and optical satellite images. In: 31st Asian conference of Remote Sensing (ACRS), Hanoi, 1-5 November.
Dixon, B., and Candade, N., 2008. Multispectral land use classification using neural networks and support vector machines: one or the other, or both. International Journal of Remote Sensing, 29(4), pp. 1185–1206.
Du, P., Zhang, W., and Sun, H., 2009. Multiple Classifier Combination for Hyperspetral Remote Sensing Image Classification. MCS 2009, LNCS 5519, Springer-Verlag Berlin Heidelberg. pp.52-61.
Erasmi, S., and Twele, A., 2009. Regional land over mapping in the humid tropics using combined optical and SAR satellite data – a case study from Central Sulawesi, Indonesia. International Journal of Remote Sensing, 30(10), pp. 2465-2478.
Huang, C.L. and Wang, C.J., 2006. A GA-based feature selection and parameters optimization for support vector machines. Expert Systems with Applications, 31, 231-240.
Kavzoglu, T., and Mather, P. M., 2003. The use of backpropagating artificial neural network in land cover classification. International journal of Remote sensing, 24(23), pp. 4907-4938.
Kavzoglu, T., and Colkesen, I., 2009. A kernel functions analysis for support vector machines for land cover classification, International journal of Applied Erath Observation and Geoinformation, 11, pp: 352 – 359.
Lee, S., and Lathrop, R. G., 2006. Subpixel analysis of Landsat ETM+ using Self-Organizing Map (SOM) neural networks for urban land cover characterization. IEEE Transactions on Geoscience and Remote Sensing, 44(6), pp. 1642-1654.
Lu, D., and Weng, Q., 2007. A survey of image classification methods and techniques for improving classification performance. International Journal of Remote Sensing, 44(5), pp: 823-870.
Salah, M., Trinder, J. and Shaker, A., 2009. Evaluation of the self-organizing map classifier for building detection from lidar data and multispectral aerial images. Journal of Spatial Science, 54, pp. 15-34.
Salah, M., Trinder, J., Shaker, A., Hamed, M., and Elsagheer, A., 2010. Intergrating Multiple Classifiers with Fuzzy Majority Voting for Improveed Land cover Classifiation. In: IAPRS, Vol. XXXVIII, Part 3A – Saint-Mandé, France, September 1-3.
Sheoran, A., Haack, B., and Sawaya, S., 2009. Land cover/use classification using optial and quad polarization radar imagery. ASPRS 2009 Annual Conferencce, Baltimore, Maryland, USA, 9 – 13 March.
Soria-Ruiz, J., Fernadez-Ordonez, Y., and Woodhouse, I. H., 2010. Land-cover lassification using radar and optical images: a case study in Central Mexico. International Journal of Remote Sensing, 31(12), pp. 3291-3305.
Trinder, J. C., and Salah, M., 2010. Combining statistical and neural classifiers using Dempster-Shafer theory of evidence for improved building detection. In: Proceeding of 15th Australasian Remote Sensing & Photogrammetry Conference (15th ARSPC), Alice Springs, Australia, 13-17 September.
Tso, B., and Mather, P., 2009. Classification Methods for remotely sensed data, Second edition, CRC Press, Taylo & Francis Group.
Waske, B., and Benediktsson, J.A., 2007. Fusion of Support Vector Machines for classification of multisensor data, IEEE Transactions on Geosciences and Remote Sensing, 45(12) pp. 4842-4845.
Zhou, M., Shu, J. and Chen, Z., 2010. Classification of hyperspetral remote sensing image based on Genetic Algorithm and SVM. Remote Sensing & Modeling of Ecosystems for
ENVISAT/ASAR were kindly provided by the European Space Agency (ESA).
Landsat 5 TM Level 1T products were processed and provided by the USGS Earth Resources Observation and Science Center.