COSTLESS PLATFORM FOR HIGH RESOLUTION STEREOSCOPIC IMAGES OF A
HIGH GOTHIC FACADE
R. Héno a, L. Chandeliera, D. Schelstraetea
a Ecole Nationale des Sciences Géographiques, 6-8 avenue Blaise Pascal – Cité Descartes, Champs-sur-Marne 77455
Marne-la-Vallée cedex 2 , France, - (raphaele.heno, laure.chandelier, daniel.schelstraete)@ensg.eu
CIPA, ICOMOS and WG V/2: Advances in Digital Documentation
KEY WORDS: Architecture, Close range photogrammetry, Stereoscopic image acquisition, Platform, Teaching
ABSTRACT:
In October 2011, the PPMD specialized master's degree students (Photogrammetry, Positionning and Deformation Measurement) of the French ENSG (IGN’s School of Geomatics, the Ecole Nationale des Sciences Géographiques) were asked to come and survey the main facade of the cathedral of Amiens, which is very complex as far as size and decoration are concerned. Although it was first planned to use a lift truck for the image survey, budget considerations and taste for experimentation led the project to other perspectives: images shot from the ground level with a long focal camera will be combined to complementary images shot from what higher galleries are available on the main facade with a wide angle camera fixed on a horizontal 2.5 meter long pole. This heteroclite image survey is being processed by the PPMD master's degree students during this academic year. Among other type of products, 3D point clouds will be calculated on specific parts of the facade with both sources of images. If the proposed device and methodology to get full image coverage of the main facade happen to be fruitful, the image acquisition phase will be completed later by another team. This article focuses on the production of 3D point clouds with wide angle images on the rose of the main facade.
1. INTRODUCTION
The Amiens cathedral, considered as one of the tallest gothic cathedrals in France, was built in the 13th century in the regional capital of Picardy, 140 km north of Paris. Its nave reaches a height of 42.30 meters and its spire stands at 112 meters. Its gothic sculptures are famous for their quantity and quality, in particular, on the main west facade and in the south transept portal. It has been listed as a UNESCO World Heritage Site since 1981 and attracts huge numbers of tourists from all over the world.
1.1 The « e-cathédr@le » project
In 2010, through an initiative of the MIS laboratory (Modelling, Information & Systems) from the University of Picardy, different partners (historians, curators, architects, scientists...) decided to join forces to work on a common project called “e-cathedr@le”. The first goal of this project is to get a complete and accurate 3D model of the building. Due to the complexity of Amiens cathedral, this task is harder than it may seem, even if current technologies such as laser scanning or digital photogrammetry can be used to obtain 3D data quickly (Vosselman et al, 2010), (Pierrot-Deseilligny et al, 2011-a). The second objective of this project is to provide tools to work on the 3D dataset. The 3D model obtained is meant to gradually be integrated into the national digitalization plan of the French Ministry of Culture.
This consortium called upon the “Ecole nationale des sciences géographiques”, the IGN’s School of Geomatics, to test different techniques in order to define a strategy to produce the complete 3D model of the cathedral. In October 2010, 10 students in the Photogrammetry, Positionning and Deformation Measurement (PPMD) specialized master's degree program had a close-range photogrammetry fieldwork on this prestigious site. They carried out the 3D data acquisition of the southern arm of
the cathedral’s transept using various measurement techniques (Héno et al, 2011). They were able to provide the scientific board of the project with a consistent set of high-resolution 3D data and a variety of acquisition methods.
1.2 Presentation of the main facade
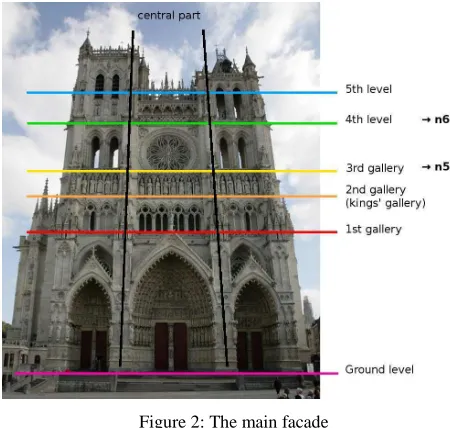
In October 2011, the new PPMD master's degree class was asked to come back to Amiens for further survey operations. The 13 students and 6 teachers worked on the main west facade of the cathedral, which is considerably more complex than the southern one, as far as size and decoration are concerned. This facade is monumental (Figure 2): the facade (48.8 meters wide) consists of three arched portals and a richly carved gallery (kings’ gallery) below the immense rose window (diameter 13 meters). The portals are famous for their complex sculptures representing holy scenes (Figure 1). On each side of the nave, two towers (68.2 and 61.7 meters high) border the facade. At five different levels, galleries can be accessed on foot, giving a complementary point of view of the facade.
This paper describes the work performed on this part of the building which required new methods as far as acquisition (part II) and processing (part III) are concerned.
The portal of the last judgment Rose window from the last level
Figure 1
Figure 2: The main facade
2. DATA ACQUISITION
2.1 Acquisition strategies
The main facade was documented in the seventies by the French IGN (Institut Géographique National), which was at that time very active in close range photogrammetry projects. At that time, the IGN team produced an elevation of the main facade at the scale of 1:10 from stereoscopic photographs arranged in vertical strips shot from a lift truck. But this solution is expensive. Other solutions were studied: UAV are relatively unreliable and imply high security measures and official authorizations; ultralight planes authorized to fly at or above 500m cannot provide such high resolution images. Besides, all the balconies and areas behind the balustrades remain hidden with these aerial solutions.
Since the facade is accessible through five galleries (figure 2), it was decided to test the combined use of ground images and images acquired with a pole.
The image survey with the pole was undertaken on the central part of the main facade. The initial objective was to photograph only the parts which were hidden in the aerial image survey and on images taken at the ground level. But a full survey was tested. Acquiring a complete set of data can best be obtained from the upper part of the facade, at the back of the structures. High resolution images are necessary to reconstitute the shape and the texture of the facade. In order not to take too many images, a fisheye camera (15 mm focal length lens) was used.
2.2 Design of the pole
The experimental pole had to provide photogrammetric images, efficiently and safely. Strips with forward and sidelap overlaps are needed for photogrammetric purposes. On each gallery, it was necessary to move forward regularly, and to vertically tilt the pole to sweep the whole facade progressively. Image overlaps were defined to make automatic tie point extraction easy.
The device for such an acquisition had to be light, easy to use, non-slip, safe, and had to pass through the narrow staircases and corridors. This pole was made in an aluminium profile of 30mm x 60mm x 33.5m, equipped with the head of a photo tripod, a
non-slip device to be put on the balustrade, and an adjustable bubble level to control the tilt. It was attached to a shoulder belt to avoid any equipment falling off. A 7 m long USB wire doubled by a shorter steel cable linked the camera to a pilot computer. The whole device’s weight was 5 kg. The computer was held up by another belt at the operator’s shoulder, leaving him free for typing. An optional articulated extension piece, with a stabilization device, was designed to access the areas between distant galleries (Figure 3b-c).
a. Standard pole
b. Pole + Extension device
c. Photo of the extension device
Figure 3: Image acquisition with the pole
2.3 Image acquisition with the pole
Because of the position of the camera, all of the settings, as well as image downloading, had to be made on a laptop computer. The 1000D Canon equipped with a 15mm lens was remotely controlled by EOS Utility software, which can be used for image framing, parameter settings, image previews, downloading and control.
The pole is equipped with a 3 axe head, which can be tilted by ± 45°. The camera can be pointed in any direction at ± 2.5 m from the support. Due to the configuration, the image resolution varies a lot within an image: it goes from less than 1 mm to 3 cm (Figure 3a-b).
2.4 Image acquisition at ground level
Stereoscopic images could be taken at ground level from the square which is 80 m in length. A 105 mm focal length camera was chosen as a compromise between a reasonable number of images and a high ground resolution (which was supposed to be less than 1 cm). Whenever possible, paper targets were glued onto the cathedral’s walls, to serve as ground control points (GCP) according to classic aerotriangulation rules (1 X,Y,Z point every stereomodel, plus 1 point at each strip’s corner). Inaccessible areas were equipped with natural ground control points, which were carefully documented, so that the topometric team could measure them precisely, as well as the photogrammetric operators afterwards. In order to get homogeneous lighting in the sun or in the shade, the only possibility was to make the image survey in the morning, that is to say with the sun behind the cathedral. Images could only be taken from dawn until roughly 10 am, because after that time there was sun and shadow cast on the facade. Six strips of roughly ten images were finally shot, sharing the same parameters (105 mm focal length focal length, aperture = 9, focus at infinity).
3. DATA PROCESSING
This part focuses on image processing on the rose.
3.1 Image georeferencing
3.1.1 105 mm focal length images georeferencing: Tie points and ground control points were manually measured during the fieldwork by the students. As a matter of fact, even if automatic tools for tie point measurements are fully operational nowadays, it is highly recommended for pedagogical reasons to make beginners start with the traditional measurement process. 410 points were measured that way, by 2 operators in 2 days. As soon as the ground coordinates of the ground control points were available, images were georeferenced with Redresseur, a user-friendly software developed and made available by Y. Egels, a photogrammetry expert. The bundle adjustment, followed by an autocalibration process, led to rather good results (average image residual around 0.4 pixels, average ground control point residual around 3 mm in X,Y,Z).
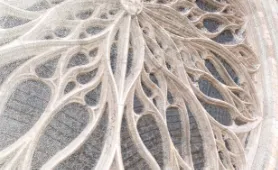
3.1.2 15 mm focal length image georeferencing on the rose: Fish eye images of the rose were meant to produce a very high resolution 3D model and orthoimage. They were taken at six different positions with the 2.5m pole from two accessible galleries (level n5 under the rose, level n6 above the rose, see Figure 4).
The Apero/MicMac tools were used for the georeferencing and the dense correlation procedures (Pierrot-Deseilligny et al, 2011-b). Key points were first generated with the traditional decimation was available. Contrary to what was expected during the field acquisition, the difference in perspective between the two closest strips of images shot from level n5 and n6 was significant. Thus, very few common tie points were extracted. The 94 images of level n6 had to be oriented independently from the 127 images of level n5. Image residual was around 0.6 pixels at that stage: tests showed that the residuals can still be reduced, if tie points are extracted on higher resolution images. This could not be done on the whole set of images, because of the very high number of points to be dealt with.
In order to use these further results in a single coordinate system, an absolute orientation of both blocks had to be carried out. No specific ground control point was measured for these images during the field operations. The idea was to determine ground coordinates by photogrammetric means from any common point between the properly georeferenced 105 mm focal length images and the 15 mm focal length images. Some of the students who were involved in the data acquisition process took the GCP manual measurement using Redresseur software. Though quite user-friendly, the Redresseur software does not include any guiding facilities to look for GCP from an approximate georeferencing solution. It was thus long and tedious to proceed to the GCP measurement, since all points were visible on dozens of images because of the high redundancy of the image survey. Besides, the Redresseur software does not provide subpixelar measurements. For organizational reasons, GCPs for the n5 level were measured and computed independently from GCPs for the n6 level, which is of course not optimized. Only 8 well spread GCPs were
chosen for both blocks, assuming that the high overlap values would insure block rigidity.
Absolute orientations performed in the Apero software gave average ground control point residuals under 1 cm in X,Y,Z for both blocks (except for 1 point around 2 cm on the n5 level, and 2 points around 2 cm on the n6 level). A final global
3.2.1 Principle: Images acquired with a 15 mm focal length lens fixed on the 2.5 m pole from different levels on the western facade were meant to fill up the holes in the images acquired with a 105 mm focal length lens from the square, in order to produce a complete orthoimage, and a complete 3D model by stereoplotting. The 15 mm focal length images were also meant to provide high resolution 3D point clouds with image-based methods, which could complete what was not seen from the ground level with the terrestrial scanner laser. MicMac software was used (Pierrot-Deseilligny et al, 2011-a). This dense correlation software was developed by the MATIS laboratory and can be used in different contexts (satellite, aerial, terrestrial imaging) by adjusting a set of parameters. According to the specifications of image surveys for dense correlation purposes, images have to look much alike to increase the rate of automatic image recognition algorithms. Thus, the B/H ratio (Base over Distance to the target scene) must be smaller than usual. It is indeed assumed that the small B/H value (sometimes around 0.1) is compensated for by the great number of images involved in the depth map computation. It is also advised to use images with stereoscopic bases in different directions, so that details parallel to the base in one set of images can be differentiated from other sets of images.
3.2.2 Description of image configuration: As it is mentioned above in this paper (paragraphs 2.2 and 2.3), these rules guided the acquisition with the pole. Since the image survey was meant to serve experimental purposes, more images than what was theoretically necessary were probably taken. In the n5 level, h4 images were meant to show the lowest part of the rose (Figure 5), which is not visible from the ground level because of the balustrade. h2 and h3 images were meant to show the middle part of the rose, up to the top of the circle. International Archives of the Photogrammetry, Remote Sensing and Spatial Information Sciences, Volume XXXIX-B5, 2012
h1 images were taken to link the n5 block to the n6 one. It was planned to cover the upper part of the rose from the higher balustrade, called the “n6” level (Figure 4).
Figure 5: h4 images in the lower level
3.2.3 Correlation strategy: First tests were carried out specifying as many images as possible to be matched to one master image, as it is usual to do in dense correlation workflows. Since the results were disappointing (many areas were not 3D reconstructed at all), further tests had to be made, with various numbers of images to work with:
⋅ Test 1 (Figure 6.a) : one master image, plus 2 images on each side of it + 5 images in the adjacent strip
⋅ Test 2 (Figure 6.b): one master image, plus 1 image on each side of it + 3 images in the adjacent strip
⋅ Test 3 (Figure 6.c): one master image, plus 1 image on each side of it
According to these tests, the best configuration to work with is the one used in the second test (6 images spread in two strips). The poor results obtained with the configuration described in test 1 probably came from the geometric configuration of the image survey: images taken with a fisheye camera very close to the facade (from 2m to 3.5m) have significant differences in perspective, not recommended for such processes. Test 3 emphasized the unreliability of image matching on details parallel to the stereoscopic base. Test 2 shows that this ambiguity disappears when using another strip of images with different viewing angles. Results varied according to the considered level: the number of images to work with was much more sensitive in the upper level (n6) than in the lower level (n5) (Figure 4). As a matter of fact, the position of the balustrade one could take the photographs from, is more awkward in the upper level than in the lower one (Figure 4b): images have a quite strong B/H ratio in n6 level (up to 0.4).
a. Test 1 in level n6 b.Test 2 in level n6 c. Test 3 in level n6
Figure 6
3.2.4 Correlation parameters: MicMac software uses a multi-resolution approach in order to limit combinatorial research: at the initial step, the whole depth interval is explored. At any next step, the area to explore comes from the previous step, with a dilatation factor in planimetry and altimetry. Besides, MicMac software uses an energetic formalism, where a function, combining a regularization term and image matching, is globally minimized.
To properly manage all these possibilities, MicMac software parameters have great potential. At each step, many parameters can be fixed: the optimization algorithm, the regularization parameters, the dilatation parameters, the subset of images, the post filtering on depth method, the size of the correlation window and the regularization resolution (Pierrot-Deseilligny et al, 2006). The best parameters for this specific image survey still need to be investigated.
3.2.5 Reconstitution geometry: MicMac software can be used to calculate the depth map in several geometries: “cartographic” geometry for instance, well adapted to classical aerial surveys, or “image” geometry, specified by a master image, with a dynamic in 1/Z. Since ground resolution within the images taken with the pole varies considerably, it is strongly advised to work in image geometry. Correlation masks for all master images have to be drawn manually (Figure 7).
image n6_b4_05 Correlation mask for n6_b4_05
Figure 7
3.2.6 Overlap management: Within a strip, overlaps were taken into account between the various correlation masks, to be sure to avoid any missing data in the final product. Between the various strips in one level (n5 or n6), there are many common parts, and only a few singular ones. As a matter of fact, the various strips were taken to compensate the hidden parts of each other’s due to the relief of the rose. A logical way of working would be to compute a depth map for all images, from a thin mask in their central part, then to merge all the results with a specific fusion tool. Such a tool could select the most reliable part of each depth map according to various criteria like the angle of incidence and the correlation coefficient (Gardon, 2009). Since it does not exist yet, the deliverable product is a raw superimposition of all 3D point clouds in Ply format, automatically derived from the depth maps.
3.2.7 Results: The resolution of the resulting depth maps is close to the ground resolution of the master images, which varies from 0.5 mm up to a few mm on the rose. Their colors come directly from the master images. Since all 3D point clouds are expressed in the same reference coordinate system, their merging is direct, though not optimal, since there is no overlap management.
Only the reliable parts of the depth maps were converted into ply format (Figure 8).
Figure 8: The green area represents the reliable part of the depth map
30 depth maps were computed with the 15 mm focal length images (Figure 9 and 10b).
Figure 9 : zoom into the 3D point clouds from 15 mm images
A 3D model was also calculated with the 105 mm focal length images (Figure 10a). The orientation values calculated with Redresseur software were converted into the MicMac format. But the ground resolution of the resulting 3D model is only 5mm. Besides, all the areas behind the balustrade are obviously hidden on that model. Finally, the color dynamic is quite poor because of the low level of lighting during the image survey (paragraph 2.4).
a. From 105mm images b. From 15 mm images
Figure 10: 3D point clouds
4. ASSESSMENT OF THE RESULTS
4.1 Internal coherence:
Looking at the correlation coefficient map is the first way to assess the correlation results. It shows the average of the correlation coefficients of all images involved in the process: white areas represent well correlated areas, while dark areas show poor correlation. The shading of a depth map also gives a good idea of how successful the matching is. The correlation coefficient map in Figure 11 shows, for instance, that all the areas hidden by the prominent gargoyle on one of the images led to poor matching. This is confirmed in the shaded relief image (Figure 11). But a shaded relief image is not enough to assess the result. It certainly emphasizes artifacts, but it does not help to objectively adjust the correlation parameters. As a matter of fact, the shaded relief image does not indicate whether or not the granular aspect of a surface really corresponds to the reality, or is a result of a subregularization.
2.
Master image Correlation map Shaded relief image
Figure 11
4.2 Comparison with terrestrial scanner laser data:
The laser data was also used to assess the image based methods. The rose was scanned from 3 stations from the ground level, at a resolution up to 5mm. The laser stations’ georeferencing was calculated using artificial targets and specific natural points (details chosen on the cathedral or from its environment) which were scanned at a very high-resolution. The final internal accuracy of laser georeferencing was around 3 mm and absolute accuracy was 5mm.
CloudCompare software (CloudCompare, 2012) was used to compare the laser point clouds with the image point clouds. Before calculating distances between laser and image point clouds, a visual examination shows first that the laser data is less dense than the image data (and yet, Ply image point clouds were subsampled at a ratio of ¼). It does not give any point behind the balustrade, and does not reconstitute the stained glass windows (almost no signal) properly. However, it gives a good reconstitution of the two trefoils on top of the rose, which were hard to see on the n6 level images because of the gargoyles.
The geometric comparison of both sets of data is rather delicate because of the imperfect georeferencing of the 15 mm focal length images (2 GCPs with a 2 cm ground residual). The results shown in Table 1 are clearly influenced by the remaining correlation artifacts, which were not filtered out during the Ply conversion. After a finer definition of the 3D point envelop, the maximum distance between laser and image data remained under 10 cm.
n5_h3_05 n5_h2_11 n6_b4_05 n6_b4_12 Mean
distance
5mm 4mm 2mm 9mm
Maximum distance
57cm 36cm 9cm 30cm
Sigma 2cm 2cm 1cm 3cm
Table 1: Distance between the laser data and various image 3D point clouds
4.3 Weaknesses of the image survey
Despite very careful preparation and rigorous implementation, the image survey is not perfect. At first, there is a lack of stereoscopy at the edge of the rose in the upper level images. Then, two points of view should have been added in the upper level image survey, to have a front view of the top of the rose: as a matter of fact, existing images mainly cover the balustrade, while the upper part of the rose is only seen on vanishing points of view. Its reconstitution is not as good as it could have been, if a lower point of view had been taken, with the extension device for instance (Figure 3b).
Besides, images taken from above the balustrade show the prominent gargoyles, which hide much of the interesting part of the rose. Finally, these supplementary strips would have probably made the SIFT extraction possible in-between both levels, which would have improved the whole block adjustment.
5. PERSPECTIVES
5.1 Optimization of the image survey
This image survey has a very high rate of redundancy. In future, compromises between the number of images and the percentage International Archives of the Photogrammetry, Remote Sensing and Spatial Information Sciences, Volume XXXIX-B5, 2012
of remaining hidden parts should be made to be more realistic. A trainee is due to work on the main facade data set to derive some recommendations for further acquisitions.
5.1.1 Motorized pole: The pole image survey has proved to be quite effective: on the one hand, it covers more areas than a ground level or an aerial survey; on the other hand, it is practical and economical. The prototype was quite good though rustic, but it did not allow the remote camera to change directions at a given position of the pole, nor to modify pole length. With a motorized head, it would have been possible to sweep the facade, to keep the parallelism of the axes, while redirecting the pole to gain access to hidden recesses. A motorized telescopic pole could also have been used a) to further distance the camera from the facade (more than 2.5m), b) to preserve the same distance to the facade during changes of direction to the pole, and c) to move more easily in the narrow parts of the cathedral.
5.2 Extension to the whole facade and other cathedrals
Because of the completed image processing on the rose, recommendations can be made to deal with the remaining parts:
⋅ Tie points must be extracted on all images at the same time.
⋅ GCPs must be defined globally.
⋅ Correlation masks must be defined globally, on relevant images only.
⋅ Relevant MicMac parameters must be further studied on image samples.
If another building of that kind had to be surveyed with the same procedure, data acquisition protocol could be slightly optimized, while image processing would benefit from new software development.
5.3 Consequences on software
Existing software needs to be upgraded to facilitate this kind of project:
⋅ Apero software must include tie point decimation. As a matter of fact, the only way to work with the current version is to ask SIFT to work on subsampled images, so that the number of extracted tie points remains reasonable. The best would be to make this extraction on full resolution images, then to filter them out.
⋅ Apero software should make bundle adjustment assessment easier.
⋅ Finally, a specific tool to measure ground control points would increase overall productivity. The idea is to guide the operator to all images at the approximate position of the point, given by a first bundle adjustment based on the tie points plus at least three ground control points. The measurement would be assisted by image correlation at a subpixel level. ENSG students are currently working on these improvements.
⋅ There could be a tool, other than MicMac software, to deal with contiguous correlation masks.
⋅ The rigorous fusion of overlapping depth maps needs to be carried out.
6. CONCLUSION
This first experience on the rose ends with an almost complete set of very high resolution color 3D point clouds. The lower
part of the rose is particularly well described, whereas it is fully hidden by the balustrade from the ground level. A trainee is about to start working with the remaining 15 mm focal length images of the main facade, with the experience gained during this first stage of operations carried out on the rose. He will also define better correlation parameters, and provide recommendations on the number of images which are really needed for such a monument. The next test on this facade is planned to be a UAV image survey. It will also provide high resolution images, but a bit further from the facade, which should facilitate data processing. Image data combined from the three complementary sources, at ground level, with the pole from the galleries and by UAV drone, will more reliably determine the choice of the most adapted survey method in view of the complexity of the target scene.
7. REFERENCES
7.1 References
Gardon, E., 2009. Fusion de cartes de profondeurs en photogrammetrie architecturale, in Rapport de TFE, Mastère Spécialisé Photogrammétrie, Positionnement et Mesure de Déformations.
Héno, R., Chandelier, L., Clauzel, F., Hanon, R., 2011. Complementary of terrestrial laser scanning and DSM from aerial of terrestrial photography : the example of the cathedrale of Amiens, in proceedings of the XXIII CIPA symposium, Prague, Czech Republic.
Pierrot-Deseilligny, M., Paparoditis, N., 2006. A multiresolution and optimization-based image matching approach: an application to surface reconstruction from spot5-hrs stereo imagery, in IAPRS vol XXXVI-1/W41 in ISPRS Workshop On Topographic Mapping From Space (With Special Emphasis on Small Satellites), Ankara, Turquie.
Pierrot-Deseilligny, M., De Luca, L., Remondino, F., 2011-a. Automated image-based procedures for accurate artifacts 3D modeling and orthoimage generation, in proceedings of the XXIII CIPA symposium, Prague, Czech Republic.
Pierrot-Deseilligny, M., Cléry, I., 2011-b. APERO, an Open Source Bundle Adjusment Software for Automatic Calibration and Orientation of a Set of Images. Proceedings of the ISPRS Commission V Symposium, Image Engineering and Vision Metrology, Trento, Italy, 2-4 March 2011.
Vosselman, G., Maas, H-G (Eds)., 2010. Airborne and terrestrial laser scanning, Boca Raton CRC, 318 pp.
7.2 Websites
CloudCompare, 2012: 3D point cloud and mesh processing software http://www.danielgm.net/cc/