Information and inner city educational attainment
Jens Ludwig
*Georgetown University and Northwestern University/University of Chicago Joint Center for Poverty Research, 3600 N Street, NW, Washington DC 20007, USA
Received 2 January 1996; accepted 19 August 1997
Abstract
Data from the National Longitudinal Survey of Youth (NLSY) are analyzed to examine whether adolescents living in low-income urban areas have less accurate information about labor market institutions than teens in more affluent communities, and whether information influences educational attainment. All adolescents seem to implicitly underesti-mate the educational requirements of their occupational goals, and teens (particularly males) in high-poverty urban areas have less accurate information than those in other neighborhoods. Information varies across neighborhoods in part because of the effects of family socioeconomic status on information, including the education and employment experiences of parents. The labor market information measures available with the NLSY are related to schooling persistence, even after controlling for AFQT scores and family background. [JEL I20, J24, D83] 1998 Elsevier Science Ltd. All rights reserved.
Keywords: Education attainment; Urban poverty; Neighbourhood effects
1. Introduction
“...Right now, [inner city] youngsters, particularly those in high school, don’t see the relationship between school and post-school employment. So it’s hard to get them to study. Some of the obstacles they have to overcome, such as lack of information, is overwhelming.”
William Julius Wilson (p. 77 in Herbert, 1994)
“[T]he educational scene is unreal because people who we think could benefit are rejecting what is sup-posed to be good for them.”
Aaron Wildavsky (1990)
While highschool completion rates have improved dramatically over the past half-century in the United
* Email: [email protected]
0272-7757/98/$ - see front matter1998 Elsevier Science Ltd. All rights reserved. PII: S 0 2 7 2 - 7 7 5 7 ( 9 7 ) 0 0 0 5 4 - X
States, dropout rates in many low-income urban areas continue to approach 50 or even 60 percent (Rumberger, 1987; Wilson, 1987). For some, these graduation rates have become a foregone conclusion: Illinois State Senate President James Philip, commenting on the 1993 public school closings in Chicago, wonders “What’s so important about having Chicago schools open on a spe-cific date? ... Half the kids aren’t going to graduate any-way.”1 For others, urban dropout rates are a source of
puzzlement and concern, in light of the increasing returns to schooling and cognitive skills (Murnane and Levy, 1993; Murnane et al., 1995) and changes in the skill requirements of urban employment opportunities (Kasarda, 1985; Kain, 1992).
While socioeconomic background has been viewed as the primary determinant of educational achievement since the so-called Coleman Report (Coleman, 1966), significant variation in schooling outcomes remains even after accounting for differences in family characteristics and measurable school inputs (Datcher-Loury, 1989 and
18 J. Ludwig / Economics of Education Review 18 (1999) 17–30
Hanushek, 1986). In his influential work The Truly
Dis-advantaged (1987), William Julius Wilson offered an
additional explanation for dropout decisions made by youth in urban poverty areas: Increases in the social iso-lation of urban communities since the 1960s has made it difficult for teens to “see the connection between edu-cation and meaningful employment.” Yet to date there has been little empirical examination of Wilson’s hypothesis.
This paper uses data from the National Longitudinal Survey of Youth (NLSY) to explore the notion that dro-pout rates in urban poverty areas are driven in part by imperfect information about the labor market. One way to test Wilson’s hypothesis would be to relate variation in teens’ expected returns to schooling to variation in neighborhood poverty concentrations. Unfortunately, data on earnings expectations are currently not available for samples of low-income urban youth. The approach taken in this paper is to make use of several labor market information measures available with the NLSY to build on the link suggested by Rosen (1994): “improved spe-cific and general information about the job market reduces probable divergence between anticipated and actual returns [to education].”
The first contribution of the paper is to provide some evidence suggesting that teens in urban poverty areas have less information about the labor market than other adolescents. This appears to be particularly true for males. I then explore the relationship of labor market information with socioeconomic status and residence within an urban poverty area. Teens from more affluent families have more accurate labor market information, in part because their parents are more likely to have better information and because information resources are more readily available within the home. Using two-stage least squares methods which address the possible endogeneity of neighborhood poverty concentration, I find some evi-dence to suggest that neighborhoods have independent effects on labor market information.
Finally, I examine the relationship between labor mar-ket information and educational outcomes. This analysis is complicated by the possibility that the NLSY infor-mation measures may proxy for other student and family factors in the education-outcome regressions. I find evi-dence to suggest that the labor market information meas-ures used here are positively correlated with high school graduation and educational attainment, even after con-trolling for student aptitude (measured by the Armed Forces Qualifying Test, or AFQT), family background, school quality, and neighborhood and metropolitan-area characteristics. I find that the effects of information on educational persistence are as large within AFQT strata and urban poverty areas as with the full sample, which suggests that the information measures serve as more than just proxies for ability or poverty. Further, specifi-cation tests are unable to reject the null hypothesis that
the information measures are uncorrelated with the dis-turbance term in educational outcome equations.
The following section reviews the information hypoth-esis within the traditional human capital framework. The third section discusses the NLSY data used in the empiri-cal analysis, and the fourth section of the paper uses the NLSY to test for information differences between teens in urban poverty versus other areas. The fifth section examines the roles of family and neighborhood effects on information, while the sixth section explores the effects of labor market information on educational out-comes. The seventh section discusses the implications and limits of the results.
2. Urban poverty and information
In the standard human capital model, schooling decisions are viewed within the framework of traditional investment theory. Individuals choose their optimal edu-cational attainment by means of a marginal benefit–cost calculus, comparing the benefits derived from additional schooling to the costs incurred (Becker, 1964). Yet in practice, empirical research on human capital investment typically estimates reduced-form equations for the effects of individual, family and school characteristics on educational outcomes, with little attempt to distinguish between influences on the benefits versus costs to school-ing (exceptions include Haveman et al., 1994).
Ogbu, 1978’s ethnographic analysis pays explicit attention to the benefit side of the equation, and claims that black–white differences in educational attainment are due in part to differences in the returns to schooling. Ogbu suggests that a job ceiling reduces the rate of return to schooling for African-Americans, hence dimin-ishing the incentives for educational persistence. Some evidence to the contrary comes from Smith and Welch (1989), who find that the returns to an additional year of schooling were nearly equivalent for blacks and whites entering into the labor market in 1980.
to schooling diverge (even on average) from the true returns.2
Unfortunately, very little is known about how teens gather information and form expectations about the returns to schooling. Manski (1993) suggests that ado-lescents may form expectations of the benefits to school-ing by observschool-ing the labor market experiences of adult “role models,” in which case subjective and true expected returns may diverge because of differences in information (role model “data”) or differences in the way in which available information is processed. Streufert (1991) links this theory of expectations formation to Wil-son’s hypothesis by demonstrating the effects on teenag-ers’ expected returns to schooling from a lack of role models above some earnings threshold. The result is that adolescents in low-income urban areas will underesti-mate both the rate of return and the opportunity costs to schooling, though Streufert’s simulations suggest that on average the net effect will be to depress educational attainment.
The empirical work in this area is quite limited. Empirical evidence that college recruiters consistently underestimate the prevailing market wage, despite repeated interactions with this market, casts doubt on the idea that teenagers form accurate expectations (Leonard, 1982).3As Manski (1993) notes, while sociologists and
psychologists have devoted attention to teen expec-tations, their work typically relies on responses to “loosely worded” survey questions. A handful of studies by economists have surveyed student earnings expec-tations and compared these figures with estimates from earnings data. For example, Dominitz and Manski (1996) find that high school and college students in Wisconsin correctly perceive a positive return to schooling, though there is considerable variation among the expected returns. Betts (1996)’s survey of undergraduates finds some evidence to suggest that parent income is positively correlated with students’ expectations of the earnings of college graduates.4 None of these studies survey
non-college-bound adolescents from low-income urban areas and, to the best of my knowledge, such expectations data are not available.
The empirical analysis presented below exploits the labor market information measures available with the NLSY to examine the accuracy of information held by adolescents living in different neighborhoods, as well as the effects of information on schooling decisions. As
2See Holden et al. (1985) and Manski (1993) for more on
economic models of expectations.
3Sah (1991) and Viscusi (1990) note that individual
esti-mates of the risks involved in criminal activity and smoking are biased, even on average.
4Other examples include Freeman (1971) and Smith and
Powell (1990).
Rosen (1994) notes: “The probability of error in assessing alternatives [in educational decision-making] is obviously related to the quality of information about both [benefit and cost] components.” The benefits to human capital accumulation come in the form of increased wages, more pleasant working conditions and other forms of non-wage compensation, different career tra-jectories, and so on. Information about labor market institutions is required for a student to estimate the bene-fits bestowed on workers with additional educational cre-dentials.
The NLSY data discussed in the next section are used to estimate the following equations:
s5b01b1k1b2u1b3Xs1es, (1)
k5g01 g2u 1g3Xk1ek, (2)
u5a01 1a3Xu1eu, (3)
where s is a measure of the respondent’s educational attainment, k is a measure of the quality or quantity of the respondent’s labor market information, u indicates whether the respondent lives within a low-income urban area, and Xk, Xs, and Xuare each matrices of student,
family, school and metropolitan-area variables. Urban poverty residence is included in Eq. (1) to allow for neighborhood effects on educational outcomes through mechanisms other than influences on labor market infor-mation. I also explore the possibility that residence within an urban poverty area is endogenous in Eqs. (1) and (2), which may lead to bias in a direction that is difficult to predict (Evans et al., 1992 and Brooks-Gunn et al., 1993), and that labor market information is endogenous in Eq. (1). I produce alternative estimates for the effects of u and k in Eqs. (1) and (2) using two-stage least squares, and test for endogeneity using the method presented in Hausman (1978).
3. The data
The National Longitudinal Survey of Youth (NLSY) provides comprehensive individual, family, school and metropolitan-area characteristics for survey participants. The original 1979 base-year questionnaire surveyed 12 686 youths aged 14 to 21 from a variety of family and community backgrounds, with intentional oversam-pling of minorities and low-income youths. Follow-up interviews were conducted for NLSY respondents over the period from 1980 to 1991.
20 J. Ludwig / Economics of Education Review 18 (1999) 17–30
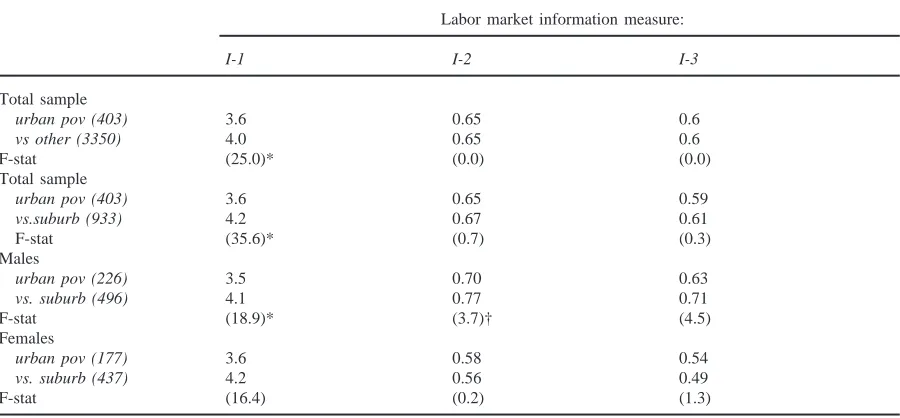
Table 1
Weighted means from the National Longitudinal Survey of Youth (NLSY). Respondents enrolled in school, grades 11 or below in 1979
Total (n53,753) Urban Poverty Non-Hispanic Hispanic (n5 Blacks (n5 Residents*(n5 Whites (n5 612) 1,108)
403) 2,033)
Hispanic 6.4 19.1 N/A N/A N/A
Black 16.3 64.8 N/A N/A N/A
Male 53.1 54.2 53.5 49.8 52.4
Family income 18 836 (10 446) 10 569 (7304) 21 897 (11 085) 12 975 (8470) 11 040 (8636)
Father not in household 10.9 20.0 7.5 15.8 25.2
AFQT Score 40.9 (25.2) 21.1 (18.1) 46.8 (26.1) 25.6 (20.1) 19.3 (16.7)
Residence in 1979 within urban 6.2 N/A 1.3 18.6 24.7
ZIP code area w/ 1980 pov rate > 30%
Household ever received welfare 10.1 31.5 4.9 25.9 28.8
Highest grade completed by 1991 13.0 (2.2) 12.2 (1.9) 13.2 (2.4) 12.1 (2.2) 12.5 (1.9)
High school graduate by 1991 87.1 75.3 88.9 74.1 83.7
R had ever worked for pay (1979 43.6 30.7 47.1 36.4 30.0
survey)
R’s educational aspiration 14.3 (2.4) 14.3 (2.5) 14.4 (2.4) 14.0(2.4) 14.3 (2.3) R’s educational expectation 13.8 (2.4) 13.6 (2.6) 13.9 (2.4) 13.3(2.5) 13.7(2.3)
I-15total correct occupational 4.3 (1.7) 3.6 (1.6) 4.5 (1.6) 3.5(1.5) 3.5(1.6) questions
R’s educational aspiration minus 21.6 (2.4) 21.7 (2.7) 21.5 (2.2) 21.7 (2.4) 21.6 (2.6) the avg educ level of R’s aspired
occup group
R’s educational expectation 22.1 (2.4) 22.4 (2.7) 22.0 (2.3) 22.4 (2.4) 22.2 (2.6) minus the avg educ level of R’s
aspired occup group
I-251 if [R’s educ aspir]-[avg 65.1 64.8 65.4 64.6 66.6
educ level for R’s aspired occup group],2 sd of occup group educ.
I-351 if [R’s expected educ]- 60.2 59.3 60.3 56.4 60.8
[avg educ level for R’s aspired occup group],2 sd of occup group educ
*Urban poverty areas defined as urban ZIP codes with 1980 poverty rates of at least 30 percent.
dropout; and (2) the information available to full-time students in making their school persistence decisions. I also experiment with restricting the sample to those ages 15 or younger in 1979, because while a small proportion of youths may have left school by the age of 16, almost everyone is still enrolled at 15 (Cameron and Heck-man, 1997).
The NLSY provides data on the AFQT scores and family characteristics of respondents in 1979, each respondent’s educational attainment by 1991, and school characteristics such as student–teacher ratios, the number of guidance counselors per student, and the number of books in a school’s library. By matching the occupation codes reported for parents’ occupations to data from the March Supplement to the 1980 CPS, I create additional variables which measure the proportion of white collar workers in the parents’ industry of employment, which
may also be related to the amount of labor market infor-mation that parents transmit to children.
3.1. Labor market information measures
The “specific and general information about the job market” which Rosen (1994) believes to be relevant for inferring the returns to schooling includes “knowledge of work environments and the nature of different types of occupations,” along with the incomes associated with different occupations. The NLSY offers two opport-unities to measure such information.
econ-omist. A simple summary statistic for the total number of correct answers to seven of these nine NLSY occu-pational description questions will be used in the sub-sequent analysis (for convenience, I-1).5
Additional variables measuring labor market infor-mation were generated by comparing the average edu-cation levels in respondents’ reported occupational aspir-ations with respondents’ reported educational aspiraspir-ations and expectations. The NLSY asked respondents to state the occupations to which they aspired at the age of 35, reported as 3-Digit Occupational Codes taken from the 1970 Census. These 3-digit codes were then mapped into 16 occupational groups, and the March 1980 CPS was used to estimate the education levels (means and stan-dard deviations) for workers under the age of 35 in each of these groups.6The CPS-estimated occupational
aver-ages were then subtracted from the educational aspir-ations and expectaspir-ations of surveyed adolescents. It is interesting to note that most adolescents (implicitly) underestimate the educational requirements of their occupational aspiration. As seen in Table 1, on average their educational aspirations are 1.6 years below the average for their desired occupation (with 81 percent of respondents underestimating the educational requirement), and their expected educations are 2.1 years below the desired occupation’s average (86 percent underestimates).
To control for variation across occupations in the stringency of educational requirements, the information measures are coded as binary variables equal to 1 if the respondent’s educational aspiration/expectation was less than two standard deviations from the mean education level in the aspired occupational group, 0 otherwise
(I-2 and I-3, respectively7). Roughly two-thirds of
respon-5The nine occupations included in the survey were: hospital
orderly, department store buyer, fork lift operator, medical illus-trator, dietician, economist, assembler, keypunch operator, and machinist. For example, respondents were asked to select the correct description of job duties for dietician from the three choices: (a) waits tables, (b) suggests exercises, (c) plans menus. The questions relating to keypunch operator and machinist were excluded from the analysis because of possible ambiguities in the offered choices of job descriptions.
6I also experiment with using education levels for all
work-ers within these categories and produced similar results to those shown here (Ludwig, 1994). I focus on education levels for those under 35 because educational requirements may change over time, and the requirements that NLSY respondents will face are likely to be most accurately reflected by recent labor market entrants.
7That is, the means and standard deviations for the
edu-cational attainments of under-35 workers in each occupational group were estimated using the CPS, with binary variables indi-cating whether I-2 and I-3 were less than 2 CPS-estimated stan-dard deviations from the CPS-estimated occupational group average.
dents have educational expectations or aspirations within the relevant interval for the aspired occupational group (Table 1).8
As part of the pre-testing in 1966 for the original NLS, 5,000 males ages 14 to 24 were asked to describe the educational attainments of male workers in several dif-ferent occupations, similar in spirit to measures I-2 and
I-3 used in this paper. Kohen and Breinich (1975) find
that these NLS items “exhibit desirable characteristics in terms of internal consistency reliability, discriminatory power, and level of difficulty,” and suggest the NLS measures compare favorably to commercially-available assessments of labor market information used in vocational guidance. That is, to the extent to which labor market information may be measured, the NLS and NLSY items fare as well as other available instruments. Parnes and Kohen (1975) find that the 1966 NLS pre-test information items are statistically significant predic-tors for the hourly wages and occupational status of males in 1968, even after controlling for IQ scores, edu-cational attainment, parent’s SES, characteristics of the respondent’s school, physical health, and region of resi-dence. Parnes and Kohen take this as evidence that the NLS variables are correlated with labor market infor-mation, which is in turn expected to facilitate job search. An alternative interpretation is that the NLS information measures simply proxy for ability.
Some evidence for the Parnes and Kohen interpret-ation comes from Murnane et al., 1995’s finding that test scores in reading were uncorrelated with male hourly wages in the NLS72 and High School and Beyond once controls were made for math scores. IQ scores are strongly correlated with AFQT scores, which are in turn correlated with arithmetic reasoning and mathematics knowledge (Herrnstein and Murray, 1994). Taken together, these findings do not support the idea that the NLS information variables influence earnings by proxy-ing for verbal or math abilities in the Parnes and Kohen earnings equations, especially since the information vari-ables seem more likely to reflect verbal rather than math skills.
3.2. Identifying urban poverty areas
NLSY respondents are classified as living within an urban poverty area at the time of the base year
question-8I also experimented with a smaller interval (one standard
22 J. Ludwig / Economics of Education Review 18 (1999) 17–30
naire if the respondent’s ZIP Code area of residence was in an urban area and had a 1980 poverty rate of at least 30 percent. While ZIP Code areas are somewhat larger than Census tracts and are likely to have greater internal diversity,9the use of both ZIP Code areas and the
parti-cular poverty rate threshold were determined by data availability and restrictions on data use.10Examination
of cities such as Chicago and New York suggests that this method identifies what are commonly thought of as high-poverty urban areas. The sample-weighted pro-portions of whites and blacks in the NLSY who live in urban poverty ZIP code areas (1.3 and 24.7 percent, respectively) are very close to the proportions of whites and blacks living in Census tracts with poverty rates over 30 percent (1.6 and 25.8 percent) (Gramlich et al., 1992). In order to reduce the frequency with which I mistakenly classify those in urban poverty areas as living in non-poor neighborhoods, I focus on comparisons between those living in urban poverty ZIP code areas versus those least likely to live in high-poverty areas—teens in sub-urban (MSA, not central city) areas (Jargowsky and Bane, 1990).
4. Information in low-income urban areas
The results presented in this section suggest that infor-mation about the labor market is not uniformly distrib-uted across adolescents: Those teens who live in urban poverty areas appear to have less accurate information than those in more affluent areas.
The first row of Table 2 presents the results of a sim-ple analysis-of-variance procedure comparing the aver-age labor market information of youths in urban poverty ZIP Codes with all other respondents in our sample. Teens in urban poverty ZIP codes report fewer correct answers for the NLSY occupational questions (3.6 versus 4.0, F525.0), a difference equal to about one-quarter of a standard deviation for this variable, though there are no significant differences for the other information measures. I then refine this analysis by comparing teens
9Census tracts typically contain between 2000 and 8000
people and, in urban areas, roughly encompass between 4 and 5 city blocks (Jargowsky and Bane, 1991). ZIP Code areas, on the other hand, typically contain between 10 and 20 Census tracts. As noted by Jencks and Mayer (1990), “ZIP Code areas are likely to be somewhat larger than a traditional neighbor-hood... [and] are likely to be more socially diverse than Census Tracts or blocks.”
10Unfortunately, data restrictions implemented by the Bureau
of Labor Statistics led to concerns that the sample group ident-ified by a 40 percent cutoff would be too small for useful analy-sis. BLS required that any NLSY respondents from MSA’s that included only one ZIP Code area that was above (or below) the specified poverty threshold be excluded from the sample.
in urban poverty ZIP codes with those in suburban areas. As seen in Row 2 of Table 2, teens in urban poverty areas have less information than suburban teens along each of our three information measures, though only one of the three differences is statistically significant.
These comparisons mask important differences by gender, as shown in the third and fourth rows of Table 2: Males in urban poverty areas have significantly less information than suburban males along each of the infor-mation measures, while only the occupational-question measure is significantly different for females. That infor-mation differences are largest for males seems consistent with Wilson (1987)’s focus on changes in the employed male population in central cities. When I restrict the sam-ple to those 15 and younger in 1979, I produce qualitat-ively similar results.
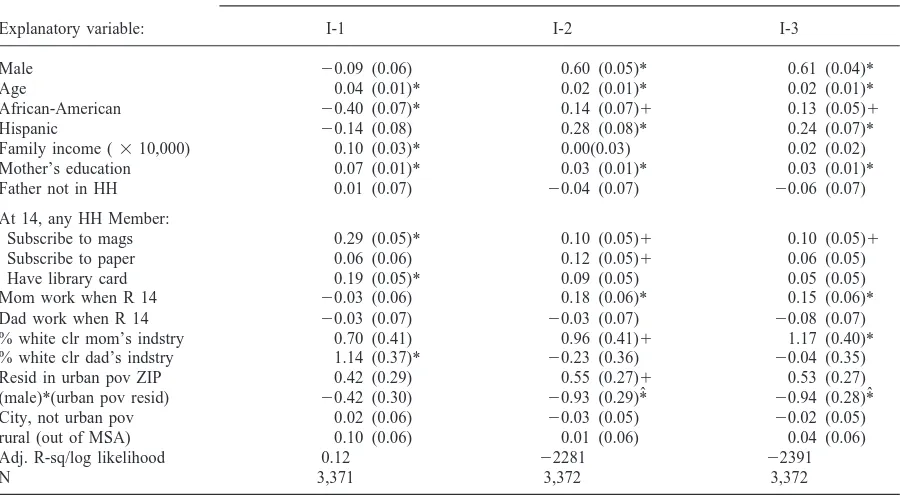
5. Family and neighborhood effects on information
This section examines the role of family and neighbor-hood factors in explaining the information differences between urban poverty and suburban teens. Teens from low-income families may have less information than others because poor families are less able to provide information about labor market institutions to children, or because poor families are more likely to live in soci-ally-isolated central-city neighborhoods. I find some evi-dence to suggest that labor market information is a pro-duct of both family and neighborhood factors.
Table 2
ANOVA labor market information comparisons
Labor market information measure:
I-1 I-2 I-3
Total sample
urban pov (403) 3.6 0.65 0.6
vs other (3350) 4.0 0.65 0.6
F-stat (25.0)* (0.0) (0.0)
Total sample
urban pov (403) 3.6 0.65 0.59
vs.suburb (933) 4.2 0.67 0.61
F-stat (35.6)* (0.7) (0.3)
Males
urban pov (226) 3.5 0.70 0.63
vs. suburb (496) 4.1 0.77 0.71
F-stat (18.9)* (3.7)† (4.5)
Females
urban pov (177) 3.6 0.58 0.54
vs. suburb (437) 4.2 0.56 0.49
F-stat (16.4) (0.2) (1.3)
Notes:*Difference statistically significant at 5% level. †Difference statistically significant at 10% level. Variable definitions: I-1:
Total number of correct answers to the NLSY Occupational Duty Questions. I-2:51 if [R’s educational aspiration]2[CPS-estimated average education of workers under 35 years of age in R’s aspired occupational group] less than 2 standard deviations, estimated using the CPS for the R’s aspired occupational group. I-3:51 if [R’s expected educational attainment]2[CPS-estimated average education of workers under 35 years of age in R’s aspired occupational group] less than 2 standard deviations, estimated using the CPS for the R’s aspired occupational group.
respondent was 14. I find some evidence to suggest that the employment experiences of parents matter for the labor market information of teens. Mother’s employment status, and the mother’s exposure to white collar occu-pations while at work, are significantly related to infor-mation measures I-2 and I-3, and the white collar exposure variable is significant for measure I-1 at p#
0.10. Teens in more affluent families appear to have more labor market information in part because affluent parents may have more information themselves, and may be more likely to keep sources of information such as magazines or newspapers within the home.11
Model (3) examines whether there is statistically sig-nificant variation in information across neighborhoods after controlling for family background characteristics. I include dummy variables indicating residence within an urban poverty area, central city (not urban poverty), and rural area, with suburban teens the comparison group. I also include an interaction term between the teen’s gen-der and residence within an urban poverty area. The net
11We also include measures of publicly-provided
infor-mation resources in these equations such as the number of guid-ance counselors per student, and the number of books in the school’s library (results not shown). The number of books in a school’s library has a positive and statistically significant corre-lation with I-2 (p,0.05) and I-3 (p,0.10).
effect of urban poverty residence on information meas-ures I-2 and I-3 are negative for males, though only stat-istically significant for I-3.12
However, urban poverty residence may be associated with unobserved family variables that also influence a teen’s information (Evans et al., 1992); for example, par-ents with more labor market information may be more likely to move to suburban areas to take advantage of changing employment patterns. To address the possi-bility of endogeneity of the urban poverty variable, Model (3) is re-estimated with the predicted probability of urban poverty residence substituted for the actual urban poverty variable. The coefficients for the urban poverty neighborhood variable in the two-stage estimates are identified by the nonlinearity of the probit estimator used to calculate the predicted probability of living in an urban poverty area; I also use as instruments the MSA’s 1979 unemployment rate and proportion of households with a female head as measures of a family’s neighbor-hood choice set within a given MSA (Evans et al., 1992).
12In Model (3) shown in Table 3, the likelihood ratio test
24
J.
Ludwig
/Economics
of
Education
Review
18
(1999)
17–30
Table 3
OLS/probit results for the determinants of labor market information
Labour market information measure used as dependent variable:
Explanatory variable: I-1 I-2 I-3
(1) (2) (3) (1) (2) (3) (1) (2) (3)
Male 20.14 (0.05)* 20.13 (0.05)* 20.13 (0.05)* 0.48 (0.04)* 0.50 (0.04)* 0.52 (0.05)* 0.50 (0.04)* 0.51 (0.04)* 0.55 (0.05)*
Age 0.04 (0.01)* 0.04 (0.01)* 0.04 (0.01)* 0.02 (0.01)* 0.02 (0.01)* 0.02 (0.01)* 0.02 (0.01)* 0.02 (0.01)* 0.02 (0.01)*
African-American 20.47 (0.06)* 20.37 (0.06)* 20.38 0.06)* 0.11 (0.05)1 0.14 (0.05)* 0.15 (0.06)* 0.11 (0.05)1 0.13 (0.05)* 0.14 (0.06)1
Hispanic 20.19 (0.07)* 20.13 (0.07) 20.13 (0.07) 0.25 (0.07)* 0.27 (0.07)* 0.29 (0.07)* 0.21 (0.07)* 0.22 (0.07)* 0.24 (0.07)*
Family income (310,000) 0.14 (0.02)* 0.09 (0.03)* 0.10 (0.03)* 0.03 (0.02) 20.02 (0.02) 20.03 (0.03) 0.04 (0.02) 0.02 (0.02) 0.02 (0.02)
Mother’s education 0.09 (0.01)* 0.07 (0.01)* 0.07 (0.01)* 0.05 (0.01)* 0.03 (0.01)* 0.03 (0.01)* 0.05 (0.01)* 0.03 (0.01)* 0.03 (0.01)*
Father not in HH 0.02 (0.07) 0.00 (0.07) 0.01 (0.07) 20.01 (0.06) 20.04 (0.07) 20.04 (0.07) 20.02 (0.06) 20.06 (0.07) 20.06 (0.07)
At 14, any HH Member:
Subscribe to mags 0.29 (0.05)* 0.29 (0.05)* 0.10 (0.05)1 0.10 (0.05)1 0.10 (0.05)1 0.10 (0.05)1
Subscribe to paper 0.06 (0.06) 0.06 (0.06) 0.12 (0.05)1 0.12 (0.05)* 0.05 (0.05) 0.06 (0.05)
Have library card 0.19 (0.05)* 0.20 (0.05)* 0.08 (0.05) 0.09 (0.05) 0.05 (0.05) 0.05 (0.05)
Mom work when R 14 20.04 (0.06) 20.04 (0.06) 0.17 (0.06)* 0.17 (0.06)* 0.15 (0.06)1 0.15 (0.06)1
Dad work when R 14 20.03 (0.07) 20.03 (0.07) 20.03 (0.07) 20.04 (0.07) 20.08 (0.07) 20.08 (0.07)
% white clr mom’s indstry 0.72 (0.41) 0.72 (0.41) 0.98 (0.41)* 0.97 (0.41)1 1.17 (0.40)* 1.16 (0.40)*
% white clr dad’s indstry 1.08 (0.37)* 1.14 (0.37)* 20.27 (0.36) 20.25 (0.36) 20.04 (0.35) 20.01 (0.35)
Resid in urban pov ZIP 0.12 (0.12) 0.07 (0.11) 0.18 (0.11)
(male)*(urban pov resid) 20.06 (0.15) 20.20 (0.14) 20.33 (0.14)1
City, not urban pov 0.03 (0.06) 20.03 (0.05) 20.01 (0.05)
rural (out of MSA) 0.11 (0.06) 0.00 (0.06) 0.04 (0.06)
Adj. R-sq/log likelihood 0.11 0.12 0.12 22311 22287 22286 22415 22397 22394
N 3,731 3,731 3,731 3,732 3,732 3,372 3,732 3,372 3,372
NOTE: Standard errors given in parentheses: *5statistically significant at 1% level.1 5significant at 5% level. Also included in model: constant term, number books in R’s school library, and guidance counselors per pupil.ˆ 5Likelihood ratio test (or F-test) indicates sum of coefficients for urban poverty residence and urban poverty residence-male interaction variables significantly different from zero at 5% level. Variable Definitions: I-1: Total Number of Correct Answers to the NLSY Occupational Duty Questions. I-2:5
Newey’s (1985) generalized method of moments (GMM) test does not reject the null hypothesis that these instru-ments are exogenous in the information equations.13
The results are shown in Table 4, and suggest that for males, urban poverty residence has a negative and statistically significant effect on labor market infor-mation as measured by I-2 and I-3. When I restrict the sample to those under 16 in 1979, I produce findings that are qualitatively similar to the results shown in Tables 3 and 4.
6. Information and educational attainment
In this section, I examine the relationship between the NLSY information measures and education outcomes, measured by high school graduation and years of school completed by 1991.14 High school graduation may be
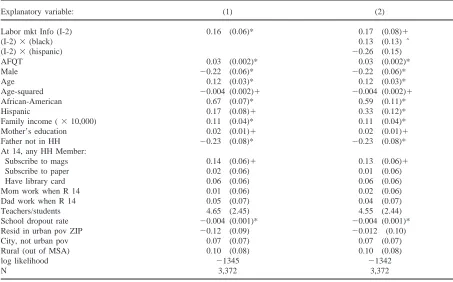
a more appropriate outcome measure than educational attainment because borrowing constraints may play an important role in preventing low-income teens from going on to post-secondary school (Cameron and Heck-man, 1997). Further, the educational attainment variable may be somewhat truncated since roughly 5 percent of the sample used here is still in school in 1991, though the graduation variable should be unaffected since “there is virtually no high school graduation after age 20” (Cameron and Heckman, 1997). Analysis of the NLSY suggests that more accurate information about the job market leads to more schooling.15
Table 5 presents illustrative probit regression results for the high school completion equation, using I-2 to measure labor market information. An important concern is that the information measures serve as a proxy for student ability. One way to address this concern is by including AFQT scores in the regression equation, in addition to controlling for family, school and metropoli-tan area characteristics. Additional information (as meas-ured by I-2) has a statistically significant, positive effect on the chances of graduating from high school. It is also interesting to observe that teacher–pupil ratios are
posi-13For Eq. (1)), and candidate instruments given by the (N3
J) matrix Z1, Newey (1985)’s GMM procedure examines the population moment condition for unbiased estimation, given by
Z9
1es50. For Xss 5 [u r k Xs] and Rss5I2
Xss(X9ssXss)−1X9ss, the Newey procedure is implemented by
mul-tiplying the R2from the regression of e
s 5Rsss on Z1 by N,
which will be distributed as a chi-squared statistic with (J2
K) degrees of freedom.
14The youngest sample member is 26 in 1991.
15Analysis using total years of schooling completed by 1991
(not shown here) produces very similar results for I-2 and I-3, though somewhat weaker estimates for information effects on education using information measure I-1.
tively correlated with high school graduation (p,0.10), which stands in contrast to previous research on the effects of school spending (Hanushek, 1986). A high school’s dropout rate has a negative and significant relationship with graduation likelihoods, suggesting the possibility of some form of peer effect. Similar to the findings of previous research, minorities are more likely to graduate than whites once family background vari-ables are controlled (Cook and Ludwig, 1997 and Bog-gess, 1998).
In order to address possible differences in the edu-cational processes for African-Americans, Hispanics and non-Hispanic whites (Cameron and Heckman, 1997), I re-estimated the probit with interaction terms between race and information. I find that the effects of infor-mation on high school graduation may be somewhat larger for blacks than whites, while the effects of infor-mation appear smaller for Hispanics relative to whites and blacks. I also experimented with interaction terms for gender and information, and found no consistent dif-ferences between males and females in the effects of information on education outcomes.
The model described in Table 5 was re-estimated for each of the information measures, using high school graduation and then educational attainment as the depen-dent variables of interest. In Table 6, I present the coef-ficient estimates for the labor market information vari-ables from this series of regressions. Each of the labor market information measures has a positive and statisti-cally significant relationship with educational persist-ence, measured either by attainment or high school graduation. Moreover, the magnitude of the effects are not trivial. For example, for an African-American male living within an urban poverty area, a one-standard-devi-ation increase in I-1 increases the likelihood of gradu-ation by 2.5 percentage points (evaluated at the mean of
I-1 and the other explanatory variables), equal to around
one-fifth of the dropout rate among such teens. Black males in urban poverty ZIP codes with educational expectations or aspirations that are within 2 standard deviations of the average education of their occupational aspiration (I-2 or I-351) are 4 to 5 percentage points more likely to graduate than similar males with less congruence between educational and occupational aspir-ations (I-2 or I-350).
respon-26 J. Ludwig / Economics of Education Review 18 (1999) 17–30
Table 4
Labor market information measure used as dependent variable:
Explanatory variable: I-1 I-2 I-3
Male 20.09 (0.06) 0.60 (0.05)* 0.61 (0.04)*
Age 0.04 (0.01)* 0.02 (0.01)* 0.02 (0.01)*
African-American 20.40 (0.07)* 0.14 (0.07)1 0.13 (0.05)1
Hispanic 20.14 (0.08) 0.28 (0.08)* 0.24 (0.07)*
Family income (310,000) 0.10 (0.03)* 0.00(0.03) 0.02 (0.02)
Mother’s education 0.07 (0.01)* 0.03 (0.01)* 0.03 (0.01)*
Father not in HH 0.01 (0.07) 20.04 (0.07) 20.06 (0.07)
At 14, any HH Member:
Subscribe to mags 0.29 (0.05)* 0.10 (0.05)1 0.10 (0.05)1
Subscribe to paper 0.06 (0.06) 0.12 (0.05)1 0.06 (0.05)
Have library card 0.19 (0.05)* 0.09 (0.05) 0.05 (0.05)
Mom work when R 14 20.03 (0.06) 0.18 (0.06)* 0.15 (0.06)*
Dad work when R 14 20.03 (0.07) 20.03 (0.07) 20.08 (0.07)
% white clr mom’s indstry 0.70 (0.41) 0.96 (0.41)1 1.17 (0.40)*
% white clr dad’s indstry 1.14 (0.37)* 20.23 (0.36) 20.04 (0.35)
Resid in urban pov ZIP 0.42 (0.29) 0.55 (0.27)1 0.53 (0.27)
(male)*(urban pov resid) 20.42 (0.30) 20.93 (0.29)*ˆ 20.94 (0.28)*ˆ
City, not urban pov 0.02 (0.06) 20.03 (0.05) 20.02 (0.05)
rural (out of MSA) 0.10 (0.06) 0.01 (0.06) 0.04 (0.06)
Adj. R-sq/log likelihood 0.12 22281 22391
N 3,371 3,372 3,372
NOTE: Standard errors given in parentheses, *5statistically significant at 1% level.1 5significant at 5% level. Other explanatory variables include: constant term, guidance counselor-pupil ratio, and holdings in R’s school library.ˆ 5Likelihood ratio test (or F-test) indicates sum of coefficients for urban poverty residence and urban poverty residence-male interaction variables significantly different from zero at 5% level. Variable definitions: I-1: Total number of correct answers to the NLSY Occupational Duty Questions. I-2: 5 1 if [R’s educational aspiration] 2 [CPS-estimated average education of workers under 35 years of age in R’s aspired occupational group],2sd of R’s occupational group education. I-3:51 if [R’s expected educational attainment]2[CPS-estimated average education of workers under 35 years of age in R’s aspired occupational group],2sd of R’s occupational group.
dents in the NLSY who are 15 or younger in 1979 pro-duces qualitatively similar results. Fewer of the labor market information coefficient estimates are statistically significant, which is not surprising given that the sample size decreases by around 45 percent when this age restriction is imposed.
I also experiment with two-stage estimation methods to explore the possible endogeneity of the information variable in the education-outcome equations. Different combinations of the school- and MSA-level instru-ments16produce qualitatively similar results: large
posi-16Candidate instruments include variables that may reflect a
family’s neighborhood choice set within a metropolitan area or influence labor market information: percent of the MSA or county population that is African-American or has a high school degree, percent of households within the MSA or county that are headed by a female, and the ratio of guidance counselors to students in the respondent’s school. Specification tests based on Newey (1985) suggest that these instruments are valid, while tests based on Hausman (1978) cannot reject the null hypothesis that the information measures are exogeneous in the education-outcome equations.
Table 5
Explanatory variable: (1) (2)
Labor mkt Info (I-2) 0.16 (0.06)* 0.17 (0.08)1
(I-2)3(black) 0.13 (0.13) ˆ
(I-2)3(hispanic) 20.26 (0.15)
AFQT 0.03 (0.002)* 0.03 (0.002)*
Male 20.22 (0.06)* 20.22 (0.06)*
Age 0.12 (0.03)* 0.12 (0.03)*
Age-squared 20.004 (0.002)1 20.004 (0.002)1
African-American 0.67 (0.07)* 0.59 (0.11)*
Hispanic 0.17 (0.08)1 0.33 (0.12)*
Family income (310,000) 0.11 (0.04)* 0.11 (0.04)*
Mother’s education 0.02 (0.01)1 0.02 (0.01)1
Father not in HH 20.23 (0.08)* 20.23 (0.08)*
At 14, any HH Member:
Subscribe to mags 0.14 (0.06)1 0.13 (0.06)1
Subscribe to paper 0.02 (0.06) 0.01 (0.06)
Have library card 0.06 (0.06) 0.06 (0.06)
Mom work when R 14 0.01 (0.06) 0.02 (0.06)
Dad work when R 14 0.05 (0.07) 0.04 (0.07)
Teachers/students 4.65 (2.45) 4.55 (2.44)
School dropout rate 20.004 (0.001)* 20.004 (0.001)*
Resid in urban pov ZIP 20.12 (0.09) 20.012 (0.10)
City, not urban pov 0.07 (0.07) 0.07 (0.07)
Rural (out of MSA) 0.10 (0.08) 0.10 (0.08)
log likelihood 21345 21342
N 3,372 3,372
NOTE: Standard errors given in parentheses, *5statistically significant at 1% level.1 5significant at 5% level. Other explanatory variables include: constant term, and MSA unemployment and poverty rates. ˆ5Likelihood ratio test indicates sum of coefficients for labor market information plus interaction term between either black or Hispanic variable is statistically significant at 5% level.
Variable definitions: I-2:51 if [R’s educational aspiration]2[CPS-estimated average education of workers under 35 years of age in R’s aspired occupational group],2sd of R’s occupational group education.
Table 6
Coefficient estimates for labor market information effects on high school graduation
Information measure: High school graduation High school graduation Highest grade completed Highest grade completed
(I-1) 0.06 (0.02)* 0.05 (0.03) 0.06 (0.02)* 0.07 (0.03)1
(I-1)3(Black) 0.04 (0.05) ˆ 0.02 (0.05) ˆ
(I-1)3(Hispanic) 20.03 (0.05) 20.08 (0.06)
(I-2) 0.16 (0.06)* 0.17 (0.08)1 0.26 (0.06)* 0.31 (0.08)*
(I-2)3(Black) 0.13 (0.13) ˆ 20.09 (0.14) ˆ
(I-2)3(Hispanic) 20.26 (0.15) 20.17 (0.17) ˆ
(I-3) 0.17 (0.06)* 0.16 (0.08)1 0.35 (0.06)* 0.41 (0.06)*
(I-3)3(Black) 0.19 (0.13) ˆ 20.09 (0.13) ˆ
(I-3)3(Hispanic) 20.20 (0.15) 20.16 (0.16) ˆ
NOTES: Coefficients derived from estimating OLS and probit models specified as in Table 4. *5significant at 1 percent,1 5 significant at 5 percent, ˆ 5likelihood ratio test for significance of information plus information interacted with race exceeds 5 percent significance threshold.
to the full sample regressions. I find that the magnitudes of the information effects are generally as large within the AFQT groups as they are in the full sample analy-sis.17When I stratify the sample on the basis of residence
within an urban poverty area, I again find that the
28 J. Ludwig / Economics of Education Review 18 (1999) 17–30
7. Discussion
This paper provides an empirical exploration of Wil-son (1987)’s hypothesis that imperfect labor market information in high-poverty central city communities depresses schooling choices in these areas. The findings suggest that all teens seem to underestimate the edu-cational requirements of the occupations to which they aspire, consistent with Manski’s (1993) hypothesis that adolescents’ expectations of the returns to schooling need not be accurate, even on average. Teens in high-poverty ZIP code areas appear to have less labor market information than those teens who are least likely to live in high-poverty areas; this seems to be particularly true for males.
Teens who live in concentrated poverty areas have less information in part because they are more likely to come from less affluent families. The labor market information of teens appears to be related to the information of par-ents, as reflected by mother’s education, family income, and the work experiences of parents (including exposure to white-collar workers at their place of employment). More affluent teens also have more accurate labor market information because their parents are more likely to pro-vide resources that may be useful for learning about labor market and other social institutions, such as maga-zines and newspapers. Once I control for the possible endogeneity of neighborhood of residence (Evans et al., 1992), I find evidence to suggest that residence within an urban poverty neighborhood has an effect on information above and beyond the effects of family background.
These first two sets of findings are somewhat striking given that the socioeconomic composition of an NLSY respondent’s “true” neighborhood is measured with some error in this analysis. Measurement error in the poverty-neighborhood variable will cause the estimated effects of neighborhoods to be attenuated. Moreover, the relevant neighborhood from which adolescents draw role model observations may be smaller than the typical ZIP Code area. If family SES is positively correlated with the SES composition of the true (sub-ZIP-code) neighborhood area of interest, the results presented here may further understate the importance of neighborhoods for labor market information.
The final question examined in this paper is whether labor market information is associated with educational attainment. While education is likely to improve an indi-vidual’s ability to access and interpret information (Rosenzweig, 1995), labor market information measured
17The coefficients in the regressions for those in the lowest
third of the AFQT distribution are sometimes somewhat smaller than for the full sample, while the coefficients derived using the middle third of the AFQT distribution are typically some-what larger than those derived using the full sample.
in 1979 is likely to be a predetermined variable in a schooling equation which includes age and age-squared as explanatory variables. I find that labor market infor-mation is significantly correlated with schooling persist-ence. The effects are largest for high school graduation, particularly for black teens.
Of obvious importance is the ability of the NLSY labor market information variables to adequately meas-ure the information of survey participants. Previous stud-ies have found some evidence to suggest that variables similar to those used in the NLSY measure labor market information as well as commercially-used instruments, and that these information variables have an association with labor market outcomes that does not appear to reflect unmeasured ability.
A particular concern is the possibility that the NLSY labor market information variables serve as proxies for poverty or ability in the education-outcome equations, despite my controls for student, family, school, and MSA characteristics as well as AFQT scores. However, I find that the estimated effects of information on educational outcomes appear to be as large within urban poverty areas or AFQT strata as they are with the full sample. Moreover, if the information variables are correlated with omitted student or family variables we would expect the exogeneity condition for these variables to be violated, which does not appear to be the case using Hausman (1978)-type tests. These findings provide some suggestive evidence that the information measures are more than proxies for aptitude or poverty.
In sum, the results presented in this paper are consist-ent with Wilson’s hypothesis that teens in high-poverty areas drop out in part because of imperfect information about the labor market. While there is some evidence to suggest that the information measures used here are related to labor market information and serve as more than proxies for ability or poverty, there is no way to empirically link these measures with the earnings expec-tations of teenagers. Nevertheless, these results, taken together with Betts (1996)’s findings that lower-income college students have lower expectations of the earnings of college graduates, provide some suggestive support for the idea that lower-income teens in high-poverty areas do not accurately perceive the incentives for schooling. These initial findings will hopefully spur future research on the expected returns to schooling for-med by teens in our central cities, and increase attention devoted to the mechanisms through which neighbor-hoods influence educational outcomes.
Acknowledgements
would like to thank Scott Boggess, Charles Clotfelter, Philip Cook, Helen Ladd, Michael Moore, Marjorie McElroy, Mark An, Kip Viscusi, Robert Slonim, Laurie Bassi, William Prosser and Jeffrey Conte for their invaluable contributions to this paper. I am also grateful to Charles Manski, Peter Streufert, and Ted Shen for sharing their unpublished working papers, and to the Bureau of Labor Statistics for making ZIP Code data available for use with the NLSY. Any remaining errors are my own.
References
Becker, G. S. (1964) Human Capital. NBER, New York. Betts, J.R., 1996. What do students know about wages? Journal
of Human Resources 31 (1), 27–56.
Boggess, S. (1998) Family structure, economic status, and edu-cational attainment. Journal of Population Economics, 11, (2).
Bound, J., Jaeger, D. A. and Baker, R. (1993). The cure can be worse than the disease: A cautionary tale regarding instru-mental variables. NBER Technical Paper 137.
Brooks-Gunn, J., Duncan, G., Klebanov, P.K., Sealand, N., 1993. Do neighborhoods influence child and adolescent development? Am. J. Sociol. 99 (2), 353–395.
Cameron, S. V. and Heckman, J. J. (1997) The dynamics of educational attainment for blacks, hispanics, and whites. Presented at the 1997 SOLE meetings, Washington, DC. Coleman, J. (1966). Equality of Educational Opportunity. GPO,
Washington, DC.
Cook, P.J., Ludwig, J., 1997. Weighing the “burden of ‘acting white’ ”: Are there race differences in attitudes towards edu-cation? J. of Policy Analysis and Management 16 (2), 256–278.
Datcher-Loury, L., 1989. Family background and school achievement among low income blacks. Journal of Human Resources 24 (3), 528–544.
Dominitz, J., Manski, C., 1996. Eliciting student expectations of the returns to schooling. Journal of Human Resources 31 (1), 1–26.
Evans, W., Oates, W., Schwab, R., 1992. Measuring peer group effects: A study of teenage behavior. Journal of Political Economy 100 (5), 966–991.
Freeman, R. B. (1971), The Market for College-Trained
Man-power. Harvard University Press, Cambridge.
Gramlich, E., Laren, D., Sealand, N., 1992. Moving into and out of poor urban areas. J. of Policy Analysis and Manage-ment 11 (2), 273–287.
Guilkey, D., Mroz, T. and Taylor, L. (1992) Estimation and testing in simultaneous equations models with discrete out-comes using cross section data. UNC Working Paper. Hanushek, E., 1986. The economics of schooling: Production
and efficiency in public schools. Journal of Economic Literature 24, 1141–1177.
Hausman, J.A., 1978. Specification tests in econometrics. Econometrica 46 (6), 1251–1271.
Haveman, R., Wolfe, B. and Wilson, K. (1994) The determi-nants of educational success: Reduced form and structural estimates. Presented at the 1995 AEA Meetings.
Herbert, B. (1994) Who will help the black man? New York
Times Magazine, December 4, pp. 77.
Herrnstein, R. and Murray, C. (1994). The Bell Curve. Free Press, New York.
Holden, K., Peel, D. A., and Thompson, J. (1985).
Expec-tations: Theory and Evidence. St. Martin’s Press, New
York.
Jargowsky, P. and Bane, M.J. (1990) Ghetto poverty: Basic questions. In Inner City Poverty in the United States, eds L. Lynn and M. McGeary, pp. 16-67. National Academy Press, Washington, DC.
Jargowsky, P. and Bane, M.J. (1991) Ghetto poverty in the United States, 1970–1980. In The Urban Underclass, eds P. E. Peterson and C. Jencks, pp. 235-273. Brookings, Wash-ington, DC.
Jencks, C. and Mayer, S. (1990) The social consequences of growing up in a poor neighborhood. In Inner-City Poverty
in the United States, eds L. E. Lynn and M. McGeary, pp.
111-186. National Academy Press, Washington, DC. Kain, J. F. (1992) The cumulative impacts of slavery, Jim Crow,
and housing market discrimination on black welfare. Presented at the 1992 TRED Conference.
Kasarda, J. D. (1985) Urban change and minority opportunities. In The New Urban Reality, ed. P. E. Petersen, pp. 33-68. Brookings, Washington, DC.
Kohen, A., Breinich, S., 1975. Knowledge of the world of work: A test of occupational information for young men. Journal of Vocational Behavior 6, 133–144.
Leonard, J., 1982. Wage expectations in the labor market: Sur-vey evidence on rationality. Rev. Econ. and Stat. 21 (3), 307–316.
Ludwig, J. (1994) Information and Inner City Educational
Attainment. Unpublished doctoral dissertation. Duke
Uni-versity.
Manski, C.F. (1993) Adolescent econometricians: How do youth infer the returns to schooling? In Studies of Supply
and Demand in Higher Education, eds C. T. Clotfelter and
M. Rothschild, University of Chicago Press, Chicago. Murnane, R., Levy, F., 1993. Why today’s
high-school-edu-cated males earn less than their fathers did: The problem and an assessment of responses. Harvard Educational Review 63 (1), 1–19.
Murnane, R., Willett, J., Levy, F., 1995. The growing impor-tance of cognitive skills in wage determination. Rev. Econ. and Stat. 77 (2), 251–266.
Newey, W., 1985. Maximum likelihood specification testing and conditional moment tests. Econometrica 53 (5), 1047– 1070.
Ogbu, J. (1978). Minority Education and Caste: The American
System in Cross-Cultural Perspective. Academic Press,
New York.
Parnes, H., Kohen, A., 1975. Occupational information and labor market status: The case of young men. Journal of Human Resources 10 (1), 44–55.
Rosen, S. (1994) Job information and education. In The
Inter-national Encyclopedia of Education. eds T. Husen and T.
N. Postlethwaite, 2nd Edn, Vol. 1, pp. 3096-3101. Perga-mon, Oxford.
Rosenzweig, M.R., 1995. Why are there returns to schooling? American Economic Review 85 (2), 153–158.
30 J. Ludwig / Economics of Education Review 18 (1999) 17–30
issues and evidence. Review of Educational Research 57 (2), 101–121.
Sah, R.K., 1991. Social osmosis and patterns of crime. Journal of Political Economy 99 (6), 1272–1295.
Smith, J.P., Welch, F., 1989. Black economic progress after Myrdal. Journal of Economic Literature 27, 519–564. Smith, H., Powell, B., 1990. Great expectations: Variations in
income expectations among college seniors. Sociology Educ. 63, 194–207.
Streufert, P. (1991) The effect of social isolation on schooling choice. Working paper, Institute for Research on Poverty. Viscusi, W.K., 1990. Do smokers greatly underestimate risks?
Journal of Political Economy 98 (6), 1253–1269. Wildavsky, A., 1990. Review essay: Henry Aaron’s ‘Politics
and the professors: The Great Society in perspective’. Jour-nal of Human Resources 25 (2), 305–311.