www.elsevier.com/locate/ibmb
Metabolic pathways for diacylglycerol biosynthesis and release in
the midgut of larval
Manduca sexta
Lilian E. Canavoso, Michael A. Wells
*Department of Biochemistry and Center for Insect Science, Biological Sciences West, The University of Arizona, Tucson, AZ 85721-0088, USA
Received 4 February 2000; received in revised form 18 April 2000; accepted 28 April 2000
Abstract
The pathway for the synthesis of diacylglycerol in larvalManduca sextamidgut was studied. Fifth instar larvae were fed with [9,10–3H]–oleic acid–labeled triolein and the incorporation of the label into lipid intermediates was analyzed as a function of time.
The results showed that the triacylglycerol was hydrolyzed to fatty acids and glycerol in the midgut lumen. In midgut tissue, the labeled fatty acids were rapidly incorporated into phosphatidic acid, diacylglycerol and triacylglycerol, but no significant labeling of monoacylglycerol was observed. Dual-labeling experiments were performed in order to characterize the kinetics of diacylglycerol biosynthesis in the midgut, its incorporation into hemolymph lipophorin and its clearance from hemolymph. The results were best described by a model in which the rate-limiting step in diacylglycerol biosynthesis was the uptake of fatty acid from the lumen of the midgut. Once in the cell the fatty acid was rapidly incorporated in phosphatidic acid and diacylglycerol. Diacylglycerol was converted to triacylglycerol or exported into hemolymph. The interconversion of diacylglycerol and triacylglycerol was fairly rapid, suggesting that triacylglycerol serves as a reservoir from which diacylglycerol can be produced. This mechanism permits the cell to maintain a low steady-state concentration of diacylglycerol and yet efficiently absorb fatty acids from the lumen of the midgut.
2000 Elsevier Science Ltd. All rights reserved.
Keywords:Midgut;Manduca sexta; Diacylglycerol; Triacylglycerol; Hemolymph; Lipophorin
1. Introduction
In insects, dietary lipids are processed and absorbed in the midgut (Beenakkers et al., 1985; Downer, 1985; Turunen and Crailsheim, 1996). Two models of lipolysis of triacylglycerol (TAG) have been suggested to occur in the midgut (Beenakkers et al., 1985), 1) the complete hydrolysis to fatty acid (FA) and glycerol (Weintrab and Tietz 1973, 1978; Tsuchida and Wells, 1988) and 2) the formation of monoacylglycerol (MAG) and FAs as the end products (Hoffman and Downer, 1979; Male and Storey, 1981). After digestion, absorbed FA and partial acylglycerols, if present, are incorporated into intestinal diacylglycerol (DAG), TAG and phospholipids (PL) (Turunen and Crailsheim, 1996). The synthesis could proceed by acylation of 2–MAG (MAG–pathway) to
* Corresponding author. Tel.:+1-520-621-3847; fax: +1-520-621-9288.
E-mail address:[email protected] (M.A. Wells).
0965-1748/00/$ - see front matter2000 Elsevier Science Ltd. All rights reserved. PII: S 0 9 6 5 - 1 7 4 8 ( 0 0 ) 0 0 0 9 4 - 1
form 1,2–DAG or 1,2–DAG could be made by de novo synthesis from sn–glycerol–3–phosphate via phosphat-idic acid (PA) (PA–pathway) using the fatty acids pro-duced by TAG hydrolysis (Downer, 1985; Turunen and Crailsheim, 1996). The mammalian intestine uses both pathways for the synthesis of chylomicron–TAG (Paris and Clement, 1986; Yang and Kuksis, 1991). The rela-tive contributions of the PA–and MAG–pathways have not been established in any insect, although, it has been proposed that the absorption of partial acylglycerols and the MAG–pathway might be the predominant pathway for 1,2–DAG synthesis (Turunen, 1993; Turunen and Crailsheim, 1996), based on the production of MAG dur-ing lipolysis in the midgut of some insects (Hoffman and Downer, 1979; Male and Storey, 1981). In Pieris brascicae, dietary DAG was used in the midgut cells in the synthesis ofsn–1,2–DAG, indicating the presence of the PA–pathway (Turunen, 1993).
and previous reports have shown the FA are transformed in the midgut cells into DAG and transported assn–1,2– DAG through the hemolymph by lipophorin, the main lipoprotein in insects (Tsuchida and Wells, 1988; Soul-ages and Wells, 1994). Insects resemble vertebrates in the overall design of lipid digestion, although a clear distinction is established by the fact that DAG consti-tutes the main lipid exported from the midgut (Chino, 1985; Soulages and Wells, 1994) and because DAG release does not involve the biosynthesis of a lipoprotein particle in the midgut cell (Prasad et al., 1986; Shapiro et al., 1988).
In order to begin characterizing the mechanism of lipid absorption and export from the midgut inM. sexta, we have studied the pathway for the synthesis of DAG. In addition, by using a dual-labeling technique, a kinetic model for the overall metabolism of DAG in the midgut is proposed.
2. Material and methods
2.1. Insects
First-or-second-dayM. sextafifth instar larvae from a colony maintained in this laboratory were employed. This colony, originally established from M. sexta eggs obtained from the USDA, State University Station, Fargo, ND is maintained according to the basic rearing techniques of Bell and Joachim, with minor modifi-cations (Bell and Joachim, 1976).
2.2. Materials
[9,10–3H]–Oleic acid–labeled triolein and [9,10(n)– 3H]–oleic acid were purchased from New England
Nuclear (Boston, MA). [1–14C]–Oleic acid and [1(3)– 3H]–glycerol were from Amersham (Arlington Heights,
IL). Silica gel plates were obtained from J.T. Baker. Gly-cerol kinase and phospholipase A2were purchased from
Sigma (St. Louis, MO). All other chemicals were of ana-lytical grade.
2.3. The fate of fed TAG
The pathway for the biosynthesis of DAG in the midgut was studied by feeding fatty acid labeled triolein to first-day fifth instar larvae and following the incorpor-ation of the label into lipid intermediates in midgut tissue. The label was also analyzed in lipids from the hemolymph and midgut lumenal contents. Insects starved for 1 h were fed individually with 1µCi of fatty acid labeled triolein spread onto a small piece of artificial diet (1.2% fat, Fernando-Warnakulasuriya et al., 1988). Insects that consumed the diet in two minutes (time 0) were then placed on unlabeled diet with identical
compo-sition. At different times, insects were immobilized and hemolymph collected by puncturing a proleg with a needle and gently pressing the abdomen. The entire midgut was dissected under cold lepidopteran saline (5 mM KH2PO4, 100 mM KCl, 4 mM NaCl, 15 mM
MgCl2, 2mM CaCl2, pH 6.5). After removal of the
con-tents, midguts were washed with cold lepidopteran saline and the washes were combined with the contents. Hemo-lymph, midgut lumenal contents and midgut tissues were processed immediately for lipid extraction (Folch et al., 1957). The lipids from the extracts were separated by thin-layer chromatography (TLC) on silica gel using hexane–ethyl ether–formic acid 70:30:3 (v/v/v). The MAG, DAG, FA, TAG and PL fractions were visualized with iodine vapor, scraped from the plates, and the radio-activity was counted. The separation and identification of the PA intermediate in midgut tissue was performed after eluting the PL from the TLC plate with chloro-form–methanol–acetic acid–water 50:39:1:10 (v/v/v). Then the PA was separated from the other PL by TLC on silica gel plates as described (Possmayer et al., 1968; Henderson and Tocher, 1992). The PA fraction and the rest of PL in the lane (combined as a single fraction) were scraped from the plate and the radioactivity coun-ted.
2.4. Stereospecific analysis of DAG from the midgut
The stereochemistry of the DAG from the midgut was determined by the method of Brockerhoff (1965). Briefly, insects were fed for 24 h on diet containing [1(3)–3H]–glycerol (10 µCi/g of diet). Lipids from the
midgut were extracted and small aliquots were used to determine the total radioactivity. The rest of the lipids were separated by TLC on silica gel G plates impreg-nated with 1.2% boric acid, using chloroform–acetone 96: 4 (v/v) as a developing system (Skipski and Barclay, 1969). sn–1,3–DAG and the mixture of sn–1,2(2,3)– DAG were scraped separately from the plates. The radio-activity in sn–1,3–DAG was counted by liquid scintil-lation counting and the mixture ofsn–1,2(2,3)–DAG was eluted from the gel with diethyl ether.sn–1,2(2,3)–DAG were converted to a mixture ofd– andl
–phosphatidyl-phenols, which were isolated as the triethylammonium salts. Thed,l–phosphatidylphenols were dissolved in 1
ml diethyl ether and mixed with 1 ml Tris–HCl buffer (0.1 M, pH 8.6), containing 6 mM CaCl2 and two
ali-quots of 0.5 ml were removed. To one aliquot was added 300 units of phospholipase A2, which will react only
with the l–phosphatidylphenol. Both reaction mixtures
were shaken continuously for 3 h at 37°C. The products were separated on TLC with the solvent system chloro-form–methanol–3% aqueous ammonia 63:30:7 (v/v/v). The untreated d,l–phosphatidyl phenols gave one spot
whereas the phospholipase A2-treated fraction with gave
and the l–lysophosphatidylphenol. The spots were
scraped and the radioactivity counted. This experiment was repeated four times.
2.5. Labeling of midgut lipids
In order to study the turnover of lipids in the midgut, as well as to perform the dual-label experiment, we needed insects in which the midgut lipid pools were lab-eled to constant specific activity (Arrese and Wells, 1997). First-day fifth instar larvae were individually placed in cups and fed on unlabeled artificial diet for 24 h. After that, the diet was removed from the cups and replaced with labeled diet, in which [9,10(n)–3H] oleic
acid was incorporated at a concentration of 1 µCi/g of diet. Insects were fed on the labeled diet for 3 or 6 h (short term labeling) or 24 h (long term labeling), the midguts were dissected, and the lipids extracted and sep-arated as described above. PL, MAG, DAG, FA and TAG were scraped from the plates, the radioactivity counted and the distribution of the radioactivity among lipid classes was analyzed. Midgut lipid composition was obtained after eluting the lipid fractions from the TLC. MAG, DAG and TAG were subjected to saponifi-cation and the glycerol was extracted and measured enzymatically by glycerol kinase assays (Pinter et al., 1967). PL was determined by measuring the mass of phosphorous (Dittmer and Wells, 1969) and FA by a colorimetric assay (Duncombe, 1963).
2.6. The turnover of midgut tissue lipids
In order to estimate the half-lives of the PA, DAG and TAG pools in the midgut, as well as the turnover of DAG in the hemolymph–Lp, insects were fed with [9,10(n)–3H]–oleic acid for 24. Then they were
trans-ferred to unlabeled diet, and the change in radioactivity in midgut lipids and hemolymph DAG was followed for several hours with the time of transfer defined as time=0. At each time, both midgut tissue and hemolymph were sampled and processed for lipid extraction. Small ali-quots of the lipid extracts were used for the determi-nation of total radioactivity. Then, the lipids were separ-ated by TLC using the solvent systems as described above and the radioactivity in each lipid fraction determ-ined by liquid scintillation counting.
2.7. Dual-label experiments
To determine the kinetics of DAG biosynthesis and transport, midgut lipids were labeled to constant specific activity by feeding [9,10(n)–3H]–oleic acid for 24 h, as
described above. After that, insects received a “pulse” of [1–14C]–oleic acid (1µCi/insect) orally and then they
were returned to the original3H–labeled diet. At several
time points after the pulse of 14C, hemolymph and
midgut were removed from individual insects, lipids extracted and the 14C/13H ratio in PA, DAG and TAG
separated by TLC was determined by liquid scintillation counting (Possmayer et al., 1968; Henderson and Tocher, 1992). In this experiment the distribution of [3H]–label in the midgut lipids was a measure of their
mass. Therefore, the ratio of 14C/3H was a measure of
the apparent specific activities of the lipids. In order to develop a kinetic model for the DAG synthesis and export, the apparent specific activities in midgut–PA, – DAG, and –TAG, and hemolymph–DAG were fit to various metabolic schemes using the program “Chemical Kinetics Simulator Version 1.0” (IBM, 1996, available at http://www.almaden.ibm.com/st/msim/). Although this is an empirical approach in which one writes various schemes and then the program calculates the progression curves, we chose the best fit on the basis of the scheme and parameters that yielded the smallest root mean square deviation between experimental and calculated data. More details are presented in Table 2.
2.8. Statistical analysis
Each experiment was performed in duplicate using five insects per point and the samples from each insect were individually analyzed. The results are expressed as a mean±SEM. P,0.05 was considered as a significant difference between means.
3. Results
3.1. Characterization of midgut lipids
The composition of midgut lipids has not been pre-viously reported. Our analyses showed that TAG was the main lipid in this tissue (76.4±1.50%), whereas DAG, MAG and FA represented 10.30±0.53%, 1.74±0.08% and 1.1±0.11%, respectively. The PL frac-tion comprised 10.46±1.03% of the total lipid mass.
3.2. Stereospecific analysis of the midgut DAG pool
The stereospecific analysis of the midgut–DAG pool showed that sn–1,2–DAG comprised 75.37%±1.44% of the total DAG, whereas sn–2,3 and sn–1,3–DAG rep-resented 14.62%±1.47% and 9.87%±0.57%, respect-ively.
3.3. The pathway for DAG synthesis in midgut
Fig. 1. Time course of the distribution of the label among lipid fractions from midgut lumenal content (A), midgut tissue (B) and hemolymph (C) after insects were fed with [9,10–3H]–oleic acid labeled triolein. Lipid extracts were separated by TLC and the radioactivity of each lipid
determined by liquid scintillation assay of silica gel scrapings. Results are expressed as total cpm±SEM (n=6–8). FA (—j—), TAG (—s—), MAG (—g—), DAG (—G—) and PA (—h—).
lumenal TAG was hydrolyzed during the first 30 minutes after feeding. The level of lumenal FA reached a maximum in about 15 minutes and remained at more or less a constant value for the next three hours. By 360 min the amount of label in the midgut lumen was reduced to an insignificant level. Because most of the radioactivity in the midgut lumen was found in either TAG or FA (Fig. 1(A)), it is apparent that TAG was hydrolyzed to FA and glycerol in the lumen before their absorption. It is also interesting to note that the level of FA in the lumen remained at a high level for a long time, which might suggest that uptake of FA from the lumen is rate limiting.
In midgut tissue there was a rapid incorporation of the labeled fatty acid into PA, DAG and TAG (Fig. 1(B)). Between 15 and 60 min there was a steady-state level of radioactivity in PA and DAG, and an increasing level of labeling in TAG (60 min vs. 15 min, P,0.0001). After 60 min, the amount of label in all three lipids was reduced. During the time course, only small and insig-nificant amounts of label were recovered in MAG. These results are consistent with the PA pathway being the pathway for DAG synthesis in midgut. The amount of labeled free FA was also small (result not shown).
In hemolymph, more than 90% of the label was found in DAG at all time points and its maximum level was reached at 120 min (Fig. 1(C)). By 360 min the amount of label in hemolymph DAG was significantly reduced, showing that clearance of DAG from hemolymph was occurring.
3.4. Turnover of midgut lipids
Midgut lipids were homogeneously labeled by feeding insects for 24 h on a diet containing [3H]–oleic acid and
Fig. 2. Decay of the total radioactivity in midgut–TAG (—s—), midgut–PA (—h—), midgut–DAG (—G—) and DAG–hemolymph (—h—). Insects were fed for 24h with [9,10(n)–3H] oleic acid and
then allowed to continue feeding on unlabeled diet. Samples were taken at the time of transfer to the unlabeled diet (time 0) and at several later times. Lipid extracts were separated by TLC and the radioactivity of each lipid determined by liquid scintillation assay of silica gel scrap-ings. Results are expressed as log total cpm±SEM (n=6–8) in each
lipid fraction.
Table 1
Rate constants and half-lives for the turnover of midgut and hemo-lymph lipids
Lipid k(h21) t1/2(h)
Midgut–PAa 0.500±0.070 1.4
Midgut–DAGa,b 0.206±0.021 3.4
Midgut–TAGa,b,c 0.319±0.034 2.2
Hemolymph–DAGa,b,c 0.290±0.040 2.3
akfor midgut–PA vs. all other ks (P ,0.01).
b kfor midgut–DAG vs.kfor midgut–TAG orkfor hemolymph–
DAG (P,0.05).
ckfor midgut–TAG vs.kfor hemolymph–DAG (P .0.5).
result suggested that midgut TAG may serve as a reser-voir for the DAG that is exported into hemolymph.
3.5. Labeling of midgut lipids
In order to characterize more thoroughly possible pre-cursor–product relationships between midgut lipids or between midgut and hemolymph lipids, it is necessary to measure the specific activity of the lipids at various times after feeding a pulse of labeled fatty acid. After achieving uniform labeling of midgut lipids by long-term feeding with [9,10(n)–3H]–oleic acid, the specific
activity of each lipid after feeding a pulse of [14C]–oleic
acid is the ratio of [14C]/[3H]. Uniform labeling of
midgut lipids was achieved by feeding [3H]–oleic acid–
labeled diet for various times. The distribution of label among the neutral lipids was the same whether insects were fed labeled diet for a short or long time. Thus, with short or long-term feeding 69.78%±2.30% of the label in
the midgut lipids was found in TAG; DAG represented 7.50±0.46% and the percentages of MAG and FA were 1.48±0.21% and 0.91±0.07%, respectively. The rela-tively constant levels of labeling reached by the neutral lipids after a short time of feeding suggested a rapid rate of turnover of these lipids in the midgut. In contrast to the neutral lipids, phospholipid labeling showed a sig-nificant change with time and percentage of radioactivity in PL increased from 16.39% at 3 h to 27.20% (P,0.05) after 24 h.
The specific activities of midgut–DAG and midgut– TAG, defined as %cpm in DAG or TAG/% lipid mass as DAG or TAG, after 24 h of feeding the labeled diet were 0.70±0.03 and 0.84±0.07 respectively, and were not significantly different from those after 3 h of feeding (0.82±0.06 and 0.94±0.01 for DAG and TAG, respectively). These results indicate that the TAG and DAG pools can be homogeneously labeled within 24 h, which allows us to assume that the amount of radioac-tivity present in each lipid is equivalent to their molar content in the midgut.
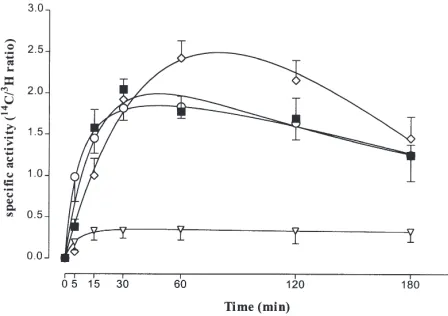
3.6. Dual-label experiments
To determine the kinetics of biosynthesis and release of DAG from the midgut to the hemolymph, midgut lip-ids were labeled with [3H]–oleic acid as described above
and then insects received a pulse of [1–14C] oleic acid.
The changes in the specific activity of midgut PA, DAG and TAG, and hemolymph–DAG, as reflected in the [14C]/[3H] ratio, were analyzed as a function of the time
(Fig. 3).
The specific activity of the midgut PA pool reached a low and constant level within 15 min and remained constant over the duration of the experiment. The
spe-Fig. 3. Time-course of the specific activities in PA (—h—), DAG (—s—) and TAG (—j—) in midgut and in hemolymph–DAG (—e—) after insects with homogeneously pre-labeled midgut lipids received a pulse of [1–14C]–oleic acid. Lipid extracts were separated
cific activities of the midgut–DAG and midgut–TAG pools increased for the first 30-min, then slowly declined during the rest of the experiment. At 5 min the specific activity of the midgut DAG pool was higher than that of the midgut TAG pool, but after that the specific activi-ties of the midgut DAG and TAG pools were not sig-nificantly different. The specific activity of the hemo-lymph DAG pool increased more slowly than that of the midgut lipids and was significantly higher than that of the midgut DAG and TAG at 60 min(P,0.05) but after 120 min the specific activities of the midgut DAG and TAG, and the hemolymph DAG pools were not signifi-cantly different. The specific activity of the MAG pool was low and did not change during the time-course (result not shown).
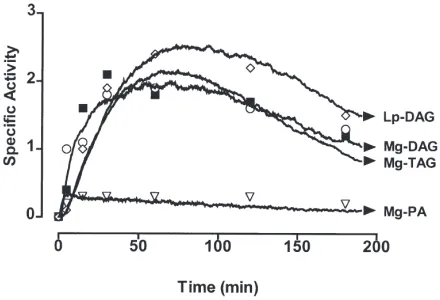
3.7. A model for DAG biosynthesis and release from the midgut
All the data presented above are consistent with a model in which DAG is synthesized exclusively by the PA pathway (Beenakkers et al., 1985) and midgut–TAG serves as a reservoir for the synthesis and release of DAG destined for excretion into the hemolymph (Downer, 1985). The specific activity data were fit to various pathways using the kinetic simulator program. The scheme that gave the best fit, along with the relevant rate constants, is given in Table 2. The fit of the
calcu-Table 2
Kinetic simulation of DAG biosynthesis and export from the midguta
Reaction Step Rate Constant (l/mole–min)
Lm–FA→Mg–FA 7.5×10²³
2 Mg–FA→Mg–PA 1.0
Mg–PA→Mg–DAG 7.5×10²¹
Mg–DAG→Mg–TAG 2.0×10²¹
Mg–TAG→Mg–DAG 7.5×10²²
Mg–DAG→Lp–DAG 8.5×10²²
Lp–DAG→Lp 6.5×10²²
aThe apparent specific activities of midgut–PA, –DAG, and –TAG,
and hemolymph–DAG were fit to various metabolic schemes using the program “Chemical Kinetics Simulator Version 1.0” (IBM, 1996, available at http://www.almaden.ibm.com/st/msim/). The scheme above and the indicated rate constants gave the best fit, which was determined empirically. In developing this scheme, it was assumed that initially all of the radioactivity was present as lumenal FA and this is set in the simulation by the initial condition in which the [Lm– FA]=72.5 M and the concentration of all other compounds is=0. The simulation used 100,000 molecules and recorded data every 75 events. The simulation was set up to run for 190 min. The final simulation contained 3692 data points, which were exported as a text file into GraphPad Prism (GraphPad Software, San Diego California, USA) in order to plot the calculated curve and the experimental data (Fig. 4). The best fit was determined on the basis of the smallest root mean square deviation between experimental and calculated points, which was 0.276 for the scheme and parameters listed above. Lm–FA=lumen FA; Mg–FA=midgut FA; Mg–PA=midgut PA; Mg–DAG=midgut DAG; Mg–TAG=midgut TAG; Lp–DAG=lipophorin–DAG; Lp=lipo-phorin.
lated curves to the experimental data is shown in Fig. 4. The key features of the simulation were 1) the uptake of FA into the midgut must be the rate-limiting step; otherwise it is impossible to achieve a steady-state level of PA. This result is consistent with the finding that the level of lumenal FA remains high for an extended period (Fig. 1(A)). 2) The synthesis of PA must be the fastest step, with the synthesis of midgut–DAG and TAG also occurring rapidly. 3) The conversion of midgut TAG back to midgut DAG, export of DAG into the hemo-lymph and clearance of DAG from the hemohemo-lymph all occur at about the same rate and are slower that the syn-thesis of midgut DAG and TAG. This model is consist-ent with the midgut TAG pool serving as a reservoir for hemolymph DAG. The model also suggests that the rate of export of DAG from the midgut into lipophorin is regulated by the rate at which DAG is cleared from the hemolymph.
4. Discussion
In this paper we have shown that DAG is synthesized in the larval M. sexta midgut by the phosphatidic acid pathway, which involves acylation of glycerol–3–phos-phate to form PA, using the FA produced by TAG hydrolysis, and subsequent conversion of PA to DAG. Such a pathway is consistent with the fact that 1) TAG is completely hydrolyzed to FA and glycerol in the midgut lumen (Tsuchida and Wells, 1988; Fig. 1(A)) and 2) there is incorporation of the label into the intermediate PA, as well as DAG and TAG among midgut lipids (Fig. 1(B)). Complete hydrolysis of TAG to FA and glycerol is probably a result of the very high pH in the midgut lumen, which would cause acyl migration of 2–MAG to 1(3)–MAG and its subsequent hydrolysis (Dow, 1986;
Tsuchida and Wells, 1988). In the absence of partial hydrolysis products in the midgut lumen, there would be no substrates for the MAG pathway. The use of the PA pathway in midgut cells would depend upon the avail-ability of glycerol–3–phosphate. Because carbohydrates are a significant component of the larval diet (Fernando-Warnakulasuriya et al., 1988), there should be ample carbohydrate to provide the required glycerol–3–phos-phate.
Tsuchida and Wells (1988) noted a large accumulation of labeled TAG in the midgut after feeding label TAG to larvae. We have confirmed and extended this obser-vation (Fig. 1) and shown that the TAG pool in the midgut is metabolic very active. In fact, the half-life of TAG in the midgut is shorter than that of midgut DAG and equal to that of hemolymph DAG. This suggests that the midgut TAG pool serves as a reservoir from which DAG is produced at a rate consistent with its export into the hemolymph. This mechanism would allow the midgut to absorb dietary fatty acids efficiently and store them as TAG, thus avoiding accumulation of DAG, which is toxic at high concentrations (Soulages and Wells, 1994; Florin-Christensen et al., 1998). TAG accumulation was also observed in Aeshna Cyanea
(Komnick et al., 1984). Recently, in M. sexta we have obtained evidence for a midgut cytosolic lipase, which hydrolyzes TAG to form sn–1,2–DAG (Rubiolo and Wells, unpublished results). The fatty acids resulting from this hydrolysis would contribute to either re-esteri-fication of DAG or formation of PA, or both. We have no information about the fate of these fatty acids, but the slow turnover of the midgut DAG pool appears to be consistent with the first possibility.
Based on the results of the experiments reported here we developed a model for the biosynthesis and export of DAG from the midgut. The simulated curves repro-duce the main features of the experimental results. There are several key elements in the model; 1) the uptake of fatty acid from the midgut is rate limiting. This assump-tion was necessary in order to establish a steady state in the midgut PA concentration and was consistent with the high and nearly constant levels of labeled FA in the midgut lumen. 2) The synthesis of midgut PA, DAG and TAG are rapid. 3) Conversion of TAG into DAG is slow and occurs at about the same rate as labeled DAG is cleared from the hemolymph. The ratio of the mass of DAG to TAG is about 1:10, so a rapid equilibration is required in order for them to reach the same specific activity. 4) This model correctly predicts that the specific activity of the lipophorin DAG pool will be higher than the tissue DAG or TAG pools. Note that it was not necessary to propose two separate pools of DAG within the midgut to achieve this result.
Several key questions remain to be answered. What is the mechanism of FA uptake into the midgut? Our data suggest that a fatty acid carrier protein might be
involved, as occurs in the vertebrate enterocyte (Hui and Bernlohr, 1997; Stahl et al., 1999). How are FAs targeted to their metabolic pathways? Two fatty acid-binding pro-teins have been isolated from the midgut of M. sexta
(Smith et al., 1992), but their function is unknown. Finally, the mechanism by which DAG leaves the midgut and associates with lipophorin is unknown and represents an important area for future research.
Acknowledgements
We thank Mary Hernandez for animal care. This work was supported by NIH grant GM50008.
References
Arrese, L.E., Wells, M.A., 1997. Adipokinetic hormone-induced lip-olysis in the fat body of an insect, Manduca Sexta: synthesis of
sn–1,2–diacylglycerols. J. Lipid Res. 38, 68–76.
Beenakkers, A.M.T., Van der Horst, D.J., Van Marrewijk, W.J.A., 1985. Insect lipids and lipoproteins, and their role in physiological processes. Prog. Lipid Res. 24, 19–67.
Bell, R.A., Joachim, F.G., 1976. Techniques for rearing laboratory col-onies of tobacco hornworms and pink bollworms. Ann. Entomol. Soc. Am. 69, 635–673.
Brockerhoff, H., 1965. A stereospecific analysis of triglycerides. J. Lipid Res. 6, 10–15.
Chino, H., 1985. Lipid transport: biochemistry of hemolymph lipopho-rin. In: Kerkut, G.A., Gilbert, L.I. (Eds.), Comprehensive Insect Physiology, Biochemistry and Pharmacology, vol. 10. Pergamon Press, Oxford, pp. 115–135.
Dittmer, J.C., Wells, M.A., 1969. Quantitative and qualitative analysis of lipids and lipid components. Meth. Enzymol. 14, 482–530. Dow, J.A.T., 1986. Insect midgut function. Adv. Insect Physiol. 19,
188–328.
Downer, R.G.H., 1985. Lipid metabolism. In: Kerkut, G.A., Gilbert, L.I. (Eds.), Comprehensive Insect Physiology, Biochemistry and Pharmacology, vol. 10. Pergamon Press, Oxford, pp. 77–113. Duncombe, W.G., 1963. The colorimetric micro-determination of
long-chain fatty acids. Biochem. J. 88, 7–10.
Fernando-Warnakulasuriya, G.J.P., Tsuchida, K., Wells, M.A., 1988. Effect of dietary lipid content on lipid transport and storage during larval development ofManduca Sexta. Insect Biochem. 18, 211– 214.
Christensen, J., D’Alessio, C., Arighi, C., Caramelo, J., Florin-Christensen, M., Delfino, J.M., 1998. Micellar lipoproteins as the possible storage and translocation form of intracellular diacylgly-cerol. Biochem. Biophys. Res. Comm. 243, 669–673.
Folch, J.M., Lees, M., Sloane Stanley, G.H., 1957. A simple method for isolation and purification of total lipids from animal tissues. J. Biol. Chem. 226, 497–509.
Henderson, R.J., Tocher, R.D., 1992. Thin-layer chromatography in lipids analysis. In: Hamilton, R.J., Hamilton, S. (Eds.), Lipid Analysis, a Practical Approach. Oxford University Press Inc, New York, pp. 65–111.
Hoffman, A.G.D., Downer, R.G.H., 1979. End product specificity of triacylglycerol lipases from intestine, fat body, muscle and hemo-lymph of the American cockroach,Periplaneta americana. L. Lip-ids 14, 893–899.
Komnick, H., Kukulies, J., Bongers, J., Fischer, W., 1984. Absorption of dietary triacylglycerol by lipolysis and lipid resynthesis in the mesenteron of larvalAeshna cyanea, Insecta, Odonata. Protoplasma 123, 57–69.
Law, J.H., Wells, M.A., 1989. Insects as biochemical models. J. Biol. Chem. 264, 16335–16338.
Law, J.H., Ribeiro, J.M.C., Wells, M.A., 1992. Biochemical insights derived from insect diversity. Ann. Rev. Biochem. 61, 87–111. Male, K.B., Storey, K.B., 1981. Enzyme activities and isozyme
compo-sition of triglyceride, diglyceride and monoglyceride lipases in Per-iplaneta americana,Locusta migratoriaandPolia adjuncta. Insect Biochem. 11, 423–427.
Paris, R., Clement, G., 1986. Biosynthese de triglycerides a partir de 2–monopalmitine doublement marquee dans la muqueuse intestin-ale de rat. Biochim. Biophys. Acta 152, 63–74.
Pinter, J.K., Hayashi, J.A., Watson, J.A., 1967. Enzymatic assay of glycerol, dihydroxyacetone and glyceraldehydes. Arch. Biochem. Biophys. 121, 404–414.
Possmayer, E., Scherphof, G.L., Dubbelman, T.M.A.R., Van Golde, L.M.G., Van Deenen, L.L.M., 1968. Positional specificity of satu-rated and unsatusatu-rated fatty acids in phosphatidic acid from rat liver. Biochim. Biophys. Acta 176, 95–110.
Prasad, S.V., Fernando-Warnakulasuriya, G.P.P., Sumida, M., Law, J.H., Wells, M.A., 1986. Lipoprotein biosynthesis in the larvae of the Tobacco hornworm, Manduca sexta. J. Biol. Chem. 261, 17174–17176.
Shapiro, J.P., Law, J.H., Wells, M.A., 1988. Lipid transport in insects. Ann. Rev. Entomol. 33, 297–318.
Skipski, V.P., Barclay, N., 1969. Thin-layer chromatography of lipids. Meth. Enzymol. 14, 530–611.
Smith, A.F., Tsuchida, K., Hanneman, E., Suzuki, T., Wells, M.A., 1992. Isolation, characterization, and cDNA sequence of two fatty acid-binding proteins from the midgut ofManduca sextalarvae. J. Biol. Chem. 267, 380–384.
Stahl, A., Hirsch, D.J., Gimeno, R.E., Punreddy, S., Ge, P., Watson, N., Patel, S., Kotler, M., Raimondi, A., Tartaglia, L.A., Lodish, H.F., 1999. Identification of the major intestinal fatty acid transport protein. Molecular Cell 4, 299–308.
Soulages, J.L., Wells, M.A., 1994. Lipophorin: the structure of an insect lipoprotein and its role in lipid transport in insects. Adv. Prot. Chem. 45, 371–415.
Tsuchida, K., Wells, M.A., 1988. Digestion, absorption, transport and storage of fat during the last larval stadium of Manduca sexta. Changes in the role of lipophorin in the delivering of dietary lipid to the fat body. Insect Biochem. 18, 263–268.
Turunen, S., 1993. Metabolic pathways in the midgut epithelium of
Pieris brassicaeduring carbohydrate and lipid assimilation. Insect Biochem. Molec. Biol. 23, 681–689.
Turunen, S., Crailsheim, K., 1996. Lipid and sugar absorption. In: Lehane, M.J., Billingsley, P.F. (Eds.), Biology of Insect Midgut. Chapman and Hall, London, pp. 293–320.
Weintrab, H., Tietz, A., 1973. Tryglyceride digestion and absorption in the locust,Locusta migratoria. Biochem. Biophys. Acta 306, 31–41.
Weintrab, H., Tietz, A., 1978. Lipid absorption by isolated intestinal preparations. Insect Biochem. 8, 267–274.
![Fig. 1.Time course of the distribution of the label among lipid fractions from midgut lumenal content (A), midgut tissue (B) and hemolymph(C) after insects were fed with [9,10–3H]–oleic acid labeled triolein](https://thumb-ap.123doks.com/thumbv2/123dok/3119859.1379177/4.598.90.502.69.383/distribution-fractions-lumenal-content-hemolymph-insects-labeled-triolein.webp)