1. Introduction
Biodiesel has gained importance in the recent past year as a renewable fuel. The environmental issues concerned with the exhaust gases emission by the usage of fossil fuels also encourage the us-age of biodiesel which has proved to be eco-friendly far more than fossil fuels. Biodiesel is a mixture of mono-alkyl esters obtained from vegetable oils like soyabean oil, jatropha oil, rapeseed oil, palm oil, sunflower oil, corn oil, peanut oil, canola oil and cottonseed oil. The direct usage of vegetable oils as biodiesel is possible by blending it with conven-tional diesel fuels in a suitable ratio. But direct usage of these triglyceric esters (oils) is unsatisfac-tory and impractical for long term usages in the
Biodiesel Production from Vegetable Oil over Plasma Reactor:
Optimization of Biodiesel Yield using Response Surface Methodology
Istadi
1) *, Didi Dwi Anggoro
1), Putut Marwoto
2), Suherman
1), Bambang Tri
Nugroho
1)1) Department of Chemical Engineering, Diponegoro University, Jl. Prof. H. Sudharto, SH.,
Semarang, 50239 Indonesia
2) Department of Physics, FMIPA, Universitas Negeri Semarang, Kampus Sekaran Gunung
Pati, Semarang, Indonesia
* Corresponding Author.
E-mail address: [email protected] (Istadi)
Bulletin of Chemical Reaction Engineering & Catalysis, 4(1), 2009, 23-31
Received: 10 August 2009; Revised: 5th September 2009; Accepted: 12th October 2009
Abstract
Biodiesel production has received considerable attention in the recent past as a renewable fuel. The produc-tion of biodiesel by convenproduc-tional transesterificaproduc-tion process employs alkali or acid catalyst and has been industrially accepted for its high conversion and reaction rates. However for alkali catalyst, there may be risk of free acid or water contamination and soap formation is likely to take place which makes the separa-tion process difficult. Although yield is high, the acids, being corrosive, may cause damage to the equipment and the reaction rate was also observed to be low. This research focuses on empirical modeling and optimi-zation for the biodiesel production over plasma reactor. The plasma reactor technology is more promising than the conventional catalytic processes due to the reducing reaction time and easy in product separation. © 2009 BCREC. All rights reserved.
.
Keywords: biodiesel; plasma reactor; optimization; response surface methodology; central composite design
available diesel engines due to high viscosity, acid contamination, free fatty acid formation resulting in gum formation by oxidation and polymerization and carbon deposition. Hence vegetables oils are processed so as to acquire properties (viscosity and volatility) similar to that of fossil fuels and the processed fuel can be directly used in the diesel engines available. Three processing techniques are mainly used to convert vegetable oils to fuels form, they are pyrolysis, microemulsification and trans-esterification [1-4].
is a mixture of mono-alkyl esters of higher fatty acids. Transesterification is the alcoholysis of triglyceric esters resulting in a mixture of mono-alkyl esters and glycerol. The transesterification process can be done in a number of ways such as using an alkali catalyst, acid catalyst, biocatalyst, heterogeneous catalyst or using alcohols in their supercritical state. In the alkali process, sodium hydroxide (NaOH) or potassium hydroxide (KOH) is used as a catalyst along with methanol or etha-nol. This process is the most efficient and least corrosive of all the processes and the reaction rate is reasonably high even at a low temperature of 60 oC. There may be risk of free acid or water
con-tamination and soap formation is likely to take place which makes the separation process diffi-cult [1,2,5]. The second conventional way of pro-ducing biodiesel is using an acid catalyst instead of a base. Any mineral acid can be used to cata-lyze the process; the most commonly used acids are sulfuric acid and sulfonic acid. Although yield is high, the acids, being corrosive, may cause damage to the equipment and the reaction rate was also observed to be low [2].
A few published works on laboratory produc-tion and testing of biodiesel producproduc-tions as alter-native fuel have produced promising results [1-5]. Optimization of process parameters has also been conducted by previous researchers but focuses on the conventional transesterification process [6]. However until now, production of biodiesel from vegetable oil using plasma reactor technology has not been explored in the literatures. The plasma reactor technology is expected to reduce the reac-tion time considerably due to high energetic elec-trons role [7-8] and makes the separation proc-esses to be easy due to no glycerol formation dur-ing the processes. The high energetic electrons were expected to replace the conventional chemi-cal catalyst during the transesterification reac-tions. The review on design and principles of plasma reactor as a chemical reactor is explored in literature [7].
The purpose of this paper is to study the opti-mization of process parameters in biodiesel pro-duction over plasma reactor which maximizes the biodiesel product yield and minimizes the acid number of biodiesel. The optimization was done using response surface methodology (RSM). In the RSM method, a Central Composite Design (CCD) was used to design the experimental design to vary the independent variables. The adequacy of the proposed model was checked with the analysis of variance (ANOVA) using Fisher F-test.
2. Materials and Method
2.1. Materials and Plasma Reactor Configura-tion
The materials used in this research are: palm oil (Sania brand), Methanol (MERCK), KOH (MERCK), and ethanol (MERCK). The transesteri-fication reaction is conducted in a plasma reactor. The plasma reactor consists of a DC High Voltage (HV) source and a Plasma Reactor (corona type). In the high voltage source, the AC source regulator was used to control the input voltage. The voltage applied to the reactor was varied according to the design of experiment within the range of 400 to 1200 kV which is dependent of the HV source capa-bility. The reactor installation was designed for batch and continuous processes.
The palm oil and the methanol with the cer-tain volume ratio (oil/methanol ratio) were flowed to a mixing tank. The mixed reactants were stirred and heated up to temperature of 65-70 oC. The hot
mixed fluid was then flowed to the plasma reactor. The high voltage generator was then charged to the plasma reactor through a high voltage elec-trode and a ground elecelec-trode for certain charging time which is dependent of the design of experi-ment. After reaction was finished, the product was flowed to the settler (cone settler) to separate the unreacted methanol from biodiesel product. The biodiesel product was then characterized its prop-erties, i.e. density (ASTM D 1298), viscosity (ASTM D445), acid number (ASTM D 664), and chemical composition (GC-MS). The GC-MS (SHIMADZU QP2010S equipped with RTX-5 MS column) analy-sis was applied to identify the chemical composi-tion of biodiesel product.
2.2. Experimental Design and Method of Analysis
2.2.1. Central Composite Orthogonal Design
A central composite orthogonal design (CCOD) for three factors was employed for experimental design [9]. The value of ǂ for orthogonality depends on the number of points in the factorial portion of the design which is given in Equation (1) [9-10].
where nc is the number of cube points in the de-sign, ns is the number of star points, and no is the number of center points. In this experimental de-Bulletin of Chemical Reaction Engineering & Catalysis, 4(1), 2009, 24
(
)
[
]
(
)
1/4c 2 2 / 1 c 2 / 1 o s
c
n
n
n
.n
/
4
n
+
+
−
=
sign, the center point was repeated four times so that there are 18 experimental runs (8 cube points, 6 star points, and 4 center points).
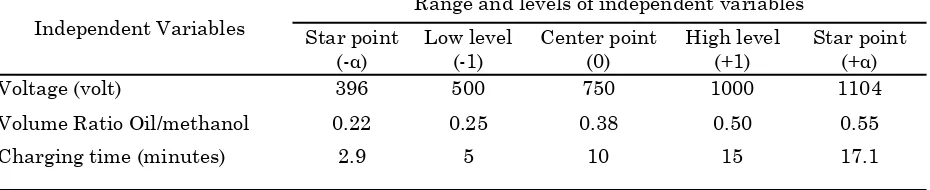
Three independent variables or factors, namely, voltage applied (volt), volume ratio of oil/ methanol, and charging time (minutes), were se-lected as controlled factors. The ranges of inde-pendent variables were chosen based on the condi-tions from the variables screened prior to optimiza-tion. The ranges and levels used in the experimen-tal work are given in Table 1 in which X1 denotes
voltage applied (volt), and X2 denotes volume ratio
of oil/methanol, and X3 denotes charging time
(minutes). In the experimental design, all variables are coded for statistical calculation according to Equation (2) below [9-10]:
where xi is the dimensionless coded value of the ith
variable, Xi is the natural value of the ith variable,
Xmax and Xmin are the highest and the lowest limit
of the ith variable, respectively.
The responses and the corresponding factors are modeled and optimized using the response sur-face methodology (RSM) [9]. The RSM is a tech-nique consisting of: (a) designing of experiments to provide adequate and reliable measurements of the response, (b) developing a mathematical model having the best fit to the data obtained from the experimental design, and (c) determining the opti-mal value of the independent variables that pro-duces maximum or minimum value of the re-sponse. In this paper, the design of experiment and the response surface analysis were employed by utilizing STATISTICA version 6 software (StatSoft Inc., Tulsa, USA).
2.2.2. Model Fitting and Statistical Analysis
A quadratic polynomial equation was devel-oped to predict the response as a function of inde-pendent variables and their interactions [9-10]. In general, the response for the quadratic polynomials is described in Equation (3). In this equation, Y is the predicted response, ǃo is the intercept
coeffi-cient, ǃj are the linear terms, ǃjj are the squared
terms, ǃij are the interaction terms, and Xi and Xj
represent the uncoded of the independent vari-ables. For each experimental factor the variance was partitioned into components, linear, quadratic and interaction, in order to asses the adequacy of the second order polynomial function and the rela-tive importance or significance of the terms.
Three-dimensional response surfaces and con-tour plots were used for facilitating a straightfor-ward examination of the influence of experimental variables on the responses. The coefficients of the models for the three responses were estimated with multiple regression analysis. The fit quality of the models was judged from their coefficients of correlation and determination. The adequacy of each model was checked with the analysis of vari-ance (ANOVA) using Fisher F-test [9-10]. The sig-nificance of the equation parameters for each re-sponse was assessed by p-value and Student’s t-test. The significance test of regression is at-tempted to determine the relationship between the response variable and a subset of the independent variables.
The steepest ascent method is used by the RSM to search for an optimal condition in which each response achieved a maximum value. The path of the steepest ascent is the direction such Bulletin of Chemical Reaction Engineering & Catalysis, 4(1), 2009, 25
(
)
[
]
min max
min max
2
X
X
X
X
X
x
ii
−
+
−
=
α
(2)∑
∑
∑
< =
=
+
+
+
=
j i
j i ij 3
1 2 j jj 3
1 j
j j
o
X
X
X
X
Y
j
β
β
β
β
(3)Table 1: Range and levels of independent variables for biodiesel yield optimization
Independent Variables
Range and levels of independent variables Star point
(-α)
Low level (-1)
Center point (0)
High level (+1)
Star point (+α)
Voltage (volt) 396 500 750 1000 1104
Volume Ratio Oil/methanol 0.22 0.25 0.38 0.50 0.55
that the response value increases most rapidly. The independent variables are varied in the direc-tion of increasing response until the response reaches its maximum. The increment or path of steepest ascent is directly proportional to the signs and magnitudes of the regression coeffi-cients in the fitted model. From the models, it is possible to obtain the optimal independent vari-ables that maximize a specified objective function.
3. Results and Discussion
3.1. Optimization of Biodiesel Product Yield
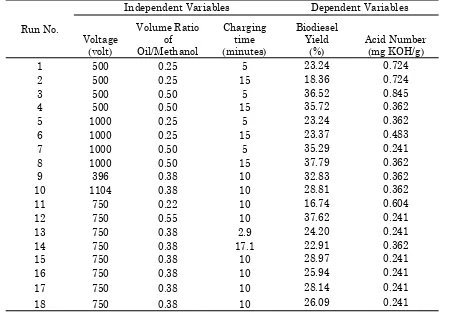
The experimental design matrix and the results of plasma reactor testing are presented in Table 2 consisting of 18 sets of coded conditions expressed in the natural values. The sequence of experiment was randomized in order to minimize the effects of uncontrolled factors. Objective of this section is to determine the optimal values of
applied voltage (X1), volume ratio of oil/methanol
(X2), and cracking time (-X2) such that a maximum
biodiesel product yield is achieved. The three fac-tors should be optimized simultaneously in order to include interaction effect among the variables. The experimental runs were based on the experimental design matrix shown in Table 2.
Coefficients of the empirical models built in Equation (3) are estimated using multiple regres-sion analysis technique. The empirical mathemati-cal model of the biodiesel product yield (Y1) is
pre-sented in Equation (4).
The appropriateness of the models is judged from the determination coefficient, R2, which
re-veals a total variation of the observed values of activity about its mean [9-11]. In this fitting, the regression coefficients are estimated about 0.96. The R2 value means a good agreement between the
experimental and predicted values of the fitted model. It implies that 96 % of the total variation in the response is justified by the model. The correla-Bulletin of Chemical Reaction Engineering & Catalysis, 4(1), 2009, 26
Table 2: Experimental design matrix and results for biodiesel production using plasma reactor
Run No.
Independent Variables Dependent Variables
Voltage (volt) Volume Ratio of Oil/Methanol Charging time (minutes) Biodiesel Yield (%) Acid Number (mg KOH/g)
1 500 0.25 5 23.24 0.724
2 500 0.25 15 18.36 0.724
3 500 0.50 5 36.52 0.845
4 500 0.50 15 35.72 0.362
5 1000 0.25 5 23.24 0.362
6 1000 0.25 15 23.37 0.483
7 1000 0.50 5 35.29 0.241
8 1000 0.50 15 37.79 0.362
9 396 0.38 10 32.83 0.362
10 1104 0.38 10 28.81 0.362
11 750 0.22 10 16.74 0.604
12 750 0.55 10 37.62 0.241
13 750 0.38 2.9 24.20 0.241
14 750 0.38 17.1 22.91 0.362
15 750 0.38 10 28.97 0.241
16 750 0.38 10 25.94 0.241
17 750 0.38 10 28.14 0.241
18 750 0.38 10 26.09 0.241
tion between the experimental and the predicted values is also acceptable
The adequacy of the model was checked with the analysis of variance (ANOVA) as presented in Table 3. The calculated F-value should be greater than the tabulated value as the model to be consid-ered good fitting. In fact, the F-value corresponding to the biodiesel product yield response is 23.49 and exceeds the tabulated F-value (F0.05,9,8 = 3.39) as
presented in Table 3. The F-value shows a statisti-cally significant regression at 95 % confidence level. In this case, the null hypothesis (H0) is
re-jected at 5 % level of significance based on the marked F-value [9-10] implies that at least one of the independent variables contributes significantly to the model. Comparison between the predicted and the observed biodiesel product yield is pre-sented in Figure 1. From the figure, it is shown that the the predicted value of biodiesel product yield closes to the observed values.
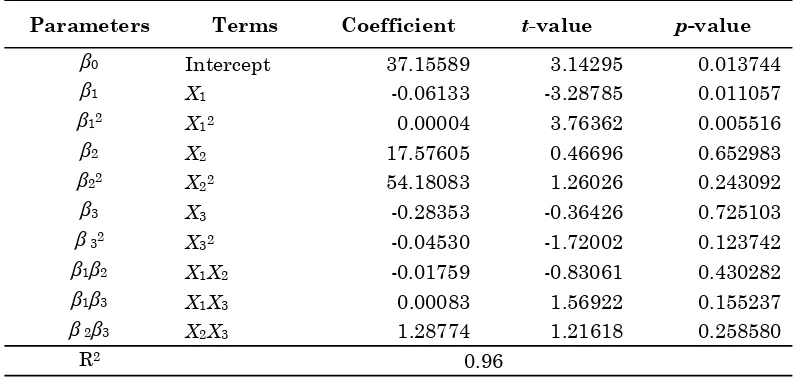
The results in Table 4 explain the multiple regression results and the significance of the model
regression coefficients with respect to the biodiesel product yield. The p- and Student’s t-values are used to check the significance of each term at a specified level of significance [9]. The p-value is defined as the smallest level of significance that would reject the null hypothesis, H0. The smaller
the magnitude of the p-value the more significant is the corresponding coefficient and contributes largely towards the response variable. From the table, the quadratic of applied voltage term (X12)
has the largest effect on the biodiesel product yield at the 99 % confidence level as indicated by the lowest p-value (<0.01) and the highest absolute t -value (3.764). Next, the linear term of applied volt-age (X1) shows a substantial significant effect at 95
% confidence level (p-value < 0.05) followed by the effect of quadratic charging time (X32) and
interac-tion between charging time and applied voltage term (X1X3). From the p- and t- values studies, it
can be implied that the empirical model can be used to simulate the biodiesel product yield as function of the three process parameters.
Bulletin of Chemical Reaction Engineering & Catalysis, 4(1), 2009, 27
Table 3: ANOVA study on the biodiesel product yield model
Note: SS : Sum of Square; df : degree of freedom; MS : mean square; and Ftable (0.05, 9, 8) = 3.39
Factor SS df MS F-value
SS Regression 708.2721 9 78.6969 23.4901
SS Error 28.0438 8 3.3502
SS total 733.2000 17
R2 0.96
Table 4: Regression coefficients in the biodiesel yield empirical model and their significance effect
Parameters Terms Coefficient t-value p-value
ǃ0 Intercept 37.15589 3.14295 0.013744
ǃ1 X1 -0.06133 -3.28785 0.011057
ǃ12 X12 0.00004 3.76362 0.005516
ǃ2 X2 17.57605 0.46696 0.652983
ǃ22 X22 54.18083 1.26026 0.243092
ǃ3 X3 -0.28353 -0.36426 0.725103
ǃ 32 X32 -0.04530 -1.72002 0.123742
ǃ1ǃ2 X1X2 -0.01759 -0.83061 0.430282
ǃ1ǃ3 X1X3 0.00083 1.56922 0.155237
ǃ 2ǃ3 X2X3 1.28774 1.21618 0.258580
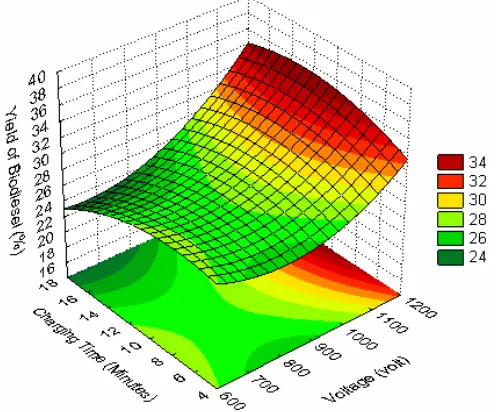
Three-dimensional surface plot of the bio-diesel product yield model shown in Figures 2 and 3 represent estimated response over the process parameters (applied voltage, volume ratio of oil/ methanol, and charging time). Increasing the voltage applied to electrode of the plasma reactor leads to higher biodiesel product yield. The higher the applied voltage, the higher the electrons flows from the high voltage electrode to the ground elec-trode. The higher the energetic electrons lead to stronger the cracking and the recombination of chemical bonds during the reaction as repre-sented in Equation (5) below:
Vegetable Oil + Metanol + High Voltage Elec-tricity (electrons) ==> Methyl Ester + H2
(5)
The reaction as written in Equation (5) is sug-gested from the fact that there is no soap formation during the reaction. The gas was produced during the transesterification reaction over the plasma reactor.
The applied voltage gives more significant effect than the charging time and volume ratio of reactants. This fact implies that the energetic elec-trons have dominant role during the reaction. However, the reaction should be controlled by regulating their power in order to prevent exces-Bulletin of Chemical Reaction Engineering & Catalysis, 4(1), 2009, 28
11785 . 3 09499
. 0 00007
. 0 00006
. 0 06666 . 0
00235 . 0 57106 . 5 7446
. 7 00329 . 0 000001
. 0
3 2 3
1 2
1 3
2 3 2
2 2 1
2 1 1
+ −
+ −
−
+ −
+ −
=
X X X
X X
X X
X X
X X
X
Y (6)
Table 5: ANOVA study on the empirical model of the acid number of biodiesel product
Note: SS : Sum of Square; df : degree of freedom; MS : mean square; Ftable (0.05, 9, 8) = 3.39
Factors SS df MS F-value
SS Regression 0.5040 9 0.0560 3.42
SS error 0.1312 8 0.0164
SS total 0.6420 17
R2 0.81
Figure 1: Comparison of predicted and observed
sive cracking of chemical bond in methyl esters. The charging time should be controlled to be as short as possible, particularly at higher applied voltage. The shorter charging time could reduce the reaction time. The shorter reaction time is ex-pected in order to be more efficient process than the conventional transesterification process (more than 60 minutes) [1-5]. The other advantages of plasma reactor technology for biodiesel production are easy in separation or purification process due to no soap and glycerol formations during the plasma reaction.
The optimum operating conditions are achieved at higher applied voltage (about 1100 volt), mild charging time (about 11 minutes), and certain oil/methanol ratio to obtain a maximum biodiesel product yield of about 35%. However, the oil/methanol ratio should be studied so far to get
the optimal conditions. The applied voltage ranges are suggested to be higher than 1 kV up to 8 kV to achieve the higher energetic electrons. The applied voltage should be correlated with charging time parameters to achieve an efficient process
3.2. Minimization of Acid Number of Biodiesel Product
The experimental design matrix and the re-sults of plasma reactor testing are presented in Table 2. Objective of this section is to determine the optimum values of applied voltage (X1), volume
ratio of oil/methanol (X2), and cracking time (-X2)
such that a minimum acid number of biodiesel product is achieved. The three factors should be Bulletin of Chemical Reaction Engineering & Catalysis, 4(1), 2009, 29
Table 6: GC-MS analysis results for biodiesel product characterization
Retention time (minutes) Chemical identification in the biodiesel prod-uct
Chemical Compositions (wt%)
21.917 Methyl palmitate (C17H34O2) 19.46
23.008 Palmitic Acid (C16H32O2) 19.73
25.417 Methyl Oleate (C19H36O2) 17.45
26.450 Oleic Acid (C18H34O2) 12.39
33.275 Dioctyl phthalate (C24H38O4) 21.67
37.658 Squalene (C30H50) 9.29
Figure 3: Effect of applied voltage and volume ratio of oil/methanol on the biodiesel product yield
optimized simultaneously in order to include inter-action effect among the variables.
Coefficients of the empirical models are esti-mated using multiple regression analysis tech-nique. The empirical mathematical model of the acid number of biodiesel product (Y2) is presented
in Equation (6). In this fitting, the regression coef-ficients (R2) are estimated about 0.81. It implies
that 81 % of the total variation in the response is justified by the model. The correlation between the experimental and the predicted values is also ac-ceptable
The adequacy of the model was checked with the analysis of variance (ANOVA) as presented in Table 5. The F-value corresponding to the acid number of biodiesel product is 3.42 and still ex-ceeds the tabulated F-value (F0.05,9,8 = 3.39) as
pre-sented in Table 5. The F-value shows a statistically significant regression at 95 % confidence level. In this case, the null hypothesis (H0) is rejected at 5 %
level of significance based on the marked F-value [9-10] implies that at least one of the independent variables contributes significantly to the model.
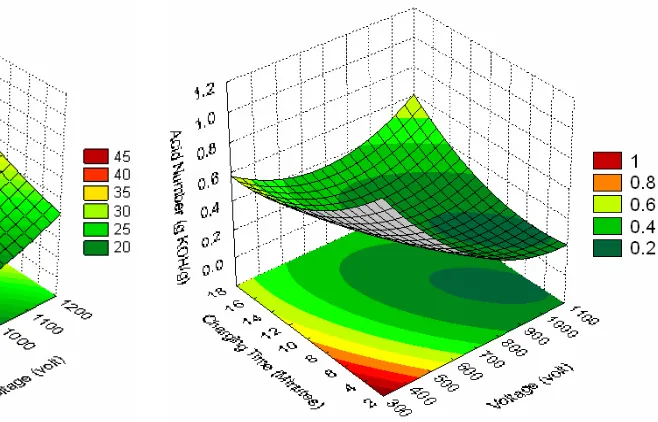
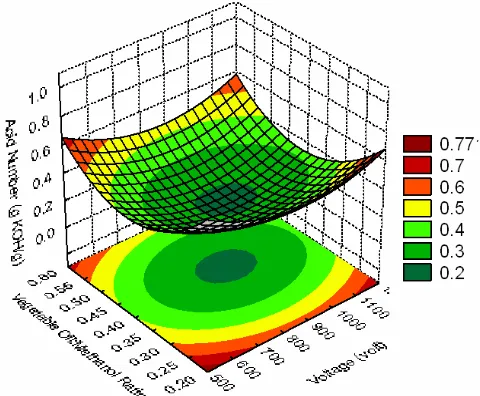
Three-dimensional surface plot of the acid number of biodiesel product is shown in Figures 4 to 5 representing an estimated response over the process parameters (applied voltage, volume ratio of oil/methanol, and charging time). Increasing the voltage to the high voltage electrode of the plasma reactor leads to lower acid number of biodiesel product. However, charging time only affects slightly on the acid number. The lower the ener-getic electrons lead to lower the cracking power.
Therefore, the recombination of chemical bonds to form methyl esters is not completely finished.
The applied voltage gives more significant effect than the charging time and volume ratio of reactants. This fact implies that the energetic elec-trons have dominant role during the reaction. However, the reaction should be controlled by regulating their power in order to prevent exces-sive cracking of chemical bond in methyl esters. The charging time should be controlled to be as short as possible, particularly at higher applied voltage. The shorter charging time could reduce the reaction time. The shorter reaction time is ex-pected in order to be more efficient process than the conventional transesterification process (more than 60 minutes) [1-5].
The optimum operating conditions are achieved at higher applied voltage (about 948 volt), mild charging time (about 11 minutes), and oil/ methanol ratio (0.4) to obtain a minimum acid number of biodiesel product of about 17%. How-ever, the oil/methanol ratio should be studied so far to get the optimal conditions. The applied volt-age ranges are suggested to be higher than 1 kV up to 8 kV to achieve the higher energetic electrons. The applied voltage should be correlated with charging time parameters to achieve an efficient process.
3.3. Biodiesel Product Characterizations
The hypothesis of methyl ester formation during the transesterification of vegetable oil and methanol over the plasma reactor is proven by chemical identification of biodiesel product using Bulletin of Chemical Reaction Engineering & Catalysis, 4(1), 2009, 30
Figure 5: Effect of applied voltage and volume ra-tio of oil/methanol on the acid number of biodiesel product
GC-MS [12]. The GC-MS analysis result of the bio-diesel product is presented in Figure 6 and Table 6. From the figure and the table, it is shown that the methyl ester (methyl palmitate, methyl oleate, and Dioctyl phthalate) were formed during the plasma reaction. This fact proofs the proposed reaction in Equation (5). Another important fact is that the interaction among applied voltage, charging time, and volume ratio of reactant is crucial for methyl ester formation. The energetic electrons have role as a catalyst giving a reaction path which having lower activation energy. The other characteristics of the biodiesel product through this technology are density of about 0.87 kg/m3 (ASTM D1298), acid
number of about 0.40 mg KOH/g (ASTM D664), and viscosity of about 4.9 mm2/s (ASTM D445)
[13-14]. However, the complete biodiesel product char-acterizations could not be listed here.
4. Conclusions
Biodiesel production from vegetable oil through plasma technology has been developed. The biodiesel product (methyl esters) can be pro-duced without conventional chemical catalyst. The empirical models for prediction of biodiesel product yield and acid number over plasma reactor were produced. The optimum operating conditions are achieved at higher applied voltage (about 948 volt), mild charging time (about 11 minutes), and oil/ methanol ratio (0.4) to obtain a minimum acid number of biodiesel product of about 17%. The ap-plied voltage ranges are suggested to be higher than 1 kV up to 8 kV to achieve the higher ener-getic electrons. The applied voltage should be cor-related with charging time parameters to achieve an efficient process. The plasma reactor technology is more promising than the conventional catalytic processes due to the reducing reaction time and easy in product separation. However, this research is still a preliminary research which should be more explored intensively .
Acknowledgment
The authors would like to express their sincere gratitudes to the Directorate General of Higher Education of Republic of Indonesia for the financial support received under the project of HIBAH BER-SAING GRANT YEAR 2008
REFERENCES
[1] Ma, F., Hanna, M.A. 1999, Bioresour. Tech-nol., 70: 1–15
[2] Ranganathan, S.V., Narasimhan, S.L., Mut-hukumar, K. 2008, Bioresource Technology, 99: 3975–3981
[3] Marchetti, J.M., Miguel, V.U., Errazu, A.F. 2006, Renewable and Sustainable Energy Reviews, 11:1300-1311
[4] Meher, L.C., Sagar, D.V., Naik, S.N. 2006,
Renewable and Sustainable Energy Reviews, 10:248–268
[5] Fukuda, H., Kondo, A., Noda, H. 2001, J. Biosci. Bioeng., 92:405–416.
[6] Leung, D.Y.C., Guo, Y. 2006, Fuel Proc. Technol., 87: 883-890
[7] Istadi and Amin, N.A.S. 2006, Fuel, 85: 577-592
[8] Lieberman, M.A. and Lichtenberg, A.J. Prin-ciples of Plasma Discharges and Materials Processing. New York: John Wiley & Sons, Inc., 1994
[9] D.C. Montgomery. Design and Analysis of Experiments, New York: John Wiley & Sons, 2001
[10] Cornell, J.A. How to Apply Response Surface Methodology, Wisconsin: American Society for Quality Control, 1990
[11] Istadi and Amin, N.A.S. 2006, Fuel Proc. Technol., 87: 449-459
[12] Knothe, G., Gerpen, J.V., Krahl, J. The Bio-diesel Handbook, Illinois: AOCS Press, 2005 [13] Mahajan, S., Konar, S.K., and Boocock,
D.G.B., 2006, J. Am. Oil Chem. Soc., 83: 567–570
[14] Wang, H., Tang, H., Wilson, J., Salley, S.O., Simon , K. Y., 2008, J. Am. Oil Chem. Soc., 85:1083–1086.