Cheng Cheng is a Ph.D. candidate in economics at Texas A&M University. Mark Hoekstra is an associate professor of economics at Texas A&M University. The authors wish to thank Scott Cunningham, Steve Puller, Thomas Lemieux, John Winters, Joanna Lahey, Erdal Tekin, Chandler McClellan, Jonathan Meer, seminar participants at the 2012 Annual Meeting of the Southern Economic Association, the 2012 Stata Texas Empirical Micro Conference, and two anonymous referees for providing helpful comments and suggestions. They thank Mark Seaman for providing excellent research assistance. The data used in this article can be obtained beginning January 2014 through December 2016 from Mark Hoekstra, 3087 Allen Building, 4228 TAMU, College Station, TX 77843 (mhoekstra@econmail.tamu.edu).
[Submitted December 2012; accepted December 2012]
SSN 022 166X E ISSN 1548 8004 8 2013 3 by the Board of Regents of the University of Wisconsin System
T H E J O U R N A L O F H U M A N R E S O U R C E S • 48 • 3
Does Strengthening Self- Defense Law
Deter Crime or Escalate Violence?
Evidence from Expansions to
Castle Doctrine
Cheng Cheng
Mark Hoekstra
A B S T R A C T
From 2000 to 2010, more than 20 states passed so- called “Castle Doctrine” or “stand your ground” laws. These laws expand the legal justifi cation for the use of lethal force in self- defense, thereby lowering the expected cost of using lethal force and increasing the expected cost of committing violent crime. This paper exploits the within- state variation in self- defense law to examine their effect on homicides and violent crime. Results indicate the laws do not deter burglary, robbery, or aggravated assault. In contrast, they lead to a statistically signifi cant 8 percent net increase in the number of reported murders and nonnegligent manslaughters.
I. Introduction
A long- standing principle of English common law, from which most U.S. self- defense law is derived, is that one has a “duty to retreat” before using lethal force against an assailant. The exception to this principle is when one is threatened by an intruder in one’s own home, as the home is one’s “castle.” In 2005, Florida became
the fi rst in a recent wave of states to pass laws that explicitly extend Castle Doctrine
by passing versions of “Castle Doctrine” or “stand- your- ground” laws. These laws
eliminate the duty to retreat from a list of specifi ed places, and frequently also remove
civil liability for those acting under the law and establish a presumption of reasonable fear for the individual claiming self- defense. For ease of exposition, we subsequently refer to these laws as Castle Doctrine laws.
These laws alter incentives in important ways. First, the laws reduce the expected cost of using lethal force. They lower the expected legal costs associated with defend-ing oneself against criminal and civil prosecution, as well as the probability that one
is ultimately found criminally or civilly liable for the death or injury infl icted. In
addition, the laws increase the expected cost of committing violent crime, as victims are more likely to respond by using lethal force. The passage of these laws may also increase the salience of the legal protections in place, which may itself affect the deci-sion of whether to use lethal force or commit violent crime. The purpose of our paper is to examine empirically whether people respond to these changes, and thus whether the laws lead to an increase in homicide, or to deterrence of crime more generally.
In doing so, our paper also informs a vigorous policy debate over these laws. Pro-ponents argue these statutes provide law- abiding citizens with additional necessary protections from civil and criminal liability. They argue that since the decision to use
lethal force is a split- second one that is made under signifi cant stress, the threatened
individual should be given additional legal leeway. Critics argue that existing self-
defense law is suffi cient to protect law- abiding citizens, and extending legal
protec-tions will unnecessarily escalate violence. These potential consequences have been of
particular interest recently following some highly publicized cases.1 In examining the
empirical consequences of these laws, this study informs the debate over their costs
and benefi ts.
We use state- level crime data from 2000 to 2010 from the FBI Uniform Crime Reports to empirically analyze the effects of Castle Doctrine laws on two types of outcomes. First, we examine whether these laws deter crimes such as burglary, rob-bery, and aggravated assault. In doing so, we join a much larger literature on crimi-nal deterrence generally (for example, see Becker 1968; Ehrlich 1973; Di Tella and
Schargrodsky 2004; Donohue and Wolfers 2009). More specifi cally, however, we join
a smaller literature focused on whether unobserved victim precaution can deter crime. For example, Ayres and Levitt (1998) examine whether LoJack reduces overall motor vehicle thefts, while others have examined whether laws that make it easier to carry concealed weapons deter crime (Bronars and Lott 1998; Dezhbakhsh and Rubin 1998;
Lott and Mustard 1997; Ludwig 1998).2
We then examine whether lowering the expected cost of using lethal force results in
additional homicides, defi ned as the sum of murder and nonnegligent manslaughter.
1. The most publicized case is that of Trayvon Martin, an unarmed teenager who was shot and killed by a neighborhood watch volunteer (Alvarez 2012).
Hoekstra and Cheng 823
We also examine the effects of the laws on other outcomes in order to shed light on
why homicides are affected by the laws.
To distinguish the effect of the laws from confounding factors, we exploit the within- state variation in the adoption of laws to apply a difference- in- differences
identifi cation strategy. Intuitively, we compare the within- state changes in outcomes
of states that adopted laws to the within- state changes in nonadopting states over the
same time period. Moreover, we primarily identify effects by comparing changes in Castle Doctrine states to other states in the same region of the country by including
region- by- year fi xed effects. Thus, the crucial identifying assumption is that in the
absence of the Castle Doctrine laws, adopting states would have experienced changes in crime similar to nonadopting states in the same region of the country.
Our data allow us to test and relax this assumption in several ways. First, graphi-cal evidence and regression results show that the outcomes of the two groups did
not diverge in the years prior to adoption. In addition, we show that our fi ndings are
robust to the inclusion of time- varying covariates such as demographics, policing, economic conditions, and public assistance, as well as to the inclusion of contempo-raneous crime levels unaffected by Castle Doctrine laws that proxy for general crime trends. This suggests that other known determinants of crime rates were orthogonal to the within- state variation in Castle Doctrine laws. Along similar lines, we offer pla-cebo tests by showing that Castle Doctrine laws do not affect crimes that ought not be
deterred by the laws, such as vehicle theft and larceny. Failing to fi nd effects provides
further evidence that general crime trends were similar in adopting and nonadopting
states. Finally, we allow for state- specifi c linear time trends.
Results indicate that the prospect of facing additional self- defense does not deter
crime. Specifi cally, we fi nd no evidence of deterrence effects on burglary, robbery,
or aggravated assault. Moreover, our estimates are suffi ciently precise as to rule out
meaningful deterrence effects.
In contrast, we fi nd signifi cant evidence that the laws lead to more homicides.
Esti-mates indicate that the laws increase homicides by a statistically signifi cant 8 percent,
which translates into an additional 600 homicides per year across states that expanded
Castle Doctrine. The magnitude of this fi nding is similar to that reported in a recent
pa-per by McClellan and Tekin (2012), who examine these laws’ effect on fi rearm- related
homicide using death certifi cate data from Vital Statistics.3,4 We further show that this
divergence in homicide rates at the time of Castle Doctrine law enactment is larger than any divergence between the same groups of states at any time in the last 40 years, and that magnitudes of this size arise rarely by chance when randomly assigning
pla-3. One advantage of using FBI UCR data is that it allows us to assess both how the laws affect the use of lethal force and whether they deter violent crime. In addition, the nature of the UCR data enables us to measure all homicides rather than just those caused by fi rearms. The data also allow us to examine homicide subclassifi cations and relative changes in reported justifi able homicide from the SHR, along with assump-tions about the degree of underreporting, to address the issue of whether the additional homicides are legally justifi ed. The primary disadvantage of the UCR homicide data is that while the annual state- level data we use are regarded as accurate and there is no reason to believe that any total homicide reporting issue at any level should be systematically correlated with changes in Castle Doctrine law, the monthly data from Vital Statis-tics are more complete. However, we obtain nearly identical estimates to those reported when we exclude observations in the year in which the state adopted the law, indicating that this is not a problem.
cebo laws in similarly structured data sets covering the years prior to Castle Doctrine
expansion. In short, we fi nd compelling evidence that by lowering the expected costs
associated with using lethal force, Castle Doctrine laws induce more of it.
Finally, we perform several exercises to examine the possibility that the additional
reported criminal homicides induced by the laws were in fact legally justifi ed but were
misreported by police to the FBI. We conclude on the basis of these fi ndings that it is
unlikely, albeit not impossible, that all of the additional homicides were legally
justi-fi ed but were misreported by police as murder or nonnegligent manslaughter.5
Collectively, these fi ndings suggest that incentives do matter in one important sense:
lowering the threshold for the justifi ed use of lethal force results in more of it. On the
other hand, there is also a limit to the power of incentives, as criminals are apparently not deterred when victims are empowered to use lethal force to protect themselves.
These fi ndings also have signifi cant policy implications. The fi rst is that these laws
do not appear to offer any hidden spillover benefi ts to society at large in the form
of deterrence. On the other hand, the primary potential downside of the law is the increased number of homicides. Thus, our view is that any evaluation of these laws
ought to weigh the benefi ts of increased leeway and protections given to victims of
actual violent crime against the net increase in loss of life induced by the laws.
II. Castle Doctrine Law and Data
A. Castle Doctrine Law
The principle of “duty to retreat” originates from English common law, whereby one had to “retreat to the wall” and thus no longer be able to retreat safely before respond-ing to an attacker with deadly force (Vilos and Vilos 2010). The exception to this rule is if the attack is inside one’s home, or “castle,” in which case there is no longer a duty
to retreat. The duty to retreat, and the Castle Doctrine exception, remained infl uential
in state statute and (primarily) case law, though the case law in some states diverged
from the duty to retreat requirement over time.6 In 2005, a wave of states began
pass-5. Of course, there is also the issue of whether all legally justifi ed homicides under expanded Castle Doctrine are socially desirable, which is beyond the scope of this paper.
Hoekstra and Cheng 825
ing laws that explicitly put “Castle Doctrine” into state statute. More importantly, these laws also expanded Castle Doctrine by removing the duty to retreat from a list
of specifi ed places such as one’s vehicle, place of work, and in some cases, any place
one has a legal right to be. Nearly all of these laws also strengthened legal protections in other ways as well. Some laws added a presumption of reasonable fear of imminent serious injury or death, which shifts the burden of proof to the prosecutor to show
someone acted unreasonably.7 Similarly, many laws also grant immunity from civil
liability when using defensive force in a way justifi ed under law. Collectively, these
laws lower the cost of using lethal force to protect oneself, though they also lower the
cost of escalating violence in other confl icts.8
Our understanding is that the main rationale for these laws was to provide additional legal leeway to potential victims in self- defense situations, not to deter crime. Thus, there is little reason to believe that the enactment of these laws coincided with either other policies expected to affect crime or homicides, or with expectations about future
crime.9 Nevertheless, we devote considerable effort toward assessing whether the
es-timated effects we fi nd could be due to some other confounding factor(s), rather than
to the changes in law.
To determine if and when states passed Castle Doctrine laws, we searched news releases and other sources such as the Institute for Legislative Action of the National
Rifl e Association to determine whether a state appeared to have passed a law that
strengthened self- defense law these ways. Specifi cally, we coded the specifi c
attri-butes of each state statute found, and classifi ed whether the law i) removed the duty
to retreat from somewhere outside the home, ii) removed the duty to retreat from any place one has a legal right to be, iii) added a presumption of reasonable fear for the person using lethal force, and iv) removed civil liability for those acting under the
law. We then classifi ed a state as having a Castle Doctrine law if they remove the duty
to retreat in some place outside the home. Our goal in doing so was to create a list of states that expanded Castle Doctrine and generally passed meaningful changes to their
self- defense law that would be widely reported.10
Table 1 shows the states classifi ed as having enacted Castle Doctrine laws between
2000 and 2010. We classify 21 states as having passed Castle Doctrine laws, as each
7. For example, the law passed in Florida states that “a person is presumed to have held a reasonable fear of imminent peril of death or bodily injury to himself or herself or another when using defensive force that is intended or likely to cause death or bodily injury to another.”
8. These laws also typically state that the protections do not apply to those who are committing a crime at the time, or who instigated the confl ict.
9. For example, the National Rifl e Association (NRA) was a major proponent of these laws (Goode 2012). We are unaware of any statement by the NRA that suggests their support for the laws is due to a belief that the law will deter crime, or that the law is a necessary response to recent changes in violent crime. Rather, our understanding is that supporters view Castle Doctrine/stand- your- ground as an issue of individual and victim rights.
T
States that Expanded Castle Doctrine Between 2000 and 2010
State
Alabama 6/1/06 Yes Yes No Yes
Alaska 9/13/06 Yes No Yes Yes
Arizona 4/24/06 Yes Yes Yes Yes
Florida 10/1/05 Yes Yes Yes Yes
Georgia 7/1/06 Yes Yes No Yes
Indiana 7/1/06 Yes Yes No Yes
Kansas 5/25/06 Yes Yes No Yes
Kentucky 7/12/06 Yes Yes Yes Yes
Louisiana 8/15/06 Yes Yes Yes Yes
Michigan 10/1/06 Yes Yes No Yes
Mississippi 7/1/06 Yes Yes Yes Yes
Missouri 8/28/07 Yes No No Yes
Montana 4/27/09 Yes Yes Yes No
North Dakota 8/1/07 Yes No Yes Yes
Ohio 9/9/08 Yes No Yes Yes
Oklahoma 11/1/06 Yes Yes Yes Yes
South Carolina 6/9/06 Yes Yes Yes Yes
South Dakota 7/1/06 Yes Yes No No
Tennessee 5/22/07 Yes Yes Yes Yes
Texas 9/1/07 Yes Yes Yes Yes
Hoekstra and Cheng 827
of these states expanded Castle Doctrine protections to places outside the home.11
Of these, 17 states removed the duty to retreat in any place one has the legal right to be, 13 included a presumption of reasonable fear, and 18 explicitly removed civil liability. Our main analysis groups all of these laws together, and thus captures the average intent- to- treat effect of passing a law similar to those passed in these 21 states. However, since that approach is perhaps unnecessarily blunt, in appendix Table A1 we show results for different subgroups of these states. We note, however, that due to the high degree of collinearity and the potential for interaction effects, we do not attempt to distinguish between the effects caused by the different attributes of these laws.
B. Data
Outcome data come from the FBI Uniform Crime Reports (UCR) and cover all 50
states from 2000–10.12 Specifi cally, we use homicide, burglary, robbery, and
aggra-vated assault data from the offi cial UCR data published online by the FBI.13 In
addi-tion, for the other variables not available from the online UCR, we use data from the
FBI’s Master fi les (Return A and Supplemental Homicide Report).
We use these data to test whether making it easier for individuals to use lethal force in self- defense deters crime or increases homicide. For deterrence, we focus on three
criminal outcomes. The fi rst is burglary, which is defi ned as “the unlawful entry of a
structure to commit a felony or a theft” (FBI 2004). The second is robbery, defi ned as
“the taking or attempting to take anything of value from the care, custody, or control of a person or persons by force or threat of force or violence and/or by putting the victim in fear” (FBI 2004). Finally, we also examine aggravated assault, which the
FBI defi nes as “an unlawful attack by one person upon another for the purpose of
infl icting severe or aggravated bodily injury,” and is typically accompanied by the use
of a weapon (FBI 2004).14 In all cases, one might expect rational criminals to be less
likely to commit such crimes under expanded Castle Doctrine, as the increased scope
for the use of justifi able lethal force on the part of the victim raises the expected cost
to the criminal.
The homicide measure we use is total homicides, defi ned as the sum of murder and
nonnegligent manslaughter. We also look at murder separately to determine exactly how police are classifying the additional homicides.
11. To avoid confusion over which states are driving the within- state variation used in our study, we inten-tionally leave states off Table 1 if they had passed a law that expanded Castle Doctrine prior to 2000 or after 2010, which are outside our sample period.
12. There are relatively few cases of missing data. Data on whether robbery was committed with a gun were missing from 2000 to 2005 for Illinois. Justifi able homicide data were missing for Florida, so we requested and received those data directly from the Florida Department of Law Enforcement Offi ce.
An increase in criminal homicide could represent the escalation of violence by
criminals, the escalation of violence in otherwise nonlethal confl icts, or, possibly, an
increase in legally justifi ed homicide that is misreported as murder or nonnegligent
manslaughter.15 In order to shed light on that issue, we look at two other outcomes,
both of which measure the escalation of violence by criminals in response to Castle Doctrine. The ratio of robberies committed with a gun measures whether criminals respond by being more likely to carry and use weapons during the commission of a crime, as one might expect if they believe they will be faced with lethal force by the victim. We also look at felony- type and suspected felony- type murders, which also measure the escalation of violence by criminals. We expect to see increases in these outcomes if Castle Doctrine laws induce criminals to be more likely to carry and use deadly weapons during the commission of crimes.
In addition, we also ask whether the laws increase homicides that are reported to the
FBI as “justifi able homicides by private citizens,” which the FBI defi nes as “the killing
of a felon during the commission of a felony” (Uniform Crime Reporting Handbook
2004).16 The major disadvantage of these data is that they are widely believed to be
underreported; Kleck (1988) estimates that around one- fi fth of legally justifi ed
homi-cides are reported that way to the FBI. However, note that we use these data only to
look for evidence of relative changes in legally justifi ed homicide. We then use those
estimates, along with assumptions about the degree of underreporting, to determine if the entire increase in criminal homicides can be explained as (misreported) legally
justifi ed homicides.
The data also allow us to perform several placebo, or falsifi cation tests. Specifi cally,
we use data on the rate of larceny and motor vehicle theft to determine whether Castle
Doctrine laws appear to affect those crimes.17 In both cases we expect to fi nd no
ef-fects so long as the identifying assumptions of our difference- in- difference research design hold, which we discuss at length in the next section.
Finally, we have data on several time- varying control variables. Specifi cally, we
observe the number of full- time equivalent police per 100,000 state residents (Uniform Crime Reports 2000–10). We also include both contemporaneous and lagged measures of the number of persons incarcerated in state prison per 100,000 residents (Bureau of Justice Statistics Bulletin 2000–10). These variables capture the effects of deterrence and incapacitation caused by additional policing or incarceration. In addition, we have
15. The general possibility that disputes can escalate dramatically in environments perceived to be dangerous is discussed in O’Flaherty and Sethi (2010).
16. The Uniform Crime Reporting Handbook emphasizes that by defi nition, justifi able homicide occurs in conjunction with other offenses, and those other offenses must be reported. Additionally, the handbook gives examples of specifi c hypothetical events that would and would not qualify as justifi able homicide under the guidelines. An example given of an incident that would qualify as a justifi able homicide is “When a gunman entered a store and attempted to rob the proprietor, the storekeeper shot and killed the felon” (Uniform Crime Reporting Handbook 2004). An example of what would NOT qualify as a justifi able homicide is “While play-ing cards, two men got into an argument. The fi rst man attacked the second with a broken bottle. The second man pulled a gun and killed his attacker. The police arrested the shooter; he claimed self- defense” (Uniform Crime Reporting Handbook 2004). We note that under expanded Castle Doctrine, the hypothetical shooter may have been justifi ed as acting in self- defense, though again the reporting handbook explicitly states that this would not qualify as a justifi able homicide under the guidelines.
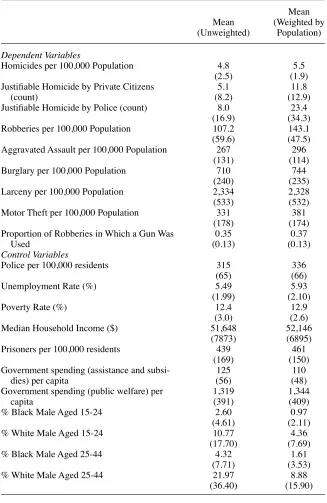
Table 2
Homicides per 100,000 Population 4.8 5.5
(2.5) (1.9)
Justifi able Homicide by Private Citizens
(count)
5.1 11.8
(8.2) (12.9)
Justifi able Homicide by Police (count) 8.0 23.4
(16.9) (34.3)
Robberies per 100,000 Population 107.2 143.1
(59.6) (47.5)
Aggravated Assault per 100,000 Population 267 296
(131) (114)
Burglary per 100,000 Population 710 744
(240) (235)
Larceny per 100,000 Population 2,334 2,328
(533) (532)
Motor Theft per 100,000 Population 331 381
(178) (174)
Proportion of Robberies in Which a Gun Was Used
0.35 0.37
(0.13) (0.13)
Control Variables
Police per 100,000 residents 315 336
(65) (66)
Unemployment Rate (%) 5.49 5.93
(1.99) (2.10)
Poverty Rate (%) 12.4 12.9
(3.0) (2.6)
Median Household Income ($) 51,648 52,146
(7873) (6895)
Prisoners per 100,000 residents 439 461
(169) (150)
Government spending (assistance and subsi-dies) per capita
125 110
(56) (48)
Government spending (public welfare) per capita
two variables from the American Community Survey of the U.S. Census Bureau that measure local legal opportunities, including median family income and the poverty rate. We also have data on the share of white and black men in the 15–24 and 25–44 age groups for each state over time (American Community Survey 2000–10). Finally, we measure the generosity of public assistance in each state by measuring per capita spending on assistance and subsidies and per capita spending on public welfare (US Census 2000–2010).
III. Identi
fi
cation
To distinguish the effect of the Castle Doctrine laws from confounding factors, we exploit the within- state variation induced by the fact that 21 states passed
such laws between 2000 and 2010. Specifi cally, we use a difference- in- differences
research design that asks whether outcomes change more in states that adopt Castle Doctrine laws than in states that do not, and focus primarily on within- region compari-sons.
Formally, we estimate fi xed effects ordinary least squares (OLS) panel data models,
where we follow convention and use the log of the outcome per 100,000 population
as the dependent variable.18 For homicide, we also estimate negative binomial
mod-els. Ordinary least squares models are estimated with and without weighting by state
population.19 The OLS model estimated is
Outcomeit = β0CDLit + β1Xit + ci + ut + εit
where CDLit is the treatment variable that equals the proportion of year t in which state
i has an effective Castle Doctrine law, Xit is the vector of control variables, and ci and
ut control for state and year fi xed effects, respectively. In addition, in most models we
also include Census region- by- year fi xed effects, to allow states in different regions
of the country to follow different trajectories and account for differential shocks by
region over time.20 Note that for states that enacted the law partway through a year,
we set CDL equal to the proportion of the year in which the law was in effect, though
estimates are almost identical when we exclude the year of adoption.21 Robust
stan-dard errors are clustered at the state level, though we also do additional exercises in the
spirit of Bertrand, Dufl o, and Mullainathan (2004) to ensure standard errors are being
estimated accurately, as well as to perform inference using placebo estimates from pre- Castle Doctrine data. This last approach of using distributions of placebo estimates
18. See, for example, Ayres and Levitt (1998), Duggan (2001), and Lott and Mustard (1997). An alterna-tive specifi cation is to use the log of homicide count as the dependent variable, and control for the log of population. Estimates from that specifi cation that correspond to those in Column 3 of Table 5 are 0.097 and 0.0602 for weighted and unweighted OLS regressions, compared to estimates reported in Table 5 of 0.0937 and 0.0600.
19. Specifi cally, we use analytic weights where average state population over the time period is the weight. This was done using the aweight command in Stata.
20. There are four Census Regions: West, Midwest, Northeast, and South.
Hoekstra and Cheng 831
to do inference is similar in spirit to the permutation inference approach used in the synthetic control method by Abadie, Diamond, and Hainmueller (2010).
Since we primarily rely on specifi cations that include state fi xed effects and region-
by- year fi xed effects, the identifying assumption is that in the absence of the Castle
Doctrine laws, adopting states would have experienced changes in crime similar to nonadopting states in the same region of the country. Our data allow us to test and relax this identifying assumption in several ways. First, we look for graphical evidence of whether the two groups diverged prior to treatment. Along similar lines, we offer a formal statistical test by including an indicator in Equation 1 for the two years prior to the passage of the laws. That is, we ask whether states that pass the laws diverge even
before they pass the laws. If they do, it suggests that the identifying assumption of our research design is violated.
We also examine whether time- varying determinants of crime are orthogonal to the within- state variation in Castle Doctrine laws. Under our identifying assumption, factors such as economic conditions, welfare spending, and policing intensity should not change more over time in adopting states than nonadopting states, as this would suggest that crime in the two groups might have diverged even in the absence of treatment. Thus, we examine whether adding these controls changes our estimates in a meaningful way. To the extent that our difference- in- differences estimates remain
unchanged, it provides some assurance that our research design is reasonable.22
Along similar lines, we also show results from specifi cations that include
con-temporaneous motor vehicle theft and larceny as controls. While it is possible that Castle Doctrine laws could affect these crimes, we would expect any such effects to be second- order and at most small in magnitude. Thus, we use these crime measures as controls that pick up any differential trends in crime in adopting and
nonadopt-ing states. We also perform falsifi cation exercises using these crimes as outcomes
to explicitly test whether Castle Doctrine laws appear to affect crimes unrelated to self- defense. If our identifying assumption holds, we would expect to see no effects on these crimes.
Finally, we allow for state- specifi c linear time trends, thereby allowing each state
to follow a different trend.
IV. Results
A. Falsifi cation Tests
One way to test the identifying assumption is to directly examine whether crimes that ought not be affected by the laws—and thus proxy for general crime trends—appear
to be affected by the laws.23 Finding effects on crimes that ought to be exogenous to
Castle Doctrine law would invalidate our research design.
Thus, we examine whether Castle Doctrine laws appear to affect larceny or motor
22. The primary concern is not that observed determinants vary systematically over time—we can control for those variables directly—but that if they do, it may suggest that unobserved determinants also change systematically over time in the treatment and control groups.
vehicle theft. Although it is possible that these outcomes are affected directly by self- defense laws, we argue that such effects should be second- order at best.
Results are shown in Table 3, which uses a format similar to subsequent tables showing other outcomes. Columns 1 through 6 represent OLS estimates that are weighted by population while Columns 7 through 12 are unweighted OLS estimates.
The fi rst column of each group controls for only state and year fi xed effects. The
second column adds region- by- year fi xed effects while the third column adds time-
varying controls. The fourth column additionally includes an indicator variable for
the two years before the Castle Doctrine law was adopted; the fi fth drops the
lead-ing indicator but adds controls for contemporaneous larceny and motor vehicle theft.
Finally, the last column controls for state fi xed effects, region- by- year fi xed effects,
time- varying controls, and state- specifi c linear time trends.
Estimates for larceny are close to zero and statistically insignifi cant across all
speci-fi cations. Estimates of the effect on the log of the motor vehicle theft rate are more
interesting. Results in Columns 1 and 7, in which only state and year fi xed effects are
included, provide suggestive evidence of increases in motor vehicle theft of 5 to 8
percent, the latter of which is signifi cant at the 10 percent level. However, including
region- by- year fi xed effects in Columns 2 and 8 causes the estimate to drop to zero or
even turn negative, and both are statistically insignifi cant. This suggests that
account-ing for differences in regional trends in some way may be important in assessaccount-ing the impact of Castle Doctrine laws.
B. Deterrence
We now examine whether strengthening self- defense law deters crime. We examine three types of crime: burglary, robbery, and aggravated assault. To the extent that criminals respond to the higher actual or perceived risk that victims will use lethal force to protect themselves, we would expect these crimes to decline after the adoption of Castle Doctrine.
Results are shown in Table 4, where the fi rst six columns show estimates from an
OLS regression weighted by state population, while the last six columns are from unweighted OLS regressions. Results in Column 1 in Panel A for burglary are similar
to the fi nding for motor vehicle theft, in that estimates range from 6 to 8 percent and
are statistically signifi cant at the 5 percent level. Again, however, including region-
by- year effects in Columns 2 and 8 reduces the estimates considerably, and all are statistically indistinguishable from zero at the 5 percent level.
Importantly, there is little evidence of deterrence effects in any specifi cation for any
outcome: Of the 36 estimates reported, none are negative and statistically signifi cant
at the 10 percent level. The estimates are suffi ciently precise as to rule out large
de-terrence effects. For example, in our preferred specifi cation in Column 3, the lower
bounds of estimates on burglary, robbery, and aggravated assault are –2.1 percent, –1.9 percent, and –2.5 percent. Put differently, our estimates and standard errors from Column 3 indicate that if we were to perform this Castle Doctrine policy experiment
many times, we would expect that 90 percent of the time we would fi nd deterrence
deter-Table 3
Falsifi cation Tests: The Effect of Castle Doctrine Laws on Larceny and Motor Vehicle Theft
OLS—Weighted by State Population OLS—Unweighted
1 2 3 4 5 6 7 8 9 10 11 12
Panel A: Larceny Log (Larceny Rate) Log (Larceny Rate)
Castle Doctrine Law 0.00300 –0.00660 –0.00910 –0.00858 –0.00401 –0.00284 0.00745 0.00145 –0.00188 0.00199 –0.00361 –0.0137 (0.0161) (0.0147) (0.0139) (0.0165) (0.0128) (0.0180) (0.0227) (0.0205) (0.0210) (0.0230) (0.0201) (0.0228) 0 to 2 years before adoption
of castle doctrine law
0.00112 0.00924
(0.0105) (0.0121)
Observation 550 550 550 550 550 550 550 550 550 550 550 550
Panel B: Motor Vehicle Theft Log (Motor Vehicle Theft Rate) Log (Motor Vehicle Theft Rate)
Castle Doctrine Law 0.0517 –0.0389 –0.0252 –0.0294 –0.0165 –0.00708 0.0767* 0.0138 0.00814 0.0151 0.00977 –0.00373 (0.0563) (0.0448) (0.0396) (0.0469) (0.0354) (0.0372) (0.0413) (0.0444) (0.0407) (0.0490) (0.0391) (0.0361) 0 to 2 years before adoption
of castle doctrine law
–0.00896 0.0165
(0.0216) (0.0278)
Observation 550 550 550 550 550 550 550 550 550 550 550 550
State and Year Fixed Effects Yes Yes Yes Yes Yes Yes Yes Yes Yes Yes Yes Yes
Region-by-Year Fixed Effects
Yes Yes Yes Yes Yes Yes Yes Yes Yes Yes
Time-Varying Controls Yes Yes Yes Yes Yes Yes Yes Yes
Controls for Larceny or Motor Theft
Yes Yes
State-Specifi c Linear Time
Trends Yes Yes
Notes: Each column in each panel represents a separate regression. The unit of observation is state-year. Robust standard errors are clustered at the state level. Time-varying controls include policing and incarceration rates, welfare and public assistance spending, median income, poverty rate, unemployment rate, and demographics.
OLS—Weighted by State Population OLS—Unweighted
1 2 3 4 5 6 7 8 9 10 11 12
Panel A: Burglary Log (Burglary Rate) Log (Burglary Rate)
Castle Doctrine Law 0.0780*** 0.0290 0.0223 0.0181 0.0327* 0.0237 0.0572** 0.00961 0.00663 0.00293 0.00683 0.0207 (0.0255) (0.0236) (0.0223) (0.0265) (0.0165) (0.0207) (0.0272) (0.0291) (0.0268) (0.0330) (0.0222) (0.0259) 0 to 2 years before adoption
of castle doctrine law
–0.00906 –0.00884
(0.0133) (0.0195)
Panel B: Robbery Log (Robbery Rate) Log (Robbery Rate)
Castle Doctrine Law 0.0408 0.0344 0.0262 0.0197 0.0376** 0.0515* 0.0448 0.0320 0.00839 0.000483 0.00874 0.0267 (0.0254) (0.0224) (0.0229) (0.0257) (0.0181) (0.0274) (0.0331) (0.0421) (0.0387) (0.0462) (0.0339) (0.0299) 0 to 2 years before adoption
of castle doctrine law
–0.0138 –0.0189
Panel C: Aggravated Assault Log (Aggravated Assault Rate) Log (Aggravated Assault Rate)
Castle Doctrine Law 0.0434 0.0397 0.0372 0.0330 0.0424 0.0414 0.0555 0.0698 0.0343 0.0326 0.0341 0.0317 (0.0387) (0.0407) (0.0319) (0.0367) (0.0291) (0.0285) (0.0604) (0.0630) (0.0433) (0.0501) (0.0405) (0.0380) 0 to 2 years before adoption
of castle doctrine law
–0.00897 –0.00391
(0.0147) (0.0249)
Observations 550 550 550 550 550 550 550 550 550 550 550 550
State and Year Fixed Effects Yes Yes Yes Yes Yes Yes Yes Yes Yes Yes Yes Yes
Region-by-Year Fixed Effects Yes Yes Yes Yes Yes Yes Yes Yes Yes Yes
Time-Varying Controls Yes Yes Yes Yes Yes Yes Yes Yes
Contemporaneous Crime Rates
Yes Yes
State-Specifi c Linear Time
Trends Yes Yes
Notes: Each column in each panel represents a separate regression. The unit of observation is state-year. Robust standard errors are clustered at the state level. Time-varying controls include policing and incarceration rates, welfare and public assistance spending, median income, poverty rate, unemployment rate, and demographics. Contemporaneous crime rates include larceny and motor vehicle theft rates.
*Signifi cant at the 10% level
**Signifi cant at the 5% level
rence effects. Thus, while Castle Doctrine law may well have benefi ts to those legally
justifi ed in protecting themselves in self- defense, there is no evidence that the law
provides positive spillovers by deterring crime more generally.24
C. Homicide
We now turn to whether strengthening self- defense laws increases criminal homicide. Given that the laws reduce the expected costs associated with using violence, eco-nomic theory would predict that there would be more of it.
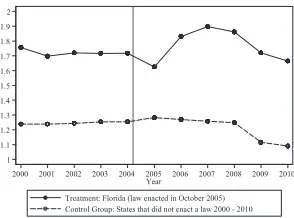
We start by showing the raw data in a set of fi gures. Figure 1 shows log homicide
rates over time for adopting states and nonadopting states, by year of adoption. For example, Figure 1a shows the log homicide rate for the 2005 adopting state (Florida), relative to states that did not adopt the law from 2000–10. While it is somewhat
dif-fi cult to appreciate the magnitude of changes over time from the graphs and keeping in
mind that the adoption year is only partially treated, two patterns emerge. The fi rst is
that with the exception of the two states adopting in 2008 (Ohio and West Virginia),25
the homicide rates of adopting states have a similar trajectory to those of nonadopting
states prior to the adoption of the law.26 That is, there is little reason to believe that the
homicide rates of adopting states would have increased relative to nonadopting states in the absence of treatment.
Second, Figure 1 shows that there is a large and immediate increase in homicides for states adopting in 2005, 2006, and 2009. Similarly, while the six states that adopted in 2007 or 2008 did not appear to experience much of a relative increase in the year of adoption or the year afterward, they notably did not experience the relative drop in homicide rates that other states nationwide did in 2009 and 2010. Of course, given the
small samples involved, it is diffi cult to infer much about short- term versus long- term
patterns across these different sets of states but it is clear from the raw data that Castle
Doctrine states experienced a relative increase in homicides after adoption.27
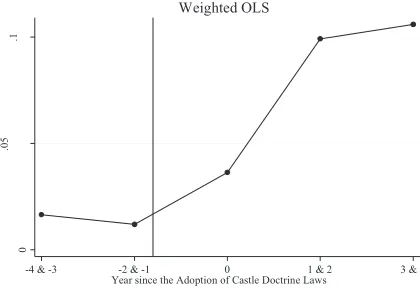
Figure 2 shows the estimated divergence between adopting and nonadopting states
over time, where t = 0 is the year of treatment. Specifi cally, Figure 2 graphs coeffi cients
24. It is worth noting that it is diffi cult to measure the benefi ts of these laws to actual victims of violent crime. These benefi ts could include fewer or less serious physical or psychological injuries, or lower legal costs. We make no attempt to measure these benefi ts in this paper.
25. It is little surprise given the small sample sizes involved in this exercise that there would be some set of sets that did not track nonadopting states perfectly in trajectory for the entire period prior to treatment. In addition, we note that while homicide rates did increase in both Ohio and West Virginia from 2000/2001 to 2003, rates there tracked the rest of the country quite closely in changes from 2003 through 2007. 26. As shown in Figure 1, adopting states have homicide rates that are about 30 percent higher than non-adopting states. However, because we are using a difference- in- differences research design that conditions on year and state fi xed effects, differences in levels is not a concern for identifi cation. Instead, what would worry us is if the homicide rate in adopting states increased more than in nonadopting states even before treatment, as that would suggest that the groups might have continued to diverge afterward, regardless of the change in law. We see no evidence of that, which suggests that the relative increase seen after 2005 is caused by Castle Doctrine law. Moreover, note that homicide estimates remained similar even after controlling for time- varying police and incarceration rates and other controls, including region- by- year fi xed effects, and allowing for state- specifi c linear time trends.
Hoekstra and Cheng 837
Figure 1
Log Homicide Rates Before and After Adoption of Castle Doctrine Laws, by Year of Adoption
2000 2001 2002 2003 2004 2005 2006 2007 2008 2009 2010 Year
Treatment: Florida (law enacted in October 2005) Control Group: States that did not enact a law 2000 - 2010
1
2000 2001 2002 2003 2004 2005 2006 2007 2008 2009 2010 Year
Treatment: States that enacted the law in 2006 Control Group: States that did not enact a law 2000 - 2010
1
2000 2001 2002 2003 2004 2005 2006 2007 2008 2009 2010 Year
Treatment: States that enacted the law in 2008 Control Group: States that did not enact a law 2000 - 2010
1
2000 2001 2002 2003 2004 2005 2006 2007 2008 2009 2010 Year
Treatment: States that enacted the law in 2007 Control Group: States that did not enact a law 2000 - 2010
.5
2000 2001 2002 2003 2004 2005 2006 2007 2008 2009 2010 Year
Treatment: States that enacted the law in 2009 Control Group: States that did not enact a law 2000 - 2010
Figure 1a: State Adopting in 2005 (Florida) Figure 1d: States Adopting in 2008 (Ohio, West Virginia)
Figure 1b: States Adopting in 2006 (Alabama, Alaska, Arizona, Georgia, Indiana, Kansas, Kentucky, Louisiana, Michigan, Mississippi,
Oklahoma, South Carolina, South Dakota)
Figure 1e: State Adopting in 2009 (Montana)
0
.0
5
.1
-4 & -3 -2 & -1 0 1 & 2 3 & 4
Year since the Adoption of Castle Doctrine Laws Weighted OLS
0
.0
5
.1
-4 & -3 -2 & -1 0 1 & 2 3 & 4 Year since the Adoption of Castle Doctrine Laws
Unweighted OLS
0
.0
5
.1
-4 & -3 -2 & -1 0 1 & 2 3 & 4 Year since the Adoption of Castle Doctrine Laws
Negative Binomial
Figure 2
Hoekstra and Cheng 839
from a difference- in- differences model in which we control for state and region- by-
year fi xed effects and time- varying covariates, and then allow for divergence three and
four years prior to adoption, one and two years prior to adoption, the year of adoption,
the fi rst and second years after adoption, and three or more years after adoption.
Es-timates are relative to the average difference in log homicide rates fi ve or more years
prior to law adoption.
Consistent with Figure 1, there is little evidence of divergence in the years prior to adoption. For example, there was almost no divergence in the four years prior to adoption using the negative binomial model, and only around 1 to 2 percent using weighted OLS. For weighted OLS, the divergence increases to 10 percent after the year of treatment, and to around 8 percent in the negative binomial model. This offers of preview of the estimated effect on homicide of around 8 percent. There is more modest evidence of divergence prior to adoption using unweighted OLS, though there still appears to be a discrete change at the year of treatment from around 2.5 percent to 7 percent. The difference between the estimated preadoption divergence in weighted
and unweighted specifi cations appears to be largely due to the small population states
of North and South Dakota.28
We now turn to estimating the average effect of the laws in a difference- in- differences regression framework. Results are shown in Panels A, B, and C of Table 5, which show population- weighted OLS estimates, unweighted OLS estimates, and es-timates from a negative binomial model. Eses-timates from the negative binomial regres-sion are interpreted in the same way as those from a log- linear OLS model. Results from the population- weighted OLS model shown in Panel A indicate that the laws
in-creased homicide rates by 8 to 10 percent; all six estimates are statistically signifi cant
at the 5 percent level, and three are signifi cant at the 1 percent level. Estimates from
unweighted OLS regressions shown in Panel B range from 5 to 9 percent, though all
are measured imprecisely: t- statistics range from 0.6 to 1.5. Estimates in Panel C from
a negative binomial model indicate Castle Doctrine leads to a 6 to 11 percent increase
in homicide. All negative binomial estimates that include region- by- year fi xed effects
are signifi cant at the 5 percent level, and that which does not (Column 1) is signifi cant
at the 10 percent level. Finally, we note that homicide estimates are similar for various subsets of the adopting states, as shown in Appendix Table A1. The only difference is the estimates are somewhat larger, albeit not statistically so, for the subset of adopting
states identifi ed by Koons (2006) as not previously requiring duty to retreat in either
statute or (more typically) case law.29
We have also done additional tests in order to ensure that we are making correct
inferences about statistical signifi cance. Toward that end, we do tests in the spirit
of Bertrand et al. (2004), in which we randomly select 11- year panels from 1960 to 2004, and then randomly assign states to the treatment dates found in our data, without replacement. Thus, we assume that one state expanded Castle Doctrine on October 1 of the sixth year of the 11- year panel (just as Florida actually adopted in 2005, the 6th
Panel A: Log Homicide Rate (OLS—Weighted) 1 2 3 4 5 6
Castle Doctrine Law 0.0801** 0.0946*** 0.0937*** 0.0955** 0.0985*** 0.100**
(0.0342) (0.0279) (0.0290) (0.0367) (0.0299) (0.0388)
0 to 2 years before adoption of castle doctrine law 0.00398
(0.0222)
Observations 550 550 550 550 550 550
Panel B: Log Homicide Rate (OLS - Unweighted)
Castle Doctrine Law 0.0877 0.0811 0.0600 0.0588 0.0580 0.0672
(0.0638) (0.0769) (0.0684) (0.0807) (0.0662) (0.0450)
0 to 2 years before adoption of castle doctrine law –0.00298
(0.0350)
Panel C: Homicide (Negative Binomial)
Castle Doctrine Law 0.0565* 0.0734** 0.0879*** 0.0854** 0.0937*** 0.108***
(0.0331) (0.0305) (0.0313) (0.0385) (0.0302) (0.0346)
0 to 2 years before adoption of castle doctrine law –0.00545
(0.0227)
Observations 550 550 550 550 550 550
State and Year Fixed Effects Yes Yes Yes Yes Yes Yes
Region-by-Year Fixed Effects Yes Yes Yes Yes Yes
Time-Varying Controls Yes Yes Yes Yes
Contemporaneous Crime Rates Yes
State-Specifi c Linear Time Trends Yes
Notes: Each column in each panel represents a separate regression. The unit of observation is state-year. Robust standard errors are clustered at the state level. Negative binomial estimates are interpreted in the same way as those in a log-linear OLS model. Time-varying controls include policing and incarceration rates, welfare and public assistance spending, median income, poverty rate, unemployment rate, and demographics. Contemporaneous crime rates include larceny and motor vehicle theft rates. Homicide data are from the published FBI Uniform Crime Reports.
*Signifi cant at the 10% level
**Signifi cant at the 5% level
year of our panel), and that 13 more states adopted in the seventh year of the 11- year panel, etc. We generate distributions of estimates, and ask how often we reject the null hypothesis of no effect at the 5 percent level, as well as what proportion of the placebo estimates are larger than the actual estimated effect of (real) Castle Doctrine
expansion. The latter fi gure corresponds to a p- value and is similar to the method used
in synthetic control methods (Abadie et al. 2010), as well as by Chetty, Looney, and Kroft (2009).
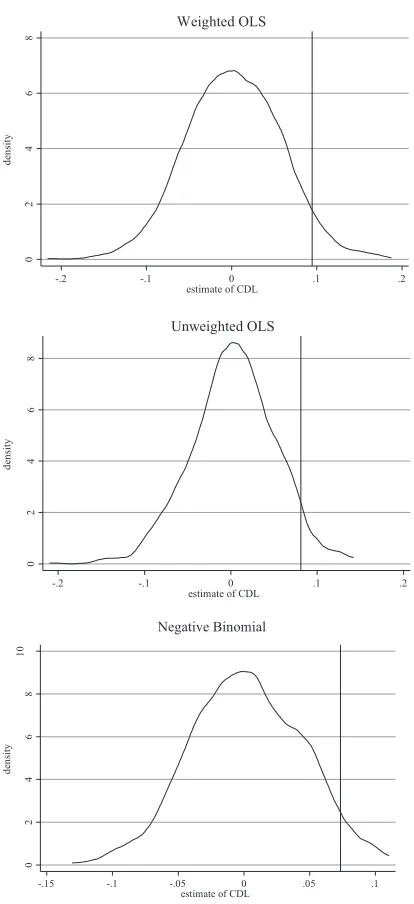
The resulting placebo distributions from 1,000 random draws are shown in Figure 3, and correspond to Table 5 results from Column 2 of Panels A, B, and C, respectively. Results from population- weighted OLS placebo estimates suggest that robust clus-tered standard errors may be a bit too small: 10.0 percent of simulated estimates are
signifi cant at the 5 percent level. However, the estimate of 9.46 percent in Column 2
ranks in the 95.4th percentile of placebo estimates, which means only 4.6 percent of placebo estimates are larger than it is.
Results for unweighted OLS simulation results are also interesting. On the one hand, simulations suggest that clustered standard errors from unweighted OLS
re-gressions are accurate: 5.7 percent of the simulated estimates are signifi cant at the 5
percent level. At the same time, however, the estimate of 8.1 percent shown in Table 5 corresponds to the 95.1st percentile, which would give it a p- value of 4.9 percent using the permutation- based approach to inference. This suggests that results in Panel B of
Table 5 understate the degree of statistical signifi cance.
Finally, simulations for the fi xed effect negative binomial model corresponding to
Column 2 in Panel C indicate that 7.6 percent of placebo estimates are signifi cant at
the 5 percent level, while 14.1 percent are signifi cant at the 10 percent level. As shown
in Figure 3, the estimate of 7.3 percent in Table 5 ranks at the 95.7th percentile, as fewer than 5 percent of placebo estimates were larger than the actual estimate in the simulations.
On the basis of these exercises, we conclude that it is unlikely that we would have
obtained estimates of the magnitude and statistical signifi cance shown in Panels A, B,
and C of Table 5 due to chance.
We have also performed simulations to see if the homicide rates of these particular
21 states ever diverged in the way they did after adopting Castle Doctrine in the late
2000s. To do so, we created 40 panel data sets, each covering separate 11- year time periods between 1960 and 2009. In each 11- year panel, we assume that Florida adopts Castle Doctrine on October 1 of the sixth year, and that the 13 states that adopted in 2006 adopted in the seventh year, etc. None of the 40 estimates corresponding to either the OLS population- weighted regressions or from the negative binomial re-gression were larger than those shown in Column 2 of Table 5. In the case of the OLS unweighted regressions, only 1 of the 40 placebo estimates was larger than the
actual estimate of 8.1 percent shown in Column 2, Panel B, of Table 5.30 The average
estimated divergence across the 40 years was –0.008, –0.004, and –0.005 across the
unweighted OLS, weighted OLS, and negative binomial models.31 Thus, there is no
30. The one larger estimate was 10.5 percent, and was from the 1975 to 1985 time period.
Hoekstra and Cheng 843
0
2
4
6
8
de
ns
it
y
-.2 -.1 0 .1 .2
estimate of CDL Weighted OLS
0
2
4
6
8
de
ns
it
y
-.2 -.1 0 .1 .2
estimate of CDL Unweighted OLS
0
2
4
6
8
10
de
ns
it
y
-.15 -.1 -.05 0 .05 .1
estimate of CDL Negative Binomial
Figure 3
Empirical Distributions of Placebo Homicide Estimates
evidence that the homicide rates in Castle Doctrine states show a general tendency to increase relative to their regional counterparts: In the last 40 years they have almost never done so as much as they did immediately after Castle Doctrine.
Given the robustness of the estimates to various specifi cations, it is worth
consider-ing what one would have to believe for a confoundconsider-ing factor to cause the observed increase in homicide rates, rather than expansions to Castle Doctrine. That is, one would have to believe that something else caused homicides to increase relative to nonadopting states immediately after the laws were enacted but not in the years prior to enactment. In addition, this confounder must have only caused a divergence in homicide rates in the late 2000s coincidental with the passage of Castle Doctrine law, and not at any point in the 40 years prior. Furthermore, this confounder must cause an increase in homicides in Castle Doctrine states after adoption but not cause a similar
increase in states in the same region of the country that did not expand Castle
Doc-trine at that time. Additionally, the confounder must cause adopting states to diverge from their own preadoption trend in homicide rate, coincidental with the enactment of
Castle Doctrine law. The confounder must also increase homicides in adopting states
after adoption without causing proportionate increases in motor vehicle theft, larceny, robbery, burglary, or aggravated assault. Finally, the confounder must be uncorre-lated with changes in the economic conditions, welfare generosity, and the rates of incarceration and policing in adopting states immediately following adoption. We are
unable to think of any confounding factor that would fi t this description, and thus we
interpret the increase in homicides as the causal effect of expanded Castle Doctrine.
D. Homicide: Interpretation
Collectively, we view these fi ndings as compelling evidence that Castle Doctrine laws
increase homicide. However, we note that one downside of the homicide measure is
that it could potentially include homicides that are justifi ed under the new self- defense
law but were improperly reported as criminal homicides rather than justifi able
ho-micides. If all the additional homicides were misreported as criminal homicides, the increase may not be viewed by everyone as unambiguously bad. We note, however, that the net increase cannot be driven by a one- to- one substitution of homicides of as-sailants for homicides of innocent victims. In contrast, in order for the entire increase in homicide to be driven by life- saving use of force, there would have to be at least some cases of multiple killed assailants by a would- be- killed victim.
To shed light on this issue, we look directly for evidence for or against the different interpretations of the increase in reported homicide. We start by examining whether
the laws increase the number of homicides classifi ed as murders. This classifi cation
available in the Return A fi les excludes nonnegligent manslaughter classifi cations that
one might think would be used more often in potential self- defense killings not
classi-fi ed as justifi able homicides. Estimates in Panel A of Table 6 indicate a similarly sized
increase in murder, which suggests that police are largely classifying these additional homicides as murders.
We then turn to assessing whether criminals appear to escalate violence in response
Hoekstra and Cheng 845
to Castle Doctrine laws. For example, a rational criminal may respond to a real or perceived increase in the likelihood of encountering a victim willing to use lethal force by using a deadly weapon himself. Thus, we examine whether expanded Castle Doctrine increases felony- type and suspected felony- type murders, which appeared to be committed during a felony. Results are shown in Panel B of Table 6. The estimate
from Column 1, which controls only for state and year fi xed effects, is 10 percent and
is statistically indistinguishable from zero. Estimates from specifi cations including
region- by- year fi xed effects are more suggestive of a criminal escalation effect:
Esti-mates in Columns 2 through 5 are around 20 percent and are statistically signifi cant
at the 10, 5, 1, and 5 percent levels, respectively, though we note the estimate goes
to zero when allowing for state- specifi c time trends in Column 6. We also examine
whether criminals are more likely to use guns during robberies.32 Results in Panel C
of Table 6 indicate that there is little evidence of this type of escalation, at least once
one compares states to others in their same region.33 In short, while we fi nd suggestive
evidence of escalation by criminals, it is not conclusive.
Finally, we turn to evidence on whether the laws increase the reported number of
justifi able homicides. The problem with these data is that justifi able homicides are
believed to be underreported: Kleck (1988) estimates that only one- fi fth of legally
justifi ed homicides by civilians are reported. Only 200 to 300 homicides are classifi ed
this way every year in the United Sates, compared to around 14,000 total criminal
homicides. However, even though the level of justifi able homicides may be
under-reported, relative changes in justifi able homicide may still be informative. As a result,
we focus on examining the relative increase in reported justifi able homicide, and then
estimate how many additional legally justifi ed homicides there really are by scaling
the pre- Castle Doctrine fi gure by estimates of underreporting.
Results are shown in Panels D and E of Table 6. Panel D shows estimates from
unweighted regressions in which the number of justifi able homicides is the dependent
variable. Estimated effects range from 1 to 4.3 additional justifi able homicides, which
is relative to a baseline average of 4.9 justifi able homicides per state in the year prior
to Castle Doctrine expansion. The estimate in our preferred specifi cation in Column
3 is 3.2, is statistically signifi cant at the 5 percent level, and represents a 65 percent
increase.34,35
Panel E reports estimates from a negative binomial model. Estimates range from an
insignifi cant 28 percent increase to a signifi cant 57 percent increase.
32. We also look at the proportion of assaults in which a gun was used and fi nd no evidence of an increase, though the baseline rate is small (3 percent). We also note that examining these ratios as outcome variables could be problematic if the laws were found to reduce robbery or aggravated assault. However, as we show in Table 4 there is no effect on robberies or aggravated assaults.
33. It is diffi cult to think of how using other FBI classifi cations could help answer this question. For example, the FBI classifi es some nonfelony- type homicides as having originated in an argument. It is diffi cult to know, however, whether the argument would have resulted in serious injury to the killer, had that person not used lethal force, or if the argument escalated from, say, a fi stfi ght into a homicide. Yet most would agree that the latter is more disturbing than the former.
34. In contrast, we fi nd no evidence of an increase in justifi able homicide by police, consistent with the identifying assumption. Results are available upon request.
Homicide by Private Citizens
Panel A: Murder (OLS—Weighted) 1 2 3 4 5 6
Castle Doctrine Law 0.0906** 0.0955** 0.0916** 0.105** 0.0981** 0.0813
(0.0424) (0.0389) (0.0382) (0.0425) (0.0391) (0.0520)
0 to 2 years before adoption of castle doctrine law 0.0277
(0.0309)
Observations 550 550 550 550 550 550
Panel B: Log Felony-Type and Suspected Felony Type Homicides (OLS—Weighted)
Castle Doctrine Law 0.0993 0.203* 0.220** 0.284*** 0.222** 0.00121
(0.112) (0.109) (0.0907) (0.103) (0.0871) (0.0686)
0 to 2 years before adoption of castle doctrine law 0.143***
(0.0516)
Observations 539 539 539 539 539 539
Panel C: Proportion of Robberies Using Gun (OLS—Weighted)
Castle Doctrine Law 0.0444*** 0.0218 0.0187 0.0247 0.0183 -0.00404
(0.0145) (0.0186) (0.0153) (0.0167) (0.0155) (0.0133)
0 to 2 years before adoption of castle doctrine law 0.0124
(0.0101)
Panel D: Justifi able Homicide by Private Citizens (OLS—Unweighted, Dep. Variable = Count)
Castle Doctrine Law 4.328*** 3.370** 3.200** 3.374** 3.239** 0.960
(1.467) (1.300) (1.202) (1.335) (1.216) (1.219)
0 to 2 years before adoption of castle doctrine law 0.417
(0.709)
Observations 550 550 550 550 550 550
Panel E: Justifi able Homicide by Private Citizens (Negative Binomial)
Castle Doctrine Law 0.573*** 0.428* 0.283 0.320 0.324 NA
(0.210) (0.244) (0.235) (0.254) (0.228) NA
0 to 2 years before adoption of castle doctrine law 0.0862
(0.136)
Observations 550 550 550 550 550 550
State and Year Fixed Effects Yes Yes Yes Yes Yes Yes
Region-by-Year Fixed Effects Yes Yes Yes Yes Yes
Time-Varying Controls Yes Yes Yes Yes
Contemporaneous Crime Rates Yes
State-Specifi c Linear Time Trends Yes
Notes: Each column in each panel represents a separate regression. The unit of observation is state-year. Robust standard errors are clustered at the state level. Negative binomial estimates are interpreted in the same way as those in a log-linear OLS model. Time-varying controls include policing and incarceration rates, welfare and public assistance spending, median income, poverty rate, unemployment rate, and demographics. Contemporaneous crime rates include larceny and motor vehicle theft rates. NA indicates that the model did
not converge. Castle doctrine states averaged 4.9 justifi able homicides in the year prior to enactment.
*Signifi cant at the 10% level
**Signifi cant at the 5% level
Using these estimates, we now turn to assessing whether the relative increases ob-served in Table 6 can explain the entire increase in homicide, given estimates of the
degree of underreporting of legally justifi ed homicide. The largest estimated relative
increase from a specifi cation in Table 6 that controls for region- by- year fi xed effects
is 70 percent, which is relative to a baseline total of 103 justifi able homicides across
the 21 states in the year prior to Castle Doctrine enactment. We assume that i) police
departments are not less likely to report an otherwise- identical homicide as justifi able
after Castle Doctrine expansion, and ii) the relative increase in legally justifi ed
homi-cide due to the change in law is no lower for reporting agencies than for nonreporting
agencies. We view the fi rst of these assumptions as likely to hold, and the second
as reasonable, though we emphasize that they are in fact assumptions. Combining these assumptions with our estimates in Table 5 suggests that the true Castle- Doctrine-
induced relative increase in legally justifi ed homicide across the 21 states should be
no larger than 70 percent.
Kleck (1988) reports that approximately one- fi fth of legally justifi ed homicides
are reported correctly, while the others are classifi ed as (criminal) homicides. Given
the 103 reported pre- Castle Doctrine justifi able homicides, that suggests that the true
fi gure is 515. A 70 percent increase means that Castle Doctrine expansion causes an
additional 361 legally justifi ed homicides, of which 289 (80 percent) would be (mis)
reported as homicides. Recall that estimates from Table 5 indicate that Castle Doctrine law causes approximately an 8 percent increase in homicide, which translates to an additional 611 homicides given the 7,632 pre- Castle Doctrine homicides. Thus, under these assumptions, our best estimate is that no more than half of the additional
homi-cides caused by Castle Doctrine law were legally justifi ed.
Of course, different assumptions yield different conclusions. For example,
assum-ing that only 10 percent of legally justifi ed homicides are reported correctly, along
with a 70 percent relative increase and the second assumption outlined above, would
suggest that all of the additional homicides were legally justifi ed.
To summarize our results, we fi nd no evidence that strengthening self- defense law
deters crime. On the other hand, we fi nd that a primary consequence of Castle
Doc-trine laws is to increase homicide by a statistically and economically signifi cant 7 to
10 percent. Relative increases in justifi able homicide along an estimate of the degree
of underreporting suggest that it is unlikely but not impossible, that the additional
reported criminal homicides consist entirely of legally justifi ed homicides. We
empha-size, however, that one’s conclusion on that issue depends on assumptions about the
nature and degree of underreporting of legally justifi ed homicides.
V. Conclusion
In recent years, more than 20 states have strengthened their self- defense laws by adopting Castle Doctrine laws. These statutes widen the scope for the
justifi ed use of lethal force in self- defense by stating the circumstances under which
self- defense is justifi ed and removing the duty to retreat from a list of protected places
Hoekstra and Cheng 849
Results presented indicate that expansions to Castle Doctrine do not deter crime.
Furthermore, our estimates are suffi ciently precise as to rule out moderate- sized
de-terrence effects. Thus, while our view is that it is a priorireasonable to expect that
strengthening self- defense law would deter crime, we fi nd this is not the case.
More signifi cantly, results indicate that Castle Doctrine laws increase total
homi-cides by around 8 percent. Put differently, the laws induce an additional 600 homihomi-cides per year across the 21 states in our sample that expanded Castle Doctrine over this
time period. This fi nding is robust to a wide set of difference- in- differences specifi
-cations, including region- by- year fi xed effects, state- specifi c linear time trends, and
controls for time- varying factors such as economic conditions, state welfare spending,
and policing and incarceration rates. These fi ndings provide evidence that lowering the
expected cost of lethal force causes there to be more of it.
A critical question is whether all the additional homicides that were reported as
murders or nonnegligent manslaughters could have been legally justifi ed. Based on the
results of various tests and exercises performed here, our view it is that this is unlikely, albeit not impossible.
With respect to policy, our fi ndings suggest that an informed debate over these laws
will weigh the benefi ts of increased protections given to victims against the net
in-crease in violent deaths that result. More broadly, our fi ndings indicate that incentives
Panel A: Differential Effects by Previous Treatment of Duty to Retreat
Log Burglary
Rate
Log Robbery
Rate
Log Aggravated
Assault Rate
Log Homicide
Rate
Proportion of Robberies with a Gun
# Justifi able Homicides by Private Citizens
Castle doctrine law in states classifi ed as previously requiring duty to retreat
0.0195 0.0173 0.0315 0.117*** 0.0196 7.976***
(0.0265) (0.0256) (0.0358) (0.0355) (0.0156) (2.898) Castle doctrine law in states classifi ed as not previously requiring
duty to retreat
0.0271 0.0416 0.0471 0.0529 0.0173 –1.457
(0.0305) (0.0323) (0.0423) (0.0352) (0.0259) (3.368)
Observations 550 550 550 550 544 550
Panel B: Effect of Castle Doctrine Law That Removes Duty to Retreat in Any Place One Has a Legal Right to Be
Castle doctrine law that removes duty to retreat in any place one has a legal right to be
0.0189 0.0219 0.0293 0.0814*** 0.0212 5.597**
(0.0252) (0.0264) (0.0330) (0.0269) (0.0174) (2.736)