Proceeding, International Seminar on Industrial Engineering and Management
ISSN : 1978-774X
OPTIMIZATION OF REVERSE ENGINEERING PROCESS FOR
CONSTRUCTING ROTATIONAL PART MODEL USING RESPONSE
SURFACE METHODOLOGY
The Jaya Suteja, Susila Candra, Therisia Yuniyanti
Manufacturing Engineering, University of Surabaya Raya Kalirungkut, Surabaya, Indonesia
ABSTRACT
The quality of rotational part model constructed by digitizing process depends on circumferential pitch and height direction pitch. In obtaining the most similar model of rotational product, circumferential pitch and height direction pitch must be set as low as possible. However, it will increase the required time to perform digitizing process. This paper describes an optimization of reverse engineering process, in particularly digitizing process, for a simple and complex rotational part modeling using response surface methodology. Based on the experiment results, the quality of simple part model is influenced only by height direction pitch. The optimum quality of part model is achieved by using height direction pitch equal to 2 mm. The optimum quality of part model has the value of texture is 1.5152 and the required time is 6.3891 minutes. In addition, the quality of complex part model is influenced by circumferential pitch and height direction pitch. The optimum quality of complex part model is achieved by using circumferential pitch equal to 0.36 degree and height direction pitch equal to 1.8 mm. The optimum quality of complex part model has the value of texture is 0.4313 and the required time is 8.5514 minutes.
Key words: Optimization, Reverse Engineering, Response Surface, Rotational Product.
1. INTRODUCTION
According to Y.H. Chen and C.T. Ng (1997), reverse engineering is a methodology for constructing CAD models of physical parts by digitizing an existing part, creating a computer model and then using it to manufacture the component. Motavalli (1998) describes that the main steps in reverse engineering consists of part digitization, data segmentation, and part modeling. In addition, Chang, et.al, (2008) states more detail that the typical procedure of reverse engineering consists of five steps: (1) data acquisition, (2) preprocessing (noise filtering and merging), (3) triangulation, (4) feature extraction, and (5) segmentation and surface fitting.
Reverse engineering has been implemented in various applications. Hsiao, et.al., (2003) presents reverse engineering for product form design. Rho, et.al, (2002) develop a system for reproducing 3D human busts. In addition, Barbero, et.al., (2009) present a method of reverse engineering applied to the particular case of a cam in order to recover the form and dimensions of the design of the original piece, which take into account: design intent, general
knowledge of the problem, different geometric and dimensional restrictions, and the digitized point cloud.
The productivity of the reverse engineering process heavily depends on the data acquisition process, in this case part digitizing. For data acquisition, Motavalli (1998) presents various commercial systems available for part digitization. The examples of this system are Coordinate Measuring Machine, Ultrasonic Imaging and Laser Scanners. These systems can be classified as contact systems and non-contact systems.
The mechanical contact measuring equipment, such as a Coordinate Measuring Machine equipped with a touch triggered probe, usually produces accurate results up to 10 mm or better. The measuring speed, however, is relatively slow compared with optical non-contact measuring systems. It also needs to apply probe radius compensation to the measured points. Because of the contacting force, according to Liu, et. al. (2006), soft and fragile objects cannot be measured by the touch probe.
measured points on the surface of a physical object. The dimensional accuracy is usually in the range of several tenths to several hundredths of a millimeter. Obviously, bright and shining objects cannot be measured with optical measuring systems. In addition to the above-mentioned features, both mechanical contact and optical non-contact measuring techniques are not suitable for measuring hidden and internal features.
In digitizing process using non-contact system, to create the most similar model, the digitizer must generate an enormous amount of point data. However, according to Lee, et. al., (1998), for generating an enormous amount of point data, the digitizing process requires an enormous amount of time.
Referring to Bernard (1999), the critical points that influence the results of the digitizing process are the definition of the digitizing strategy and its implementation. The acquisition method is one of the important digitizing strategy and its implementation. The acquisition method involves two types of scanning method, which are rotary and plane scanning. For each of scanning methods, the value of scanning area and scanning pitch must be determined before scanning process is started. The scanning area is determined based on the dimension of the part. Meanwhile, the quality of the constructed model is influenced by the scanning pitch.
Fig. 1. Scanning Pitch of Rotary Scanning
For constructing rotational part model, the best type scanning method is rotary scanning. For rotary scanning, circumferential pitch and height direction pitch will determine the quality of the constructed model. The circumferential pitch sets the angle of adjacent scanning points or the number of scanning points on the circumference. Meanwhile, height direction
pitch sets the distance between scan points as seen in figure 1. A narrower scan pitch results in scanning of greater precision, but the scan time also becomes correspondingly longer. Conversely, a wider scan pitch yields shorter scan times, but scanning results are rougher.
Based on the problem above, this paper presents an optimization of the reverse engineering process in particularly in digitizing process for constructing rotational part model. The purpose of this research is to achieve the best part model in the shortest time. The best rotational part model in this case is the most similar rotational part model to the model generated by the smallest value of scanning pitch.
2. RESEARCH METHOD
This research applies Response Surface Methodology to find the value of circumferential pitch and height direction pitch that acquire the optimum quality of rotational part model. The design of experiment of this research is explained as follow:
The factors of this experiment are circumferential pitch (CP) and height direction pitch (HDP).
The units of this experiment are a glass as shown in figure 2 and a sharpener as shown in figure 3. The glass in this experiment represents simple part with maximal three configurations such as ornaments and reliefs. The sharpener represents complex part with more than three configurations.
The responses of this experiment are texture and time. The value of the texture is influenced by the similarity between the rotational part model resulted from digitizing process and the best rotational part model. The value of the texture is calculated by performing texture comparison between the rotational part model resulted from digitizing process and the best rotational part model. The higher the value of texture means the higher the differences between the models.
In achieving more focused result, this research is constrained as follow:
2. Lased Scanner used in this research is Laser Scanner LPX 600.
3. The software used as the aid tool is Dr. PICZA 3.
4. The value of the texture is calculated by using Mat Lab 7.0.1.
5. Data of Experiment is analyzed by using MINITAB 14.
6. Required time is not measured but it is estimated based on the software calculation.
Figure 2. Glass
Figure 3. Sharpener
To find the relation between all factors and all responses, a first order experiment is performed. In the first order experiment, 2k factorial design is applied augmented with five centre points and two more points. The factors level of the first order experiment is shown in table 1. All the levels are coded as shown in table 1. The level of every factor is determined based on the preliminary experiment and the suggestion of laser scanner vendor. The level of circumferential pitch cannot be set symmetry because of the limitation of laser scanner.
Table 1. Code and Level of CP
Code -1.36 -1 0 1 1.4
CP ( ) 0.36 3.6 9 14.4 18
Table 2. Code and Level of HDP
Code -1.33 -1 0 1 1.33
HDP (mm) 0.4 0.6 1.2 1.8 2
Based on the result of the first order experiment, a second order experiment may be performed. The factors level of the second order experiment is determined based on the result of the first order experiment.
3. RESULT AND DISCUSSION
After the experiments for two units of experiment have been conducted, the responses of the experiment are shown in table 3 and 4.
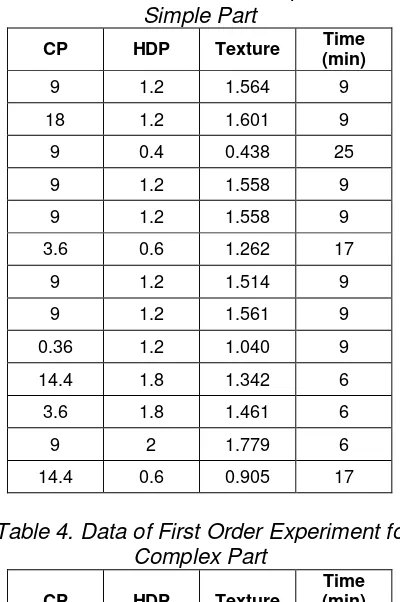
Table 3. Data of First Order Experiment for Simple Part
CP HDP Texture Time (min)
9 1.2 1.564 9
18 1.2 1.601 9
9 0.4 0.438 25
9 1.2 1.558 9
9 1.2 1.558 9
3.6 0.6 1.262 17
9 1.2 1.514 9
9 1.2 1.561 9
0.36 1.2 1.040 9
14.4 1.8 1.342 6
3.6 1.8 1.461 6
9 2 1.779 6
14.4 0.6 0.905 17
Table 4. Data of First Order Experiment for Complex Part
CP HDP Texture
Time (min)
14.4 0.6 2.059 26
3.6 0.6 0.629 26
9 1.2 1.050 13
9 1.2 1.007 13
9 1.2 1.206 13
18 1.2 2.716 13
14.4 1.8 1.779 9
3.6 1.8 0.625 9
9 2 0.955 8
9 0.4 0.890 38
9 1.2 1.117 13
0.36 1.2 0.475 13
For simple part, the analysis of variance of texture is shown in table 5. The result indicates that there is no evidence of second order curvature in the response over the region of exploration.
According to estimated regression coefficients for texture as shown in table 6, the first order model of texture for simple part depends on only height direction pitch and the best prediction of texture model is
Texture = 1,722 + 2,0084 HDP – 0,6139 HDP2 (1)
Where:
HDP : height direction pitch
Table 5. Analysis of Variance of First Order Experiment for Simple Part
Source DoF SS MS F P
Regression 2 1.066 0.533 10.04 0.004 Residual Error 10 0.531 0.053
Lack of Fit 2 0.225 0.112 2.94 0.110
Pure Error 8 0.306 0.038
Total 12 1.597
Table 6. Estimated Coefficients of Texture for Simple Part
Predictor Coef SE Coef T P
Constant 1.48075 0.08429 17.57 0.000
B 0.32084 0.08382 3.83 0.003
B^2 -0.22064 0.09463 -2.33 0.042
S = 0.230359 R-Sq=66.8 % R-Sq(adj)=60.1 %
In addition, the analysis of variance of texture for complex part is shown in table 7. The result indicates that there is no evidence of second order curvature in the response over the region of exploration.
Table 7. Analysis of Variance of First Order Experiment for Complex Part
Source DoF SS MS F P
Regression 4 4.669 1.167 85.32 0.000 Residual Error 8 0.109 0.014
Lack of Fit 4 0.084 0.021 3.35 0.134
Pure Error 4 0.025 0.0063
Total 12 4.779
According to estimated regression coefficients for texture as shown in table 8, the first order model of texture for complex part depends on circumferential pitch and height direction pitch. Furthermore, the best prediction of texture model is
Texture = 0,275 – 0,025 CP + 0,6027 HDP + 0,0088 CP2– 0,2692 HDP2 (2)
Where:
CP : circumferential pitch HDP : height direction pitch
Table 8. Estimated Coefficients of Texture for Complex Part
Predictor Coef SE Coef T P
Constant 1.10451 0.05223 21.15 0.000
A 0.72188 0.04187 17.24 0.000
B -0.02613 0.04256 -0.61 0.556
A^2 0.25667 0.04582 5.60 0.001
B^2 -0.09691 0.04823 -2.01 0.079
S = 0.116967 R-Sq=97.7 % R-Sq(adj)=96.6 %
Based on the model adequacy checking for simple part and complex part - to check the normality assumption, independence assumption, and non-constant variance - the analysis of variance procedure is an exact test of hypothesis of no differences in treatment means.
Then, because time is not measured and the time data is based on the estimated time from the software, the estimated time can be modeled based in the estimated regression coefficient for either simple and complex part. The estimated regression coefficient for simple and complex part are shown in table 9 and 10 respectively. In addition, the best prediction of time model for simple and complex model are shown as equation 3 and 4 respectively.
Time = 34,69 – 32,6708 HDP + 9,2504 HDP2 (3) Where:
HDP : height direction pitch
Time = 34,04 – 51,734 HDP + 14,7507 HDP2 (4) Where:
HDP : height direction pitch
Table 9. Estimated Coefficients of Time for Simple Part
Predictor Coef SE Coef T P
Constant 8.8340 0.3285 26.89 0.000 B -6.2653 0.3266 -19.18 0.000 B^2 3.3306 0.3688 9.03 0.000 S = 0.897693 R-Sq=97.8 % R-Sq(adj)=97.4 %
Table 10. Estimated Coefficients of Time for Complex Part
Predictor Coef SE Coef T P
B -9.7951 0.4769 -20.54 0.000 B^2 5.3089 0.5385 9.86 0.000 S = 1.31073 R-Sq=98.1 % R-Sq(adj)=97.7 %
To achieve the most similar rotational part model to the model generated by the smallest value of scanning pitch, the optimizer of Minitab 14.0 is used. The best simple rotational part model is achieved for height direction pitch equal to 2 mm. By using this value of height direction pitch, the value of the texture is 1.5152 and the required time of scanning is 6.3891 minutes. Meanwhile, the best complex rotational part model is achieved for circumferential pitch 0.36 degree and height direction pitch equal to 1.8 mm. By using these value of height direction pitch, the value of the texture is 0.4313 and the required time of scanning is 8.5514 minutes.
4. CONCLUSION
In reverse engineering process, in particularly digitizing process, for a simple rotational part modeling, the quality of simple part model is influenced only by height direction pitch. The optimum quality of part model is achieved by using height direction pitch equal to 2 mm. The optimum quality of part model has the value of texture is 1.5152 and the required time is 6.3891 minutes.
Meanwhile, the quality of complex part model is influenced by circumferential pitch and height direction pitch. The optimum quality of complex part model is achieved by using circumferential pitch equal to 0.36 degree and height direction pitch equal to 1.8 mm. The optimum quality of complex part model has the value of texture is 0.4313 and the required time is 8.5514
minutes.
5. REFERENCES
Y.H. Chen and C.T. Ng (1997). Integrated Reverse Engineering and Rapid Prototyping, Computers and industrial Engineering, 33(3-4), 481-484
Motavalli, S. (1998). Review of Reverse Engineering Approaches, Computers & Industrial Engineering, 35(1-2), 25-28
Chang, M.H., Park, S. C. (2008). Reverse Engineering of a Symmetric Object, Computers & Industrial Engineering, 55(2), 311-320
Hsiao, S.W., Chuang, J.C. (2003). A reverse Engineering Based Approach for Product Form Design, Design Studies, 24(2), 155-171
Rho, H.M., Jun, Y.T., Park, S.Y., Choi, H. R. (2002). A Rapid Reverse Engineering System for Reproducing 3D Human Busts, CIRP Annals - Manufacturing Technology, 51(1), 139-143
Barbero, B.R. (2009). The Recovery of Design Intent in Reverse Engineering Problems, Computers & Industrial Engineering, 56(4), 1265-1275
Liu, Z.K., Wang, L.H., Lu, B.H. (2006). Integrating Cross-sectional Imaging based Reverse Engineering with Rapid Prototyping, Computers in Industry, 57(2) 131-140
Lee, K.H., Woo, H. (1998). Use of Reverse Engineering Method for Rapid Product Development, Computers & Industrial Engineering, 35(1-2), 21-24