THIS REPORT CONTAINS ASSESSMENTS OF COMMODITY AND TRADE ISSUES MADE BY USDA STAFF AND NOT NECESSARILY STATEMENTS OF OFFICIAL U.S. GOVERNMENT POLICY
Date: GAIN Report Number:
Approved By:
Prepared By:
Report Highlights:
Japanese domestic broiler production is forecast to reach a new record-high in 2017 on lower input costs and higher farm gate prices. Strong broiler consumption growth in food service and ready-to-eat foods is anticipated to drive imports up in 2017 though market saturation and cross-commodity
competition may have a dampening effect in 2018. Production is forecast to remain flat in 2018 as year-end stocks decrease slightly to offset reduced imports.
Kakuyu Obara, Agricultural Specialist Alexander Blamberg, Agricultural Attaché
2017 Market Situation Summary and 2018 Outlook
Poultry and Products Annual
Japan
JA7113
9/16/2017
Executive Summary:
Following record-high domestic broiler production in Japan in 2016, FAS/Tokyo forecasts even higher production in 2017 at 1.44 million MT (up 1.3% from 2016) on lower input costs and higher farm gate prices. Total broiler imports are forecast to grow three percent in 2017 to roughly one million MT driven largely by growth in prepared broiler product imports from Thailand and China. Total broiler consumption in 2017 is anticipated to surpass last year’s record high, up two percent to 2.435 million MT on increased demand for ready-to-eat cooked products. Production is forecast to remain stable in 2018 as lower imports reflect an anticipated dampening of demand on strong cross-commodity
competition from beef and pork in the retail sector. Year-ending broiler stocks are projected flat in 2017 with a modest decline in 2018 to offset flat production and marginally lower imports.
Commodities:
Production, Supply and Demand Data Statistics: Broiler PS&D Table
Poultry, Meat, Broiler 2016 2017 2018
Market Begin Year Jan 2016 Jan 2017 Jan 2018
Japan USDA Official New Post USDA Official New Post USDA Official New Post
Inventory (Reference) 134 134 133 135 0 135
Slaughter (Reference) 680 677 675 680 0 680
Beginning Stocks 137 137 146 146 0 146
Production 1440 1431 1440 1440 0 1440
Total Imports 973 973 960 1005 0 990
Total Supply 2550 2541 2546 2591 0 2576
Total Exports 10 9 10 10 0 10
Human Consumption 2394 2386 2390 2435 0 2425
Other Use, Losses 0 0 0 0 0 0
Total Dom. Consumption 2394 2386 2390 2435 0 2425
Total Use 2404 2395 2400 2445 0 2435
Ending Stocks 146 146 146 146 0 141
Total Distribution 2550 2541 2546 2591 0 2576
(MIL HEAD) ,(1000 MT)
Preface:
This report is an update to JA6026Japan Poultry and Products Annual dated October 12, 2016 and the production, supply, and distribution (PS&D) mid-term revision in February 2017 (reflected in USDA official numbers in the PS&D table above). The table has been adjusted to reflect recently published official numbers for the full calendar year 2016 and year-to-date 2017 (January-July). All references to years in this report are on a calendar year basis unless otherwise noted.
Stocks data includes imported broiler meat (accounting for over 80 percent of total stocks) and domestic poultry meat, but does not include imported prepared and processed products.
Note on General Consumption Patterns in Japan: The Ministry of Agriculture, Forestry, and Fisheries (MAFF) estimates that households (as measured by retail consumption data) consume approximately 40 percent of total broiler meat in Japan. Food service, ready-to-eat food businesses, and other institutional end-users (including catering, central kitchens, etc.) consume 53 percent, with the remaining volumes utilized in processed products. While Japanese domestic chilled raw broiler meat dominates the retail market, imported raw broiler meat and cooked prepared products are extensively used in food service, ready-to-eat food businesses, and other institutional users.
The quantities discussed in this text are on a product weight basis. Conversion rates are not used for import numbers, which are reported on a customs cleared weight.
Broiler:
2017 Market Situation Summary and Update
Japan’s Broiler Demand and Supply Up in 2017, with Consumption and Imports Forecast to Set New Record Highs
Increased stocks in the first half of 2016 gradually unwound in the second half of 2016 through to the first half of 2017, reducing the broiler meat surplus that had built up in the first half of 2016.
Agriculture and Livestock Industry Corporation (ALIC) data showed that June 2017 ending poultry stocks were 10 percent lower compared to June 2016 (at 151,028 MT) as imports of raw broiler meat in the first half of 2017 fell eight percent year-on-year to 259,901 MT (see Note 1 and Table 3). In the same period, domestic production was down slightly from the previous year to 771,770 MT (including small volumes of spent hens and free range chickens).
Note 1: June stocks data by origin showed imported raw broiler meat down 12 percent to 124,136 MT and domestic broiler meat up two percent to 26,892 MT. Imported raw frozen poultry meat accounted for over 80 percent of monthly stocks.
Ministry of Finance trade data showed that Japan’s raw broiler meat imports fell eight percent year-on-year to 300,655 MT through the first seven months of 2017, with imports from Brazil down 15 percent to 220,163 MT, reflecting stock adjustments from 2016. Brazil’s share was reduced by six percentage points to 73 percent over the same period compared to last year, losing ground to Thailand whose share rose six percentage points to 23 percent (or 67,781 MT, up 25 percent). Thailand has sustained
continuous growth since Japan’s lifting of highly pathogenic avian influenza (HPAI) restrictions on raw broiler meat from Thailand in 2014. Despite Brazil’s lower export offers (partly on weaker exchange rates), Brazil’s meat scandal in March this year caused concern among Japanese end-users who switched over to products from Thailand whose export offers are said to be much higher compared to Brazil (Table 4-A).
Over the same period, Japan’s imports of prepared cooked broiler meat increased 14 percent year -on-year to 266,360 MT with Thailand holding a 61 percent share (161,892 MT, up 14 percent) and China holding a 38 percent share (102,052 MT, up 13 percent). Overall growth in this sector can be attributed to Japan’s growing sales of ready-to-eat foods sold at retail and served at food service outlets. China’s export growth this year came largely on Japan’s resumed purchase of kara-age (Japanese style fried chicken using leg meat) on lower Chinese offer prices. Demand for this specific item had previously shifted to Thailand over food safety concerns. Thailand’s growth this year came on increased shipments of popular “salad chicken” (breast meat) items in addition to traditional kara-age type products. China remained a key supplier for cooked yakitori (diced broiled leg meat skewered on bamboo sticks).
Anticipating sustained demand for ready-to-eat food products in 2017, FAS/Tokyo projects Japan’s total broiler meat imports in 2017 to increase three percent year-on-year to 1.005 million MT, surpassing last year’s record high. Although raw broiler meat imports are projected down one percent to 545,000 MT (Brazil down four percent to 400,000 MT; Thailand up 9 percent to 120,000 MT) this is outweighed by a nine percent import increase in cooked prepared broiler products at 460,000 MT (Thailand up seven percent to 275,000 MT; China, up 10 percent to 180,000 MT). The first half reduction of Brazil’s raw broiler meat exports is expected to recover somewhat in the second half on industry accounts that a significant volume of Brazilian broiler shipments are due to arrive in Japan in the coming months.
Japanese domestic production is projected slightly higher at 1.44 million MT on higher farm gate prices (averaging 2,284 yen/10 kg) in the first half of 2017 and slightly lower formula mix feed prices
(averaging 69,855 yen/MT). Japanese total broiler consumption in 2017 appears to be on course to reach another record high, projected at 2.435 million MT, up two percent over the previous year, with growth mainly attributed to increased consumption of ready-to-eat cooked broiler meat products. Growth may be moderated somewhat by cross-commodity competition in the retail segment with beef and pork (see Note 2).
Note 2: FAS/Tokyo provided data in the latest Livestock and Products Annual (JA7110 dated September 5, 2017) from the Japan Food Service Association indicating that growing sales in the Japanese food service and ready-to-eat foods sectors contributed to increased consumption of beef and pork in 2017.
2018 Outlook
FAS/Tokyo anticipates Japanese broiler market dynamics to hold relatively stable in 2018 as Japanese food service and ready-to-eat food business sectors, which pushed overall animal protein consumption upward over the previous year, continue to support high levels of poultry consumption. As cross-commodity competition intensifies, FAS/Tokyo projects total Japanese broiler meat consumption in 2018 to decrease just slightly from the previous year to 2.425 million MT. Imports of raw broiler meat in 2018 are projected down slightly to 540,000 MT, but maintaining a higher level than 2016. Import growth from Brazil is expected to be curtailed by strong competition from Thailand. FAS/Tokyo projects moderately lower imports of prepared cooked broiler meat products, down two percent to 450,000 MT with market shares for Thailand and China holding steady at 60 percent and 39 percent, respectively.
Japanese domestic broiler production in 2018 is projected to remain flat at 1.44 million MT, supported by an anticipated (albeit moderate) price recovery and relatively stable prices for formula mixed feeds. However, growing sales competition with beef and pork in the retail sector are expected to apply downward pressure on market prices for domestic broiler meat, dampening potential production
growth. As a result of lower imports and moderate consumption, 2018 year-ending stocks are estimated to decrease slightly to 141,000 MT.
Supplemental Tables:
Table 1: Average Household Expenditures and Quantities Purchased of Selected Commodities YTD
(Two or more persons per household) 2012 18,173 6,765 23,771 18,770 12,769 14,614 2013 19,559 6,894 24,989 19,460 13,260 15,133
% Chg. 8% 2% 5% 4% 4% 4%
2014 21,120 6,584 27,622 19,288 14,527 15,491
% Chg. 8% -4% 11% -1% 10% 2%
2015 21,125 6,208 29,713 19,869 15,307 15,691
% Chg. 0% -6% 8% 3% 5% 1%
2016 21,837 6,437 29,466 20,421 15,290 16,238
% Chg. 3% 4% -1% 3% 0% 3%
Yen) (Grams) Yen) (Grams) Yen) (Grams) Source: Ministry of Internal Affairs and Communication Bureau
2012 1,920 1,860 5,626 3,059 7,076 5,466 2013 1,952 1,848 5,630 3,007 7,211 5,524
% Chg. -3% -2% 0% 1% 0% 1%
2014 2,256 1,912 5,833 2,891 7,467 5,371
% Chg. 16% 3% 4% -4% 4% -3%
2015 2,430 1,871 5,807 2,863 7,189 5,132
% Chg. 8% -2% 0% -1% -4% -4%
2016 Total 2,487 1,941 5,504 2,769 7,387 5,226
% Chg. 2% 4% -5% -3% 3% 2% Source: Ministry of Internal Affairs and Communication Bureau
Bacon Yakitori Cutlet
2013 2,417 1,476 1,911 1,603
% Chg. -1% -1% 3% 2%
2014 2,601 1,479 2,012 1,746
% Chg. 8% 0% 5% 9%
2015 2,655 1,481 2,157 1,870
% Chg. 2% 0% 7% 7%
2016 2,600 1,472 1,862 2,248
% Chg. -2% -1% -14% 20%
Bacon Cutlet Yakitori
Expenditure (JP Yen)
Quantity (Grams)
Expenditure (JP Yen)
Quantity (Grams)
Expenditure (JP Yen)
Quantity (Grams) Jan. 184 -6% 104 -10% 146 -1% 171 23% Feb. 210 0% 113 -4% 156 8% 156 7% Mar. 223 -7% 129 -1% 168 -8% 179 10% Apr. 218 -6% 126 0% 162 -7% 177 9% May 228 -5% 128 -1% 170 -10% 204 26% Jun. 224 -5% 128 -5% 154 -5% 175 14% Jul. 215 0% 125 2% 162 -21% 222 38% Aug. 225 6% 122 6% 160 -35% 258 61% Sept. 215 -5% 123 -1% 150 -18% 170 12% Oct. 221 -1% 127 -1% 152 -16% 191 19% Nov. 216 0% 124 1% 140 -9% 152 -1% Dec. 221 5% 123 7% 142 -26% 193 22% 2016 Total 2,600 1,472 1,862 2,248
Expenditure (JP Yen)
Quantity (Grams)
Expenditure (JP Yen)
Quantity (Grams)
Expenditure (JP Yen)
Quantity (Grams) Jan. 192 4% 104 0% 150 3% 154 -10% Feb. 198 -6% 114 1% 146 -6% 146 -6% Mar. 222 0% 131 2% 156 -7% 170 -5% Apr. 213 -2% 128 2% 164 1% 188 6% May 232 2% 136 6% 159 -6% 213 4% Jun. 223 0% 128 0% 169 10% 186 6% 2016 (Jan -
Jun) 1,287 728 956 1,062 2017 (Jan -
June) 1,280 741 944 1,057 % Chg. -1% 2% -1% 0% Source: Ministry of Internal Affairs and Communication Bureau
Table 2: Monthly Average Wholesale Price of Domestic Broiler Meat (Fresh/Chilled)
Unit: JP Yen per Kg.
Bone-less Leg
2013 2014 % chg. 2015 % chg. 2016 % chg. 2017 % chg.
Jan. 642 710 11% 681 -4% 690 1% 703 2%
Feb. 622 682 10% 661 -3% 652 -1% 703 8%
Mar. 596 662 11% 653 -1% 637 -2% 688 8%
Apr. 574 637 11% 650 2% 633 -3% 669 6%
May 567 620 9% 633 2% 632 0% 656 4%
Jun. 544 600 10% 620 3% 620 0% 638 3%
Jul. 534 581 9% 628 8% 614 -2% 600 -2%
Aug. 540 569 5% 625 10% 608 -3% 574 -6%
Sep. 577 590 2% 633 7% 610 -4%
Oct. 615 617 0% 660 7% 640 -3%
Nov. 646 634 -2% 672 6% 659 -2%
Dec. 690 671 -3% 689 3% 684 -1%
1st Qtr. Ave. 620 685 10% 665 -3% 660 -1% 698 6% 2nd Qtr. Ave. 562 619 10% 634 2% 629 -1% 654 4% 3rd Qtr. Ave. 550 580 5% 629 8% 610 -3% 4th Qtr. Ave. 650 641 -1% 674 5% 661 -2%
Year Ave. 596 631 6% 650 3% 640 -2%
Breast
2013 2014 % chg. 2015 % chg. 2016 % chg. 2017 % chg.
Jan. 222 265 19% 330 25% 298 -10% 270 -9%
Feb. 210 268 28% 331 24% 272 -18% 291 7%
Mar. 215 271 26% 338 25% 263 -22% 313 19%
Apr. 222 272 23% 336 24% 257 -24% 327 27%
May 231 278 20% 337 21% 255 -24% 340 33%
Jun. 264 291 10% 342 18% 248 -27% 342 38%
Jul. 276 291 5% 350 20% 245 -30% 333 36%
Aug. 284 299 5% 353 18% 251 -29% 327 30%
Sep. 282 315 12% 351 11% 259 -26%
Oct. 277 330 19% 349 6% 276 -21%
Nov. 270 332 23% 344 4% 284 -18%
Dec. 268 327 22% 327 0% 275 -16%
1st Qtr. Ave. 216 268 24% 333 24% 278 -17% 292 5% 2nd Qtr. Ave. 239 280 17% 338 21% 253 -25% 336 33% 3rd Qtr. Ave. 281 302 7% 351 16% 252 -28% 4th Qtr. Ave. 272 330 21% 340 3% 278 -18%
Year Ave. 252 295 17% 341 16% 265 -22%
Source: ALIC Monthly Statistics (Quarterly average price is compiled by FAS Tokyo based on original ALIC monthly data.)
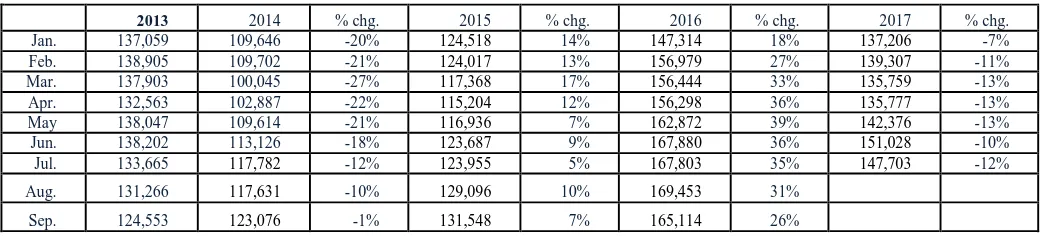
Table 3: Monthly Ending Stocks of Poultry Meat YTD
Unit: Metric Ton
2013 2014 % chg. 2015 % chg. 2016 % chg. 2017 % chg.
Jan. 137,059 109,646 -20% 124,518 14% 147,314 18% 137,206 -7%
Feb. 138,905 109,702 -21% 124,017 13% 156,979 27% 139,307 -11%
Mar. 137,903 100,045 -27% 117,368 17% 156,444 33% 135,759 -13%
Apr. 132,563 102,887 -22% 115,204 12% 156,298 36% 135,777 -13%
May 138,047 109,614 -21% 116,936 7% 162,872 39% 142,376 -13%
Jun. 138,202 113,126 -18% 123,687 9% 167,880 36% 151,028 -10%
Jul. 133,665 117,782 -12% 123,955 5% 167,803 35% 147,703 -12%
Aug. 131,266 117,631 -10% 129,096 10% 169,453 31%
Oct. 120,096 122,686 2% 141,128 15% 164,984 17%
Nov. 108,073 124,452 15% 141,413 14% 161,771 14%
Dec. 101,532 118,017 16% 137,396 16% 146,058 6%
Source: ALIC Monthly Statistics
Note: Figures represents the poultry meat estimates. Imported poultry cuts roughly accounts roughly 80% of ending stocks on the average with the majority being broiler meat.
Table 4-A: Japanese Imports of Broiler Meat/CIF Price YTD
Unit: Metric Ton (Customs Clearance Basis)
Partner Country Calendar Year Year To Date
2013 2014 % Chg. 2015 % Chg. 2016 % Chg. 07/2016 07/2017 % Chg.
World 414,243 475,225 15% 529,458 11% 551,181 4% 328,342 300,655 -8% Brazil 387,202 399,294 3% 408,923 2% 415,827 2% 258,834 220,163 -15% Thailand 0 44,617 n/a 92,347 107% 109,906 19% 54,414 67,781 25% United States 22,460 25,874 15% 22,702 -12% 20,953 -8% 11,889 10,609 -11% Australia 0 0 n/a 1,774 n/a 2,019 14% 1,691 704 -58% Philippines 3,618 4,599 27% 2,353 -49% 1,295 -45% 721 644 -11% Others 963 841 -13% 1,359 62% 1,181 -13% 793 754 -5% Source of Data: Global Trade Atlas (Japan Ministry of Finance)
Unit: U.S. Dollar per Metric Ton
Partner Country Calendar Year Year To Date
2013 2014 % Chg. 2015 % Chg. 2016 % Chg. 07/2016 07/2017 % Chg.
World 2,712 2,800 3% 2,473 -12% 2,024 -18% 1,973 2,212 12% Brazil 2,722 2,769 2% 2,403 -13% 1,861 -23% 1,853 2,016 9% Thailand 0 3,289 n/a 2,878 -12% 2,659 -8% 2,571 2,873 12% United States 2,207 2,243 2% 1,950 -13% 1,777 -9% 1,679 1,939 15% Australia 0 0 n/a 2,357 n/a 2,310 -2% 2,301 2,269 -1% Philippines 4,556 3,791 -17% 3,760 -1% 3,774 0% 3,700 4,543 23% Source of Data: Global Atlas (Japan Ministry of Finance)
Table 4-B: Japanese Imports of Prepared Broiler Products/CIF Price YTD
Unit: Metric Ton (Customs Clearance Basis)
Partner Country Calendar Year Year To Date
2013 2014 % Chg. 2015 % Chg. 2016 % Chg. 07/2016 07/2017 % Chg.
World 439,965 412,451 -6% 406,127 -2% 422,016 4% 233,156 266,360 14% Thailand 214,158 197,425 -8% 232,998 18% 255,496 10% 141,544 161,892 14% China 220,923 212,417 -4% 170,917 -20% 163,373 -4% 90,408 102,052 13% Brazil 2,732 949 -65% 863 -9% 1,879 118% 651 1,770 172% Korea, South 1,179 859 -27% 909 6% 876 -4% 367 432 18% Philippines 228 279 22% 244 -13% 169 -31% 89 77 -13% Others 745 522 -30% 196 -62% 223 14% 97 137 41% Source of Data: Global Trade Atlas (Japan Ministry of Finance)
Partner Country
Calendar Year Year To Date
World 100% 100% 0% 100% 0% 100% 0% 100% 100% 0% Thailand 49% 48% -1% 57% 10% 61% 3% 61% 61% 0% China 50% 52% 1% 42% -9% 39% -3% 39% 38% 0%
Brazil 1% 0% 0% 0% 0% 0% 0% 0% 1% 0%
Korea, South 0% 0% 0% 0% 0% 0% 0% 0% 0% 0% Philippines 0% 0% 0% 0% 0% 0% 0% 0% 0% 0%
Others 0% 0% 0% 0% 0% 0% 0% 0% 0% 0%
Source of Data: Global Trade Atlas (Japan Ministry of Finance)
Unit: U.S. Dollars per Metric Ton
Partner Country Calendar Year Year To Date
2013 2014 % Chg. 2015 % Chg. 2016 % Chg. 07/2016 07/2017 % Chg.
World 4,834 4,702 -3% 4,641 -1% 4,580 -1% 4,617 4,619 0% Thailand 5,095 4,911 -4% 4,822 -2% 4,793 -1% 4,812 4,794 0% China 4,611 4,517 -2% 4,403 -3% 4,264 -3% 4,322 4,365 1% Brazil 2,595 2,633 1% 2,721 3% 2,911 7% 2,760 3,102 12% Korea, South 4,528 4,364 -4% 4,033 -8% 4,332 7% 4,538 4,413 -3% Philippines 6,530 5,964 -9% 6,510 9% 6,090 -6% 6,149 6,070 -1% Source of Data: Global Atlas (Japan Ministry of Finance)