Summary Photosynthetic O2 evolution at high irradiances (approximately 600--1000 µmol m−2 s−1) and O
2 uptake in darkness were measured in needles of control, irrigated and irrigated-fertilized trees of Norway spruce (Picea abies (L.) Karst.). Measurements were made at 20 °C and at high CO2 concentrations. The results suggest that, at given times of the year, a major part of the variation in gross photosynthesis of current-year and one-year-old needles across treatments is associated with differences in needle N content. Furthermore, the rate of O2 uptake measured after 5 or 10 min in darkness was positively correlated with both the preceding rate of gross O2 evolution and the N content in fully expanded current-year needles. Measurements of chlorophyll a fluorescence, taken simultaneously with measurements of O2 evolution in current-year sun needles, showed that Stern-Volmer quenching of minimum fluorescence and the ratio of variable to maximum fluorescence in the dark- and light-adapted state were strongly correlated with the gross rate of O2 evolution. This suggests that the increased rate of gross photosynthesis in needles of irrigated-fertilized trees was associated with adjustments in the thermal energy dissipation within photosystem II.
Keywords: dark respiration, fertilization, fluorescence quenching, leaf nitrogen, photosynthesis, Picea abies.
Introduction
A strong positive correlation usually exists between the light-saturated rate of CO2 assimilation (measured at near optimum temperatures, relatively high humidities and CO2 concentra-tions typical of normal air) and foliar N content (Field and Mooney 1986, Evans 1989), because the majority of foliar N is associated with proteins participating in photosynthetic re-actions (Evans 1989, Evans and Seemann 1989). However, there is variation in this relationship among different species, especially when photosynthetic rates and foliar N contents are expressed on a leaf area basis (Evans 1989). The relationship between photosynthetic capacity and foliar N content in the field is less well documented for evergreen conifers than for other higher plants. Vapaavuori et al. (1995) found a significant correlation between the light-saturated rate of CO2 assimila-tion and foliar N content (both expressed on a dry mass basis)
in one-year-old shoots of Scots pine (Pinus sylvestris L.) collected from mid-June to mid-August from four sites with different fertility. Smolander and Oker-Blom (1989) also found that the light-saturated rate of CO2 assimilation was correlated with the foliar N content in one-year-old needles of Scots pine in June. However, fertilization of conifers in the field may have little or no effect on the rate of net photosyn-thesis (Sheriff et al. 1986, Teskey et al. 1994a), which may be a result of nutrient imbalances induced by the treatments (Teskey et al. 1994b). Imbalances between nutrient elements in the foliage are probably less common in field experiments in which a complete nutrient solution is supplied with the irrigation water. In one such experiment, one-year-old shoots of irrigated-fertilized (IL) trees of Scots pine had an in situ rate of CO2 assimilation approximately 20% greater than corre-sponding shoots of irrigated (I) trees over a wide range of temperatures and incident irradiances (Linder and Troeng 1980). However, shoots of IL trees of Pinus radiata D. Don had a higher rate of CO2 assimilation than shoots of I trees only when stomatal conductances were high (Thompson and Wheeler 1992).
Several studies have shown that the photosynthetic rate at any intercellular partial pressure of CO2 increases with increas-ing foliar N content (e.g., Evans and Terashima 1988, Sage et al. 1990, Makino et al. 1994, Tan and Hogan 1995). Accord-ing to the photosynthetic model of Farquhar and von Caem-merer (1982), the photosynthetic rate at low intercellular partial pressures of CO2 is limited by Rubisco activity, and the rate at higher intercellular partial pressures of CO2 is limited by electron transport capacity. However, photosynthesis under saturating CO2 conditions may also be limited by the capacity of starch and sucrose synthesis to regenerate orthophosphate for photophosphorylation (Sharkey 1985), especially in leaves with high N contents (Sage et al. 1990, Makino et al. 1994). At high partial pressures of CO2, the rate of O2 evolution appeared to be equivalent to the rate of CO2 assimilation in leaves of spinach (Spinacia oleracea L.) with varying N contents (Evans and Terashima 1988).
Measurements of O2 exchange have recently been used to investigate seasonal changes in photosynthesis of Norway spruce (Picea abies (L.) Karst.) (Strand 1995, Strand and Lundmark 1995). The CO2-saturated rate of gross O2 evolution
Effect of mineral nutrient content on oxygen exchange and
chlorophyll a fluorescence in needles of Norway spruce
MARTIN STRAND
Department of Forest Genetics and Plant Physiology, The Swedish University of Agricultural Sciences, S-901 83 Umeå, Sweden
Received June 27, 1996
at high irradiances in current-year and one-year-old needles from the upper part of the canopy of IL trees was generally higher than in corresponding needles of control (C) trees. Furthermore, measurements of chlorophyll a fluorescence showed that treatment-related differences in the rate of gross O2 evolution were accompanied by a higher maximum photo-chemical efficiency of photosystem II (FV/FM) in needles of IL trees than in those of C trees. In this long-term field experi-ment, the mineral nutrient content of foliage was extensively investigated (Linder 1995). The N content was markedly higher in needles from the fourth whorl of IL trees than in corresponding needles of C trees, indicating that the CO2 -satu-rated rate of photosynthesis at high irradiances may be corre-lated with N content. To examine this hypothesis more closely, the content of mineral nutrients was analyzed in needles for which the gross rate of O2 evolution was known from previous studies (Strand 1995, Strand and Lundmark 1995). In addition, new samples of current-year needles were collected from C, I and IL trees to document the interrelationships between oxy-gen exchange (photosynthetic O2 evolution at high irradiances and O2 uptake in darkness), chlorophyll a fluorescence and content of mineral nutrients.
Materials and methods
Experimental site and plant material
The plant material for this investigation was obtained from the Flakaliden research area (64°07′ N, 19°27′ E, altitude 310--320 m above sea level). The area, which is located about 50 km northwest of Umeå in northern Sweden, was planted with Norway spruce (Picea abies) seedlings of local provenance in 1963 after clear-felling. Different plots at the experimental site were given the following treatments: irrigation (I), annual application of a complete mix of solid fertilizers (F) and irrigation plus liquid fertilization (IL), in addition to the con-trol (C). In the IL treatment, a complete nutrient solution was injected into the irrigation water and applied every day during the growing season. The treatments commenced in 1987 when the mean height of the trees was about 2.6 m. More detailed descriptions of the experimental site and treatments are given in Flower-Ellis (1993) and Linder (1995). In the study de-scribed here, trees from the C-, I- and IL-treated plots were investigated.
From April 6 to August 11, 1992, second-order one-year-old shoots were collected from south-facing branches of the sev-enth whorl from the top of each of five trees from a C and an IL plot. Second-order current-year sun shoots were collected from south-facing branches of the third whorl of the same trees on September 23 and December 8, 1992. Current-year shade shoots were collected from the lowest branches of five other trees from the same plots on October 7 and December 14, 1992. In 1993, second-order current-year sun shoots were collected from south-facing branches of the third whorl of five trees from each of four C, two I and four IL plots over a 2-week period (September 12 to September 28). Samples were stored in darkness at 0 °C, and measurements were made after at least
2 h, but within three days. No consistent change in the meas-ured characteristics occurred during the storage period.
Measurements of oxygen exchange and chlorophyll fluorescence
Oxygen exchange of needles was measured at 20 °C and 5 kPa CO2 with a leaf-disc oxygen electrode (LD2 with control box CB1; Hansatech Ltd., King’s Lynn, U.K.). Use of this equip-ment has been described by Strand (1995) and Strand and Lundmark (1995) for samples collected in 1992. For samples collected in September 1993, chlorophyll a fluorescence was measured simultaneously with O2 exchange using an adapted top window for the fiber optic cable of the modulation fluorometer (PAM Chlorophyll Fluorometer; H. Walz, Effel-trich, Germany), described by Schreiber et al. (1986). The fluorescence nomenclature of van Kooten and Snel (1990) has been adopted.
Each sample had a projected area of 2.1 ± 0.2 cm2 (mean ± SD), and consisted of needles detached from shoots stored in darkness at 0 °C for at least 2 h. Samples were enclosed in the leaf-disc chamber in darkness and excited with a weak meas-uring beam from a pulsed light-emitting diode to obtain the minimum (dark) fluorescence yield (F0). To determine the maximum fluorescence yield (FM), each sample was then exposed to a 1-s saturating pulse of white light from a modified Schott fiber illuminator KL 1500 (FL 103; H. Walz). Follow-ing determination of F0 and FM, needles were illuminated with actinic white light from a Schott fiber illuminator (FL 101; H. Walz) for approximately 30 min. The irradiance was 600 ± 10 µmol m−2 s−1. Maximum fluorescence (FM′) and minimum fluorescence (F0′) in the light-adapted state were determined by applying 1-s saturating pulses at 200-s intervals, and by switching off actinic light, respectively. Variable fluorescence yields, FV and FV′, were calculated as FM− F0 and FM′−F0′, respectively.
Rates of photosynthesis were expressed as the gross rate of O2 evolution; i.e., the sum of O2 evolution in light and O2 uptake in darkness. Dark respiration in light was estimated after 10 min in darkness. Steady-state photochemical quench-ing (qP) was calculated as (FM′− F)/(FM′− F0′), where F is the fluorescence yield in the light-adapted state (van Kooten and Snel 1990). Stern-Volmer non-photochemical quench-ing (SVN) was calculated as FM/FM′− 1 (Krause and Weis 1991), whereas Stern-Volmer F0-quenching was calculated as
F0/F0′− 1. The quantum efficiency of photosystem II (ΦPSII) was calculated as (FM′− F)/FM′ (Genty et al. 1989).
Irradiance was measured with a quantum sensor (LI-190SB, Li-Cor, Inc., Lincoln, NE). The projected area of needles was determined with a leaf area meter (Delta-T Devices, Cam-bridge, U.K.), and needle dry mass was determined after dry-ing for 24 h at 80 °C.
Chemical analyses
(Perkin-El-mer, Model Plasma 2) after wet digestion with HClO4/HNO3. Analyses were carried out according to the protocol routinely used at the Department of Forest Ecology, the Swedish Univer-sity of Agricultural Sciences, Umeå.
Statistical analyses
Data were analyzed using the StatView statistical package (StatView 4.5, Abacus Concepts Inc., Berkeley, CA). One-way analysis of variance and Fisher’s protected LSD test were used to establish significant differences at P ≤ 0.05 between treat-ment means. However, nonparametric tests (Mann-Whitney’s U-test or Kruskal-Wallis’ test) were used when application of Bartlett’s test for homogeneity of variances indicated signifi-cant differences in variance between treatments. Interrelations between oxygen exchange, chlorophyll fluorescence, and min-eral nutrient content were evaluated with least squares linear and polynomial regression analyses.
Results and discussion
Mass per unit area and mineral nutrient content
Dry mass per unit area in one-year-old needles from the sev-enth whorl was higher after the main recovery of photosynthe-sis in May (Days 132--146) than earlier in the spring (Figures 1A and 1B), but there was no significant difference in mass/area between C and IL trees on any sampling occasion. The variation in mass/area can be explained by seasonal vari-ation in the starch content of one-year-old needles (see Linder 1995). The N content was generally significantly higher in one-year-old needles of IL trees than in those of C trees (Figure 1C). Furthermore, the N content tended to be lower after the main recovery of photosynthesis than earlier in spring. This is consistent with observations of a small decrease in N content during early summer, even when expressed on a struc-tural dry mass basis; i.e., after correction for nonstrucstruc-tural carbohydrates (Flower-Ellis 1993, Linder 1995). The decline in N content during early summer can be attributed to the retranslocation of N to developing needles and shoots (Nam-biar and Fife 1991).
Current-year sun and shade needles were collected from the third whorl and from the bottom of the canopy, respectively, of C and IL trees in both autumn and early winter 1992 (Table 1), whereas in 1993, current-year sun needles from the third whorl of C, I, and IL trees were collected in September only (Table 2). As previously noted for one-year-old needles, mass/area in current-year sun needles was not significantly affected by the treatments (Tables 1 and 2). Sun needles of IL trees had substantially higher contents of N, P, K and S, but a lower content of Ca than sun needles of C trees when expressed on a projected needle area basis (Tables 1 and 2). The content of N and other macronutrients in sun needles of C and I trees did not differ significantly (Table 2). Because mass/area in sun needles was not significantly affected by the treatments (Tables 1 and 2), similar results were obtained when the amount of mineral nutrients in the needles was expressed on a dry mass basis (data not shown).
Shade needles had a lower mass/area ratio than sun needles (Table 1). Furthermore, shade needles of IL trees had a lower mean mass/area than shade needles of C trees, probably as a result of the lower irradiances at the bottom of the canopy in IL-treated plots (data not shown). The lower content of N and other macronutrients in shade needles than in sun needles of C and IL trees was primarily due to differences in mass/area (Table 1). Hence, the amount of N on a dry mass basis was not significantly different between sun and shade needles of either C trees or IL trees (data not shown).
Relationships between gross oxygen evolution and mineral nutrient content
of C trees both before and after the main recovery of photosyn-thesis in spring (Figures 1B and 1C). The slope of the relation-ship between O2 evolution rate and foliar N content across treatments was significant on all three sampling occasions before the recovery of photosynthesis, but on only three of the six sampling occasions following recovery (data not shown). The generally weak photosynthesis--N relationships in one-year-old needles (mean r2 = 0.44 for all sampling occasions) were probably a result of both the small number of samples on each sampling occasion and the relatively small variation in needle N content. However, mean values of O2 evolution rate in needles of C and IL trees on the sampling occasions after the
main recovery of photosynthesis were correlated with mean values of needle N content (r2 = 0.630; P = 0.0021).
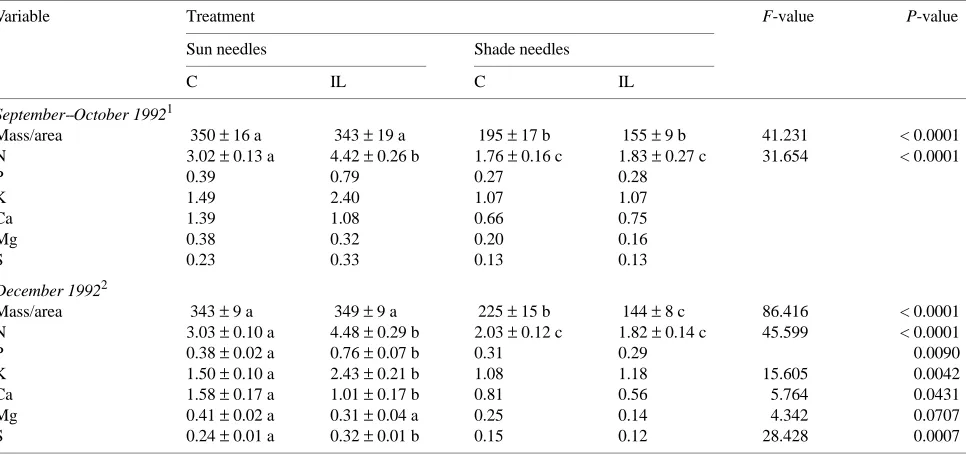
For current-year needles collected in autumn 1992, O2 evo-lution rate was correlated with needle N content when the latter varied in response to irrigation-fertilization and gradients of light availability (Figure 2A). The existence of linear relation-ships between the light-saturated rate of CO2 assimilation or O2 evolution and leaf N content along gradients of light avail-ability in canopies has been demonstrated in several studies (e.g., Hirose and Werger 1987, DeJong et al. 1989, Ellsworth and Reich 1993, Evans 1993). DeJong et al. (1989) found that the photosynthesis--N relationship across canopy light gradi-Table 1. Dry mass and content of macronutrients expressed on a projected area basis (g m−2) in current-year needles of control (C) and irrigated-fertilized (IL) Picea abies. Means ± SE are shown for n = 4--5. Other values represent pooled samples from 4--5 trees. Within a row, significant differences (P ≤ 0.05) are marked by different letters.
Variable Treatment F-value P-value
Sun needles Shade needles
C IL C IL
September--October 19921
Mass/area 350 ± 16 a 343 ± 19 a 195 ± 17 b 155 ± 9 b 41.231 < 0.0001
N 3.02 ± 0.13 a 4.42 ± 0.26 b 1.76 ± 0.16 c 1.83 ± 0.27 c 31.654 < 0.0001
P 0.39 0.79 0.27 0.28
K 1.49 2.40 1.07 1.07
Ca 1.39 1.08 0.66 0.75
Mg 0.38 0.32 0.20 0.16
S 0.23 0.33 0.13 0.13
December 19922
Mass/area 343 ± 9 a 349 ± 9 a 225 ± 15 b 144 ± 8 c 86.416 < 0.0001
N 3.03 ± 0.10 a 4.48 ± 0.29 b 2.03 ± 0.12 c 1.82 ± 0.14 c 45.599 < 0.0001
P 0.38 ± 0.02 a 0.76 ± 0.07 b 0.31 0.29 0.0090
K 1.50 ± 0.10 a 2.43 ± 0.21 b 1.08 1.18 15.605 0.0042
Ca 1.58 ± 0.17 a 1.01 ± 0.17 b 0.81 0.56 5.764 0.0431
Mg 0.41 ± 0.02 a 0.31 ± 0.04 a 0.25 0.14 4.342 0.0707
S 0.24 ± 0.01 a 0.32 ± 0.01 b 0.15 0.12 28.428 0.0007
1 Sun and shade needles were collected on September 23 and October 7, respectively. 2 Sun and shade needles were collected on December 8 and December 14, respectively.
Table 2. Dry mass and content of macronutrients expressed on a projected area basis (g m−2) in current-year needles from the third whorl of control (C), irrigated (I) and irrigated-fertilized (IL) Picea abies. Samples were collected from September 12 to September 28, 1993. Means ± SE are shown. Within a row, significant differences (P ≤ 0.05) are marked by different letters.
Variable Treatment F-value P-value
C (n = 20) I (n = 10) IL (n = 20)
Mass/area 361 ± 8 a 381 ± 11 a 370 ± 8 a 1.242 0.2980
N 3.79 ± 0.11 a 3.38 ± 0.20 a 5.15 ± 0.17 b 33.321 < 0.0001
P 0.55 ± 0.02 a 0.49 ± 0.03 a 0.89 ± 0.04 b 47.374 < 0.0001
K 2.05 ± 0.12 a 1.79 ± 0.10 a 3.02 ± 0.11 b 30.029 < 0.0001
Ca 1.29 ± 0.07 a 1.32 ± 0.06 a 1.10 ± 0.06 b 3.423 0.0410
Mg 0.34 ± 0.01 a 0.33 ± 0.02 a 0.34 ± 0.01 a 0.206 0.8146
ents was different in N-fertilized and unfertilized trees of Prunus persica (L.) Batsch., but no such difference between treatments was observed in current-year needles of Norway spruce in this study.
The relationship between O2 evolution rate and foliar N content across treatments and canopy light gradients appeared to be maintained from autumn to early winter (Figure 2A). Some variation in this relationship might be expected during the winter because winter inhibition of the near light-saturated rate of O2 evolution has been found to differ in sun and shade needles, irrespective of treatment (Strand 1995). Furthermore, the inhibition of the rate of O2 evolution at high irradiances appeared to be more pronounced in shade needles of IL trees than in shade needles of C trees (Strand 1995). However, the potential rate of photosynthesis in the upper part of the canopy may be dependent on needle N content throughout the winter,
as indicated by the significantly higher rate of O2 evolution in one-year-old needles of IL trees than in one-year-old needles of C trees during late winter and spring (Figure 1B).
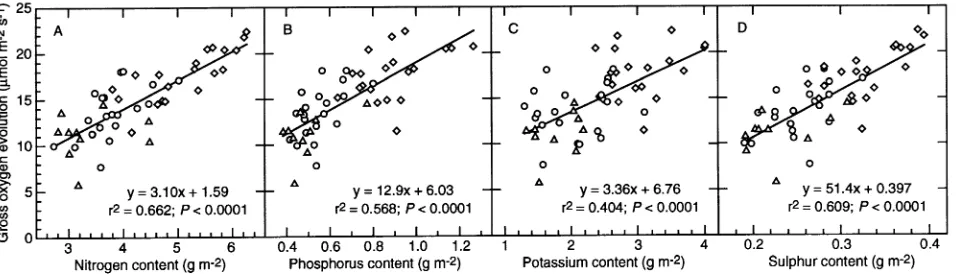
The relationship between O2 evolution rate and mineral nutrient content in current-year needles from the third whorl was further investigated in September 1993. As previously found for current-year needles in 1992 (Strand 1995), the gross rate of O2 evolution at an irradiance of 600 µmol m−2 s−1, whether expressed on a projected needle area basis or on a dry mass basis, was significantly higher in needles of IL trees than in needles of C trees (Table 3). Furthermore, needles of I trees had a significantly lower rate of O2 evolution than needles of C trees (Table 3). A relatively strong relationship between the gross rate of O2 evolution and foliar N content was obtained across treatments (Figure 3A). This is in agreement with the strong positive correlation often observed between CO2
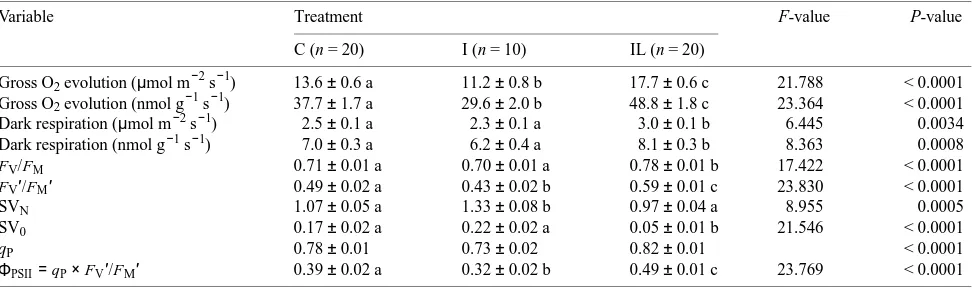
-satu-Table 3. Rates of gross oxygen evolution and dark respiration (expressed on a projected needle area basis and on a dry mass basis), and characteristics of chlorophyll fluorescence, including the ratio of variable to maximum fluorescence in darkness (FV/FM) and in light (FV′/FM′), Stern-Volmer nonphotochemical quenching (SVN), Stern-Volmer quenching of minimum fluorescence (SV0), photochemical quenching (qP), and quantum efficiency of PS II (ΦPSII) in current-year needles from the third whorl of control (C), irrigated (I) and irrigated-fertilized (IL) Picea abies. Steady-state measurements of the rate of gross O2 evolution and fluorescence characteristics were made at an irradiance of 600 ± 10 µmol m−2 s−1. The rate of dark respiration was measured as O2 uptake after 10 min in darkness. Samples were collected from September 12 to September 28, 1993. Means ± SE are shown. Within a row, significant differences between treatments (P ≤ 0.05) are marked by different letters.
Variable Treatment F-value P-value
C (n = 20) I (n = 10) IL (n = 20)
Gross O2 evolution (µmol m−2 s−1) 13.6 ± 0.6 a 11.2 ± 0.8 b 17.7 ± 0.6 c 21.788 < 0.0001 Gross O2 evolution (nmol g−1 s−1) 37.7 ± 1.7 a 29.6 ± 2.0 b 48.8 ± 1.8 c 23.364 < 0.0001 Dark respiration (µmol m−2 s−1) 2.5 ± 0.1 a 2.3 ± 0.1 a 3.0 ± 0.1 b 6.445 0.0034 Dark respiration (nmol g−1 s−1) 7.0 ± 0.3 a 6.2 ± 0.4 a 8.1 ± 0.3 b 8.363 0.0008
FV/FM 0.71 ± 0.01 a 0.70 ± 0.01 a 0.78 ± 0.01 b 17.422 < 0.0001
FV′/FM′ 0.49 ± 0.02 a 0.43 ± 0.02 b 0.59 ± 0.01 c 23.830 < 0.0001
SVN 1.07 ± 0.05 a 1.33 ± 0.08 b 0.97 ± 0.04 a 8.955 0.0005
SV0 0.17 ± 0.02 a 0.22 ± 0.02 a 0.05 ± 0.01 b 21.546 < 0.0001
qP 0.78 ± 0.01 0.73 ± 0.02 0.82 ± 0.01 < 0.0001
rated rate of CO2 assimilation and foliar N content in response to varying N nutrition (e.g., Seemann et al. 1987, Sage et al. 1990, Tan and Hogan 1995). The relationship plotted in Fig-ure 3A was based on samples collected from different trees on four occasions over a two-week period. On one of these sam-pling occasions, needles from all three treatments had low rates of gross photosynthesis in relation to their N content (data not shown), and r2 increased from 0.662 to 0.737 if these data were excluded. No plausible explanation, such as exceptional weather conditions, could be found for the low rate of gross O2 evolution on this occasion.
The rate of gross O2 evolution was strongly correlated with the contents of P, K and S in the needles both in autumn and early winter of 1992 (Figures 2B--D), partly because these relationships were based on mean values (O2 evolution rate) or values representing pooled samples (content of mineral nutri-ents). In September 1993, linear regressions of O2 evolution rate with needle P, K and S contents indicated that the rate of O2 evolution was almost equally well correlated with the contents of P (Figure 3B) and S (Figure 3D) as with the content of N, but the relationship between O2 evolution rate and K content was weaker (Figure 3C). These relationships may have arisen because needle P, K and S contents were correlated with N content (r2 = 0.49--0.81). Consequently, it was not surprising that only the regression coefficient for N content was signifi-cant in a multiple regression analysis with O2 evolution rate as the dependent variable and needle N, P, K and S contents as independent variables. Furthermore, growth (and presumably also photosynthetic electron transport) was not limited by P, K, or S because ratios of these elements to N (data not shown) were above those considered critical (see Linder 1995). No relationship between the rate of O2 evolution and the foliar content of Ca (r2 = 0.007; P = 0.57) or Mg (r2 = 0.029; P = 0.24) was observed for current-year needles in September 1993.
Mass-based photosynthesis--N relationships were weaker than area-based relationships for needles collected in the autumn and winter of 1992 (data not shown). However, r2 of the mass-based photosynthesis--N relationship in September
1993 was 0.68, a value similar to that of the area-based expres-sion (Figure 3A). Because only sun needles from the third whorl were examined in September 1993, the relative strength of mass-based and area-based relationships may depend on whether the relationship is examined across canopy light gra-dients. This is consistent with previous reports of a lack of mass-based correlations between the light-saturated rate of CO2 assimilation and N content across canopy light gradients (e.g., DeJong et al. 1989, Ellsworth and Reich 1993). In addi-tion to the similar r2 value, the slope of the mass-based photo-synthesis--N relationship (3.35 µmol O2 (g N)−1 s−1) was similar to that of the area-based relationship in September 1993 (Figure 3A).
Dependence of dark respiration on gross oxygen evolution and nitrogen content
The correlation between the rate of dark respiration measured as O2 uptake and the preceding rate of gross O2 evolution in current-year needles was relatively strong both in autumn and early winter 1992 (Figure 4A). This relationship appeared to be maintained when the rate of O2 evolution during preillumi-nation was varied by changing the irradiance (data not shown; cf. Strand 1995). For samples collected in September 1993, the rate of O2 uptake, whether expressed on a projected needle area basis or on a dry mass basis, was significantly higher in current-year needles of IL trees than in current-year needles of C and I trees (Table 3). Furthermore, a linear relationship between the rate of dark respiration and the preceding rate of gross O2 evolution across treatments was obtained, regardless of whether rates were expressed on a needle area basis (Fig-ure 5A) or on a dry mass basis (r2 = 0.509; P < 0.0001). Similarly, Stokes et al. (1990) observed an enhancement of O2 uptake after minutes of preillumination, which persisted for about 10 min in darkness. This light-enhanced dark respiration was dependent on the amount of preceding photosynthesis and was attributed to reoxidation of early photosynthetic products in the chloroplast stroma. After short periods of preillumina-tion, the enhancement of O2 uptake is probably not accompa-nied by a corresponding enhancement of CO2 efflux (Stokes
et al. 1990). However, after longer periods of preillumination (hours), the rate of CO2 efflux in darkness can be correlated positively with the amount of preceding photosynthesis in mature leaves (e.g., Azcón-Bieto and Osmond 1983). This effect of photosynthesis on subsequent respiration is thought to be mediated by an accumulation of nonstructural carbohy-drates in the leaves (Bieto and Osmond 1983, Azcón-Bieto 1992).
In addition to the content of nonstructural carbohydrates, leaf N content may be correlated with CO2 efflux in darkness (Hirose and Werger 1987, Sheriff and Nambiar 1991,
Wull-schleger et al. 1992, Ryan 1995). For example, Ryan (1995) found that CO2 efflux at night was correlated with needle N content in fully expanded foliage of several species of conifers when data were expressed on a dry mass basis. However, dark respiration and leaf N content have also been reported to be unrelated (e.g., Byrd et al. 1992). For current-year needles collected in autumn and early winter 1992, the rate of O2 uptake was equally well correlated with N content as with the preceding rate of O2 evolution (Figure 4B cf. Figure 4A), whereas the rate of dark respiration for current-year needles in September 1993 was less dependent on N content than on the Figure 4. Rate of dark respiration measured after 5 min in darkness as
a function of the preceding rate of gross oxygen evolution at an irradiance of 1020 ± 10 µmol m−2 s−1 (A), and nitrogen content (B) in current-year sun (control: s, d; irrigated-fertilized: e, r) and shade (control: ,, .; irrigated-fertilized: h, j) needles of Picea abies in September--October (open symbols, solid line) and December (filled symbols, broken line), 1992. Regression equations are given in the figures.
previous rate of photosynthesis (Figure 5B cf. Figure 5A). Although the relationships between dark respiration rate and N content may indirectly result from correlations between O2 evolution rate and N content (Figures 2A and 3A), the portion of dark respiration associated with protein repair and replace-ment is often thought to increase with increasing N content (Ryan 1991, 1995). It is possible that the rate of dark respira-tion measured after periods of darkness longer than those used in the present study would be more closely linked to needle N or protein content than to the preceding rate of photosynthesis.
Relationship between chlorophyll fluorescence and gross oxygen evolution
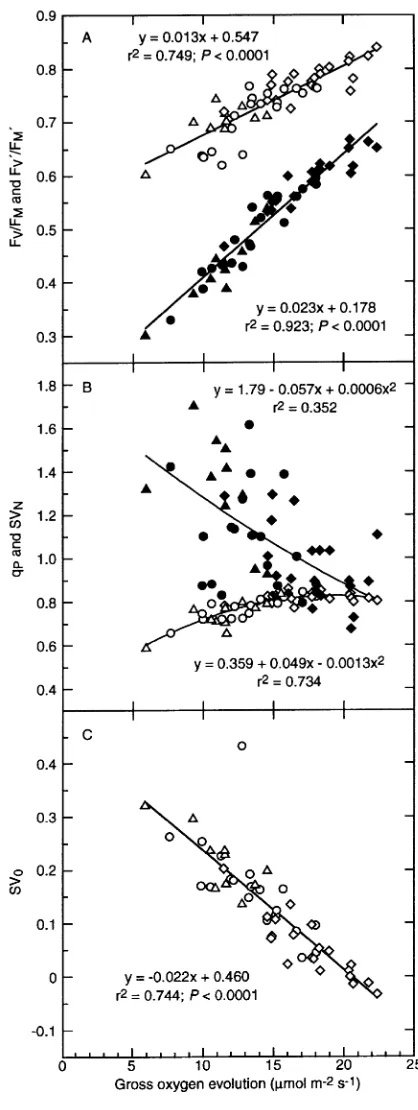
The FV/FM ratio was significantly higher in current-year need-les of IL trees than in current-year needneed-les of C and I trees, whereas FV′/FM′ was significantly different between all three treatments in September 1993 (Table 3). These results are in agreement with those obtained in autumn 1992 (Strand 1995), although only four or five trees from each of the C and IL treatments were examined that year. Both FV/FM and FV′/FM′ were strongly correlated with the rate of gross O2 evolution at an irradiance of 600 µmol m−2 s−1 (Figure 6A) and, presum-ably, also with the rate of photosynthetic electron transport. In the model of Genty et al. (1989), FV′/FM′ represents the quan-tum efficiency of open PS II reaction centers, which is assumed to depend on thermal energy dissipation in the antennae. Non-radiative energy dissipation is considered to be a ubiquitous mechanism for protection of the photosynthetic reaction cen-ters against excessive excitation (Demmig-Adams and Adams III 1992, Björkman and Demmig-Adams 1994, Long et al. 1994). Nitrogen limitation, which restricts the utilization of excitation energy in photosynthetic electron transport at high irradiances (see Evans 1989), presumably increases the amount of excessive light energy in PS II. Consequently, the observed response of FV′/FM′ to changes in O2 evolution rate seems appropriate.
Nonradiative energy dissipation according to the Stern-Vol-mer equation (SVN) was significantly lower in needles of C and IL trees than in needles of I trees, whereas Stern-Volmer quenching of minimum fluorescence (SV0) was significantly lower in needles of IL trees than in needles of C and I trees (Table 3). Values of SVN were only weakly correlated with
FV/FM and FV′/FM′ (data not shown), and with the gross rate of O2 evolution (Figure 6B). In contrast, the relationship between SV0 and O2 evolution rate was strong (Figure 6C). Further-more, SV0 was strongly correlated with FV/FM and FV′/FM′, but only weakly correlated with SVN (data not shown). The proportion of open PS II reaction centers, as indicated by qP, decreased slightly with a decreasing rate of photosynthesis (Figure 6B). Because treatment-related differences in qP ex-isted (Table 3), needles from the different treatments may be differentially susceptible to excess light (cf. Ögren 1991), despite counteracting changes in thermal energy dissipation. The quantum efficiency of PS II (ΦPSII) differed significantly between the treatments (Table 3), primarily because of vari-ations in FV′/FM′. The relationship between ΦPSII and the apparent quantum yield of O2 evolution (the rate of gross O2
evolution/irradiance) in current-year needles during autumn and early winter 1992 (Strand 1995) was similar to that in one-year-old needles during spring and early summer 1992 (Strand and Lundmark 1995). A wide range of irradiances was used during the measurements in 1992, whereas in September 1993, the irradiance was fixed at approximately 600 µmol m−2 s−1. At this predetermined irradiance, ΦP S I I became line-arly related to the rate of gross O2 evolution (r2 = 0.883; P < 0.0001; data not shown). As noted above, other fluores-cence characteristics (FV/FM, FV′/FM′and SV0) were also closely correlated with the rate of CO2-saturated photosynthe-sis (Figures 6A and 6C). This suggests that the level of excita-tion energy in PS II of Norway spruce needles is tightly regulated at high irradiances when photosynthetic electron transport is limited by the availability of N.
Conclusions
I conclude that a major part of the variation in CO2-saturated photosynthesis at high irradiances and at a particular time of the year is associated with differences in foliar N content, especially when photosynthetic rate and foliar N content are expressed on a projected needle area basis. However, further work is needed to document whether this is also true at typical CO2 concentrations in the field. Similar to the gross rate of O2 evolution, the rate of dark respiration, measured as O2 uptake after 5 or 10 min of darkness, was positively correlated with needle N content in current-year needles. A positive linear relationship between the rate of dark respiration and the pre-ceding rate of photosynthesis was also obtained. Furthermore, certain chlorophyll fluorescence characteristics (variable to maximum fluorescence in the dark- and light-adapted states, as well as Stern-Volmer quenching of minimum fluorescence) indicative of nonradiative energy dissipation in PS II were strongly correlated with the gross rate of O2 evolution at a high fixed irradiance in current-year sun needles, implying that adjustments in the thermal energy dissipation within PS II had occurred in response to changes in photosynthetic electron transport.
Acknowledgments
I am grateful to Professor Sune Linder and Dr. Anders Ericsson for their comments on the manuscript. This investigation was supported by the Swedish Council for Forestry and Agricultural Research.
References
Azcón-Bieto, J. 1992. Relationships between photosynthesis and res-piration in the dark in plants. In Trends in Photosynthesis Research. Eds. J. Barber, M.G. Guerrero and H. Medrano. Intercept Ltd., Andover, U.K., pp 241--253.
Azcón-Bieto, J. and C.B. Osmond. 1983. Relationship between pho-tosynthesis and respiration. The effect of carbohydrate status on the rate of CO2 production by respiration in darkened and illuminated wheat leaves. Plant Physiol. 71:574--581.
Björkman, O. and B. Demmig-Adams. 1994. Regulation of photosyn-thetic light energy capture, conversion, and dissipation in leaves of higher plants. In Ecophysiology of Photosynthesis. Eds. E.-D. Schulze and M.M. Caldwell. Ecological Studies, Vol. 100. Sprin-ger-Verlag, Berlin, pp 17--47.
Byrd, G.T., R.F. Sage and R.H. Brown. 1992. A comparison of dark respiration between C3 and C4 plants. Plant Physiol. 100:191--198. DeJong, T.M., K.R. Day and R.S. Johnson. 1989. Partitioning of leaf nitrogen with respect to within canopy light exposure and nitrogen availability in peach (Prunus persica). Trees 3:89--95.
Demmig-Adams, B. and W.W. Adams III. 1992. Photoprotection and other responses of plants to high light stress. Annu. Rev. Plant Physiol. Plant Mol. Biol. 43:599--626.
Ellsworth, D.S. and P.B. Reich. 1993. Canopy structure and vertical patterns of related photosynthesis and related leaf traits in a decidu-ous forest. Oecologia 96:169--178.
Evans, J.R. 1989. Photosynthesis and nitrogen relationships in leaves of C3 plants. Oecologia 78:9--19.
Evans, J.R. 1993. Photosynthetic acclimation and nitrogen partition-ing within a lucerne crop. I. Canopy characteristics. Aust. J. Plant Physiol. 20:55--67.
Evans, J.R. and J.R. Seemann. 1989. The allocation of protein nitrogen in the photosynthetic apparatus: costs, consequences, and control. In Photosynthesis. Ed. W.R. Briggs. Plant Biology, Vol. 8. Alan R. Liss, Inc., New York, pp 183--205.
Evans, J.R. and I. Terashima. 1988. Photosynthetic characteristics of spinach leaves grown with different nitrogen treatments. Plant Cell Physiol. 29:157--165.
Farquhar, G.D. and S. von Caemmerer. 1982. Modelling of photosyn-thetic response to environmental conditions. In Physiological Plant Ecology II. Water Relations and Carbon Assimilation. Eds. O.L. Lange, P.S. Nobel, C.B. Osmond and H. Ziegler. Encycl. Plant Physiol. New Ser., Vol. 12B. Springer-Verlag, Berlin, pp 549--587. Field, C. and H.A. Mooney. 1986. The photosynthesis--nitrogen rela-tionship in wild plants. In On the Economy of Plant Form and Function. Ed. T.J. Givnish. Cambridge University Press, Cam-bridge, pp 25--55.
Flower-Ellis, J.G.K. 1993. Dry-matter allocation in Norway spruce branches: a demographic approach. Stud. For. Suec. 191:51--73. Genty, B., J.-M. Briantais and N.R. Baker. 1989. The relationship
between the quantum yield of photosynthetic electron transport and quenching of chlorophyll fluorescence. Biochim. Biophys. Acta 990:87--92.
Hirose, T. and M.J.A. Werger. 1987. Nitrogen use efficiency in instan-taneous and daily photosynthesis of leaves in the canopy of a Solidago altissima stand. Physiol. Plant. 70:215--222.
Krause, G.H. and E. Weis. 1991. Chlorophyll fluorescence and photo-synthesis: the basics. Annu. Rev. Plant Physiol. Plant Mol. Biol. 42:313--349.
Linder, S. 1995. Foliar analysis for detecting and correcting nutrient imbalances in Norway spruce. Ecol. Bull. 44:178--190.
Linder, S. and E. Troeng. 1980. Photosynthesis and transpiration of 20-year-old Scots pine. Ecol. Bull. 32:165--181.
Long, S.P., S. Humphries and P.G. Falkowski. 1994. Photoinhibition of photosynthesis in nature. Annu. Rev. Plant Physiol. Plant Mol. Biol. 45:633--662.
Makino, A., H. Nakano and T. Mae. 1994. Responses of ribulose-1,5-bisphosphate carboxylase, cytochrome f, and sucrose synthesis en-zymes in rice leaves to leaf nitrogen and their relationships to photosynthesis. Plant Physiol. 105:173--179.
Ögren, E. 1991. Prediction of photoinhibition of photosynthesis from measurements of fluorescence quenching components. Planta 184:538--544.
Ryan, M.G. 1991. Effects of climate change on plant respiration. Ecol. Appl. 1:157--167.
Ryan, M.G. 1995. Foliar maintenance respiration of subalpine and boreal trees and shrubs in relation to nitrogen content. Plant Cell Environ. 18:765--772.
Sage, R.F., T.D. Sharkey and R.W. Pearcy. 1990. The effect of leaf nitrogen and temperature on the CO2 response of photosynthesis in the C3 dicot Chenopodium album L. Aust. J. Plant Physiol. 17:135--148.
Schreiber, U., U. Schliwa and W. Bilger. 1986. Continuous recording of photochemical and non-photochemical chlorophyll fluorescence quenching with a new type of modulation fluorometer. Photosynth. Res. 10:51--62.
Seemann, J.R., T.D. Sharkey, J. Wang and C.B. Osmond. 1987. Envi-ronmental effects on photosynthesis, nitrogen-use efficiency, and metabolite pools in leaves of sun and shade plants. Plant Physiol. 84:796--802.
Sharkey, T.D. 1985. Photosynthesis in intact leaves of C3 plants: physics, physiology and rate limitations. Bot. Rev. 51:53--105. Sheriff, D.W. and E.K.S. Nambiar. 1991. Nitrogen nutrition, growth
and gas exchange in Eucalyptus globulus Labill. seedlings. Aust. J. Plant Physiol. 18:37--52.
Sheriff, D.W., E.K.S. Nambiar and D.N. Fife. 1986. Relationships between nutrient status, carbon assimilation and water use effi-ciency in Pinus radiata D. Don needles. Tree Physiol. 2:73--88. Smolander, H. and P. Oker-Blom. 1989. The effect of nitrogen content
on the photosynthesis of Scots pine needles and shoots. Ann. Sci. For. 46:473--475.
Stokes, D., D.A. Walker, C.P.L. Grof and G.G.R. Seaton. 1990. Light enhanced dark respiration. In Perspectives in Biochemical and Genetic Regulation of Photosynthesis. Ed. E. Zelitch. Plant Biol-ogy, Vol. 10. Alan R. Liss, Inc., New York, pp 319--338.
Strand, M. 1995. Inhibition of photosynthesis in current-year needles of unfertilized and fertilized Norway spruce (Picea abies (L.) Karst.) during autumn and early winter. Trees 9:332--340. Strand, M. and T. Lundmark. 1995. Recovery of photosynthesis in
1-year-old needles of unfertilized and fertilized Norway spruce (Picea abies (L.) Karst.) during spring. Tree Physiol. 15:151--158. Tan, W. and G.D. Hogan. 1995. Limitations to net photosynthesis as
affected by nitrogen status in jack pine (Pinus banksiana Lamb.) seedlings. J. Exp. Bot. 46:407--413.
Teskey, R.O., H.L. Gholz and W.P.J. Cropper. 1994a. Influence of climate and fertilization on net photosynthesis of mature slash pine. Tree Physiol. 14:1215--1227.
Teskey, R.O., D. Whitehead and S. Linder. 1994b. Photosynthesis and carbon gain by pines. Ecol. Bull. 43:35--49.
Thompson, W.A. and A.M. Wheeler. 1992. Photosynthesis by mature needles of field-grown Pinus radiata. For. Ecol. Manage. 52:225--242.
van Kooten, O. and J.F.H. Snel. 1990. The use of chlorophyll fluores-cence nomenclature in plant stress physiology. Photosynth. Res. 25:147--150.
Vapaavuori, E.M., A.H. Vuorinen, P.J. Aphalo and H. Smolander. 1995. Relationship between net photosynthesis and nitrogen in Scots pine: seasonal variation in seedlings and shoots. Plant Soil 169:263--270.