THE COMPARISON OF ITEMS‟ AND TESTEES‟ABILITY PARAMETER ESTIMATION
IN DICHOTOMOUS AND POLITOMUS SCORING
(STUDIES IN THE READING ABILITY OF TEST OF ENGLISH PROFICIENCY)
Heri Retnawati ([email protected])
Yogyakarta State University, Indonesia
Abstract
This study aimed to compare the testees‘ ability estimation in the politomus and
dichotomous scoring model. The data used in this study are the responses of testees to the Test of English Proficiency (TOEP) set 1 in reading subtest, which are usually scoring in dichotomous model then they are scoring in politomus model. In the reading subtest of TOEP, in one text presented several items related to the text. In the dichotomous scoring, each item is scored one by one item. As alternative, every item item is scored using dichotomous model separately, but for every text, the acquisition of these items are added to
the score attained politomous model. The estimation of items‘ and abilities‘ parameter in
dichotomous scoring were done using the Rasch models and in the politomous scoring were done with partial credit models using QUEST software. Comparative analysis of the two models are seen based on the average results of the estimated difficulty level, graphical analysis, calculating the correlation, and the results of the value of information function. The results of the analysis showed that the average item difficulty dichotomous scoring model is 0.486 with a standard deviation of 0.895 and the mean level of difficulty politomous scoring model is -0.105 with a standard deviation of 0.695. The correlations between abilities of participants using the dichotomous and the politomous scoring model is 0.94. The value of information function in the dichotomous scoring model is higher than in the politomous scoring models. These results indicate that the Reading of TOEP set 1,the dichotomous scoring model is better than the politomous scoring model.
Key Word: dichotomous scoring model, politomous scoring model, Reading, Test of
English Proficiency (TOEP)
Introduction
The scoring models for multiple-choice items typically using dichotomous scoring models, the correct answer is scored 1 and the wrong answer is scored 0. Similarly,to scoreresponses of English tests especially on reading subtest, a text usually consists of many questions, and each question is given a score of their own. The scoring of the correct answer is conducted to determine the ability of participants in the test directly.
The alternative ways is considering the text used in readingsubtest.A text and many items related the text are considered one item, which has many items of its supporters called testlet. The item supporting the textis scored individuallythe correct answer is scored 1 and the wrong answer is scored 0. The scores acquisition in the item is the sum of the scores
items‘ supporters. The model is called the scoring of politomous models.
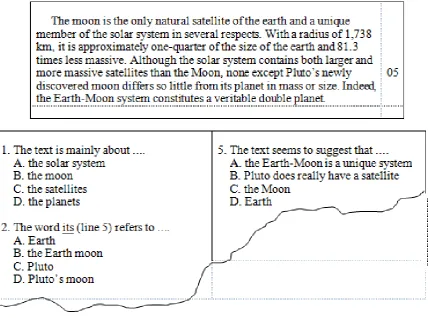
Figure 1.An Example of a Text and its Items Related onReading Subtest of TOEP 1
An item analysis to determine the characteristics of the item and estimate the ability of candidates can be done using the classical test theory and the item response theory. In item response theory with dichotomous scoring, the analysis that can be selected is the logistic model, of 1 parameter logistics (1PL, Rasch), 2 parameter logistics(2PL), and 3 parameter logistics(PL) (Hambleton&Swaminathan, Hambleton, Swaminathan& Rogers, Heriretnawati, 2014). In item response theory with politomous scoring model that can be used include partial credit model (PCM), graded response model (GRM) and generalized partial credit model (GPCM) (Van der Linden &Hambleton, 1997). Utilization of the politomus scoring models on reading subtest, especially in the Test of English Proficiency (TOEP) has not been done, including comparison the two models to know which model is better. Related to the politomoussorig model, this study compares the ability of participants to the estimate of the dichotomous and politomous scoring models on reading subtest of TOEP. The model compared in this study is a model for the Rasch (1PL) for dichotomous scoring model and
partial credit model (PCM) for politomous scoring model.
The equations used in the Rasch model(Hambleton, Swaminathan, and Rogers, 1991, Hulin, 1985) as follows:
Pi () =
) (
) (
1 i
i
b b
e e
, i : 1,2,3, …,n ………. (1)
Pi () : the testee probability at to answer i item corectly
: testee‘s ability
bi : item difficulty index for item-i
e : natural number (2,718)
n : the number item in test
The parameter bi is a point on the ability scale to have 50% probability to answer the
item correctly. Suppose a test item has parameter bi = 0.3 means that the required minimum of 0.3 on a scale of ability to be able to answer correctly with probability 50%. The greater
the value of the parameters bi, the greater the ability needed to answer correctly with
probability 50%. In other words, the greater the value of the parameters bi, the more difficult
the item.
The patial credit model (PCM) is an extension of the Rasch models, assuming different items has the same discrimination index. PCM has some similarities with the Graded Response Model on the items suspended in a tiered categories, but the difficulty in every step of the index does not need to be sequenced, a step can be more difficult than the
next step.
P = Probability of participants capable of obtaining a score category k to item j,
: The ability of the participants,
m + 1: the number of categories of j item,
bjk: index of item difficulty category j k
0
The score on the PCM category shows that the number of steps to complete the item
correctly. The higher scores category shows the greater ability than a lower score categories.
In PCM, if an item has two categories, then the equation 2 is an equation on the Rasch
models.
To compare the results of the estimation of the two scoring models used the average ratio
politomus models then correlated and made scater plot. It also conducted a comparison of the
value of the information function in both scoring models.
The item information functions is a method to describe the strength of an item on the
test and declared the contributions of items in uncovering the latent ability (latent trait) as
measured by the tests. Using the item information can be known which item fits with the
model that helps in the items selection. According to Hambleton and Swaminathan (1985),
mathematically, item information functionis defined as follows.
Ii () =
Birnbaum (Hambleton & Swaminathan, 1985: 107) in the equation follows.
Ii () =
ai: different power parameters of the i-th item
bi: item difficulty index parameter i-th
ci: pseudo guesses index (pseudoguessing) item ith
e: natural numbers whose values approaching 2,718
Based on the equation of the information function above, the information function satisfies
the properties:(1) in the item response logistic model, the information function of item
The value of information function on the politomous scoring is the sum of the value of
information function of each item category. In this regard, the value of information function
will be higher if the value of the information function of each category has a value. The item
information function (Ij()) can be defined mathematically as follows.
Ij () =
The value of the test information function is the sum of the value of information functions of
the test items (Hambleton&Swaminathan, 1985:94). In this regard, the value of the test
information function will be high if the items composing the test have a higher information
function. The value of informaton function of test (I()) can be defined mathematically as
The values of the item parameters and abilities are the estimation results. Because of
they were the estimation results, the truth is probabilistic and not liberated by error
measurement. In the item response theory, the standard error of measurement (SEM) is
closely related to the information function. The value of information function has inverse
quadratic relationship with SEM, the greater the information function, the SEM is smaller or
vice versa (Hambleton, Swaminathan, & Rogers, 1991, 94). If the value of the information
functionis expressed by Ii() and the estimated value of SEM revealed by SEM(), then
therelationship between the two, according to Hambleton, Swaminathan, & Rogers(1991: 94)
is expressed by
data esspesially on Reading subtest consisting of 50 items in 7 texts. The test responded by
high school students in four provinces, Jakarta, West Java, Yogyakarta, and East Java of
Indonesia, which involved 600 testees. The testees‘ responses was scored by the dichotomy
model at 50 items and the politoous models at 7 texts.
The analysis is carried out to compare the two scoring models that estimate the
participant's ability and item parameter estimates, descriptive analysis on the level of
dichotomy data, calculating the correlation of ability parameter of dichotomous and and
polytomous scoring model, and calculate the value of the function of both scoring model. The
results are compared qualitatively and quantitatively. The best model is a model produce
smaller SEM values or bigger value of information function.
Results and Discussion
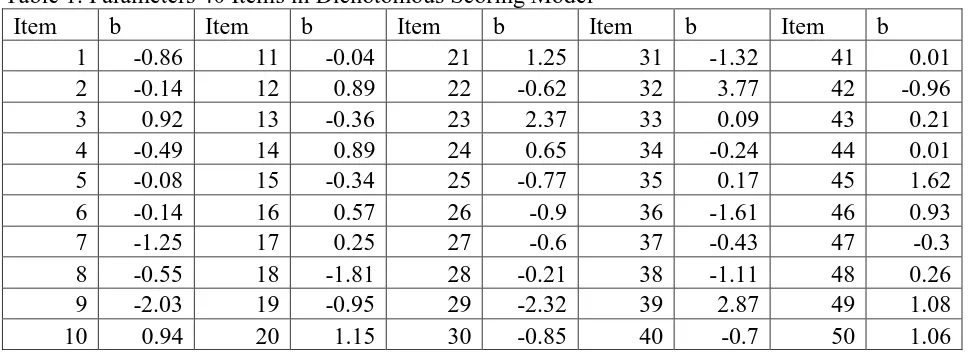
Using the Rasch model of assisted Quest omputer program, can be estimated item
parameters for the 50 items on Reading subtest. The estimation results are presented in Table
1. Based on these results, it can be derived that there are two easy items (numbers 9 and 29),
and there are three items that are difficult (numbers 23, 32, 39).
Table 1. Parameters 40 Items in Dichotomous Scoring Model
Item b Item b Item b Item b Item b
1 -0.86 11 -0.04 21 1.25 31 -1.32 41 0.01
2 -0.14 12 0.89 22 -0.62 32 3.77 42 -0.96
3 0.92 13 -0.36 23 2.37 33 0.09 43 0.21
4 -0.49 14 0.89 24 0.65 34 -0.24 44 0.01
5 -0.08 15 -0.34 25 -0.77 35 0.17 45 1.62
6 -0.14 16 0.57 26 -0.9 36 -1.61 46 0.93
7 -1.25 17 0.25 27 -0.6 37 -0.43 47 -0.3
8 -0.55 18 -1.81 28 -0.21 38 -1.11 48 0.26
9 -2.03 19 -0.95 29 -2.32 39 2.87 49 1.08
10 0.94 20 1.15 30 -0.85 40 -0.7 50 1.06
Using the partial credit model, the analysis carried out by the Quest computer
program, can be obtained parameters for the 50 items on Reading subtest with 7 texts. The
estimation results are presented in Table 2. The results obtained are in line with the results of
the analysis using Racsch models, there are two items that have a relatively easy categories
and three categories of items are relatively difficult.
Tabel 2. Parameters of Items‘ Category in Politomous Scoring Model
No. 1 2 3 4 5 6 7 8
1 -2.24 -1.77 -0.81 -0.62 -0.27 0.31 0.58 1.21
2 -1.75 -1.59 -0.82 -0.3 0.63 1.34 3.36
3 -2.15 -1.56 -0.61 -0.2 0.48 0.74 1.25 3.22
4 -1.66 -1.81 -1.08 -0.73 -0.15 0.14 0.9
5 -1.54 -1.32 -1.46 -0.59 0.52 1.59 2.89
6 -0.83 -1.18 -0.78 -0.4 0.19 0.67 2.97
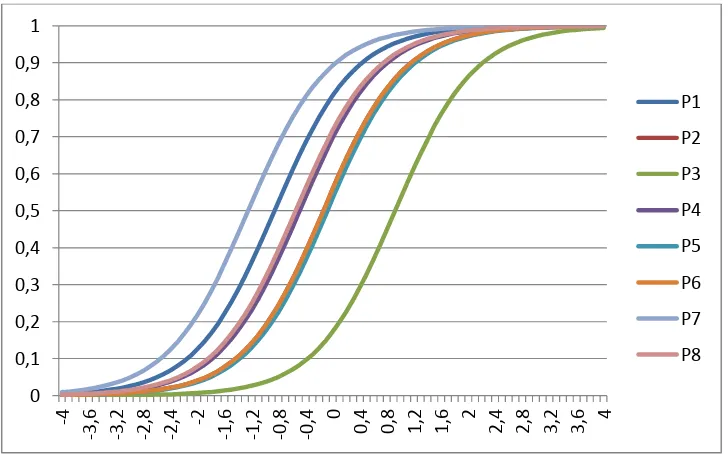
Based on the items parameters, can be made the image of item characteristic curve
for dichotomous scoring models. For example, the first text that consists of 8 items. Image
characteristic curve for grains in one text is presented in Figure 1. Observing that it can be
obtained that there are 2 items that have a similar level of difficulty, so that it can be
represented by two other items.
Figure1. The Item Characteristic Curves of 8 items Composing Text 1
The picture of item characteristic curve for politomus scoring presented in Figure 2. Looking at the picture, it is found that thecategories 4, 5, 6, and 7do not have a function to estimate the
pobability answering correctly or estimating the testee‘s ability. The category 4,5,6, and 7 have been represented by four other categories.
Figure 2. Category Response Curves of Items Composed Text 1
The estimation results of the testee‘s ability on the politomous and dichotomous scoring
model presented in Table 3. Based on these results, it is obtained that the result of estimation in dichotomous scoring model is higher than politomous scoring model. By considering the deviation standard, the result in dickotomous model is more varied than in the politomous
scoring model. More results are presented in Table 3 and Figure 3.
Table 3. Comparison of Mean and Standard Deviation of scoring dichotomy and Politomi Dikotomi Politomus
Rerata 0.048564 -0.10475
Stdev 0.854882 0.695381
Figure 3. Ability Estimation of Testees using Dichotomous and Politomus Scoring Model
The estimation results on the politomous and dichotomous scoring model are
relatively close. This is evidenced by scores on the correlation coefficient is 0.956 and
determination indexe is 0.914. Similarly, the scaterplot of estimation using dichotomous and
politoous scoring mosel, which shows the both scorings are correlated and close to the
prediction line y = 0.777 x -0142. More results are presented in Figure4.
-0,12 -0,1 -0,08 -0,06 -0,04 -0,02 0 0,02 0,04 0,06
Dicotomous
Figure 4.Relationship between Estimation Result of Testees‘ Ability
Using Dichotomous and Politomous Scoring Model
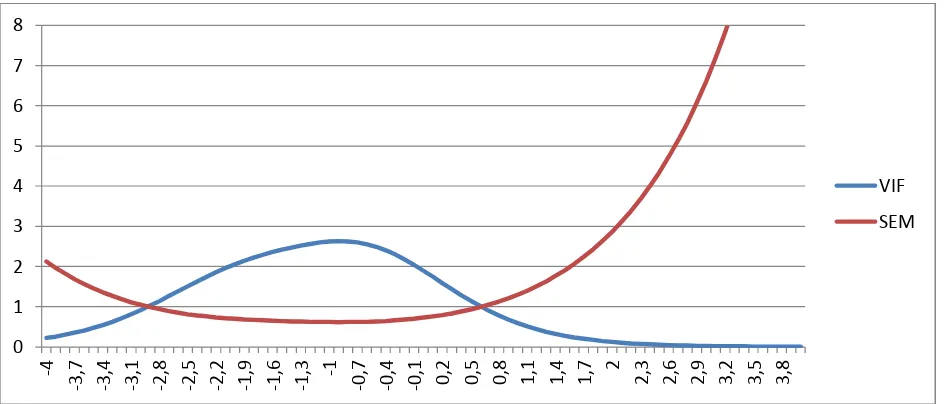
Using the parameters in evey item of text, the value of the information function (VIF)
can be estimated. The estimation results are summed then. The standard error of
measurement can also be estimated using the VIF. In text , VIF and SEM results presented
in Figure5 (on a dichotomous scoring model) and Figure 6 (on politomous scoring model).
Figure 5. VIF and SEM of Text 1 (Dichotomous Scoring Model)
y = 0.777x - 0.142
Theta (Dikotomous Scale)
Figure 5. VIF and SEM of Text 1 (Politomous Scoring Model)
In Figure 5, shows that the maximum value of the information function is 3.0 on a
scale of abilities equals to -0.3. In Figure 6, the maximum value of the information function
obtained 2.63 on a scale of abilities equals to -0.8. Look at Figure 5 and Figure 6, it can be
obtained that the value of the information function in dichotomous scoring model is higher
than politomous scoring model. In contrast, SEM in the dichotomous scoring model lower
than in politomus scoring model.
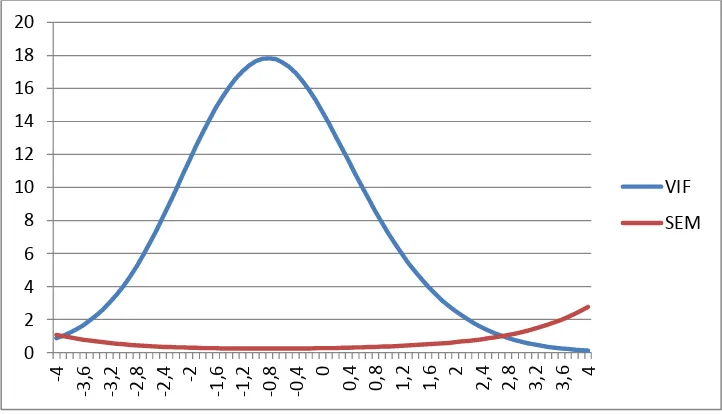
Figure 7. VIF and SEM of TOEP 1 (Dichotomous Scoring Model)
Similarly, the value of the information test function which is the total of the value of
item information functions. In Figure 7, shows that the maximum value is 23.5 on a scale
ability equals to -0.3. In Figure 8, the maximum value of the information function is 17.8 on a
scale ability equals to -0.9. Look at Figure 7 and Figure 8, it can be obtained that value of the
test information function in the dichotomous scoring model is higher than the value of the test
information functi in politomous scoring model. In contrast, the SEM of TOEP1 in
dichotomous scoring model is lower than the SEM of TOEP 1 in politomous scoring model.
Gambar 8. VIF dan SEM dari TOEP 1 (penskoran dikotomi)
Conclusion
The results of analysis on one TOEP specially in the Reading subtest showed that the
average item The results of the analysis showed that the average item difficulty dichotomous
scoring model is 0.486 with a standard deviation of 0.895 and the mean level of difficulty
politomous scoring model is -0.105 with a standard deviation of 0.695. The correlations
between abilities of participants using the dichotomous and the politomous scoring model is
0.94. The value of information function in the dichotomous scoring model is higher than in
the politomous scoring models. These results indicate that the Reading of TOEP set 1,the
dichotomous scoring model is better than the politomous scoring model.
Discussion
Considering the results of the estimation abilities using the dichotomous scoring model
and the politomous scoring model, it can be obtained that the estimation ability of testees in
are higher than in politomous scoring model. That were happened, because the items of
TOEP were developed from dichotomous Rasch scoring model.
These results probably occurred only in the case of the analysis of the TOEPresponse data.
Related to the stability of the estimation, whether the results are better in dichotomous
scoring models or politomous scoring model, it is still required a simulation study. This
simulation study can be considered a long test, politomous scoring models, the number of
testees, and estimation methods.
Referencies
Hambleton, R.K., Swaminathan, H & Rogers, H.J. (1991). Fundamental of item response
theory. Newbury Park, CA : Sage Publication Inc.
Hambleton, R.K. & Swaminathan, H. (1985). Item response theory. Boston, MA : Kluwer
Inc.
Heri Retnawati. (2014). Teori respons butir dan penerapannya. Yogyakarta: Parama Publishing.
Hullin, C. L., et al. (1983). Item response theory : Application to psichologycal measurement.
Homewood, IL : Dow Jones-Irwin.
Hambleton, R.K. & Swaminathan, H. (1985). Item response theory. Boston, MA: Kluwer Inc.
Muraki, E. (1999). New appoaches to measurement. Dalam Masters, G.N. dan Keeves, J.P.(Eds). Advances in measurement in educational research and assesment. Amsterdam : Pergamon.
Van der Linden, W.J., & Hambleton, R.K. (1997). Handbook of modern item response