COMPETING WITH
HIGH QUALITY DATA:
CONCEPTS, TOOLS, AND
TECHNIQUES FOR BUILDING
A SUCCESSFUL APPROACH
TO DATA QUALITY
Cover Design: C. Wallace
Cover Illustration: Abstract Background © iStockphoto/ aleksandarvelasevic This book is printed on acid-free paper.
Copyright © 2014 by John Wiley & Sons, Inc. All rights reserved Published by John Wiley & Sons, Inc., Hoboken, New Jersey Published simultaneously in Canada
No part of this publication may be reproduced, stored in a retrieval system, or transmitted in any form or by any means, electronic, mechanical, photocopying, recording, scanning, or otherwise, except as permitted under Section 107 or 108 of the 1976 United States Copyright Act, without either the prior written permission of the Publisher, or authorization through payment of the appropriate per-copy fee to the Copyright Clearance Center, 222 Rosewood Drive, Danvers, MA 01923, (978) 750-8400, fax (978) 646-8600, or on the web at www.copyright.com. Requests to the Publisher for permission should be addressed to the Permissions Department, John Wiley & Sons, Inc., 111 River Street, Hoboken, NJ 07030, (201) 748-6011, fax (201) 748-6008, or online at www.wiley.com/go/permissions.
Limit of Liability/Disclaimer of Warranty: While the publisher and author have used their best efforts in preparing this book, they make no representations or warranties with the respect to the accuracy or completeness of the contents of this book and specifically disclaim any implied warranties of merchantability or fitness for a particular purpose. No warranty may be created or extended by sales representatives or written sales materials. The advice and strategies contained herein may not be suitable for your situation. You should consult with a professional where appropriate. Neither the publisher nor the author shall be liable for damages arising herefrom.
For general information about our other products and services, please contact our Customer Care Department within the United States at (800) 762-2974, outside the United States at (317) 572-3993 or fax (317) 572-4002.
Wiley publishes in a variety of print and electronic formats and by print-on-demand. Some material included with standard print versions of this book may not be included in e-books or in print-on-demand. If this book refers to media such as a CD or DVD that is not included in the version you purchased, you may download this material at http://booksupport.wiley .com. For more information about Wiley products, visit www.wiley.com.
Library of Congress Cataloging-in-Publication Data: Jugulum, Rajesh.
Competing with high quality data: concepts, tools, and techniques for building a successful approach to data quality / Rajesh Jugulum.
pages cm Includes index.
ISBN 978-1-118-34232-9 (hardback); ISBN: 978-1-118-41649-5 (ebk.); ISBN: 978-1-118-42013-3 (ebk.); ISBN 978-1-118-84096-2 (ebk.).
1. Electronic data processing—Quality control. 2. Management. I. Title. QA76.9.E95J84 2014
004—dc23
2013038107 Printed in the United States of America
I owe Dr. Genichi Taguchi a lot for instilling in me the desire to pursue a quest for Quality and for all his help and support in molding
Contents
Foreword xiii
Prelude xv
Preface
xvii
Acknowledgments xix
1 The Importance of Data Quality
1
1.0 Introduction 1
1.1 Understanding the Implications of Data Quality 1
1.2 The Data Management Function 4
1.3 The Solution Strategy 6
1.4 Guide to This Book 6
Section I Building a Data Quality Program
2 The Data Quality Operating Model
13
2.0 Introduction 13
2.1 Data Quality Foundational Capabilities 13
2.1.1 Program Strategy and Governance 14
2.1.2 Skilled Data Quality Resources 14
2.1.3 Technology Infrastructure and Metadata 15
2.1.4 Data Profi ling and Analytics 15
2.1.5 Data Integration 15
2.1.6 Data Assessment 16
2.1.7 Issues Resolution (IR) 16
2.1.8 Data Quality Monitoring and Control 16
2.2 The Data Quality Methodology 17
2.2.1 Establish a Data Quality Program 17
2.2.2 Conduct a Current-State Analysis 17 2.2.3 Strengthen Data Quality Capability through
viii CONTENTS
2.2.4 Monitor the Ongoing Production Environment and Measure Data Quality Improvement
Effectiveness 18 2.2.5 Detailed Discussion on Establishing
the Data Quality Program 18
2.2.6 Assess the Current State of Data Quality 21
2.3 Conclusions 22
3 The DAIC Approach
23
3.0 Introduction 23
3.1 Six Sigma Methodologies 23
3.1.1 Development of Six Sigma Methodologies 25 3.2 DAIC Approach for Data Quality 28 3.2.1 The Defi ne Phase 28
3.2.2 The Assess Phase 31
3.2.3 The Improve Phase 36 3.2.4 The Control Phase (Monitor and Measure) 37
3.3 Conclusions 40
Section II Executing a Data Quality Program
4 Quantifi cation of the Impact of Data Quality
43
4.0 Introduction 43
4.1 Building a Data Quality Cost
Quantifi cation Framework 43
4.1.1 The Cost Waterfall 44
4.1.2 Prioritization Matrix 46 4.1.3 Remediation and Return on Investment 50
4.2 A Trading Offi ce Illustrative Example 51
4.3 Conclusions 54
5
Statistical Process Control and Its Relevance in
Data Quality Monitoring and Reporting
55
5.0 Introduction 55
5.1 What Is Statistical Process Control? 55
5.1.1 Common Causes and Special Causes 57
5.2 Control Charts 59
5.2.1 Different Types of Data 59
5.2.2 Sample and Sample Parameters 60
Contents ix
5.2.5 Other Control Charts 67 5.2.6 Multivariate Process Control Charts 69 5.3 Relevance of Statistical Process Control in
Data Quality Monitoring and Reporting 69
5.4 Conclusions 70
6 Critical Data Elements: Identifi cation,
Validation, and Assessment
71
6.0 Introduction 71
6.1 Identifi cation of Critical Data Elements 71
6.1.1 Data Elements and Critical Data Elements 71
6.1.2 CDE Rationalization Matrix 72
6.2 Assessment of Critical Data Elements 75
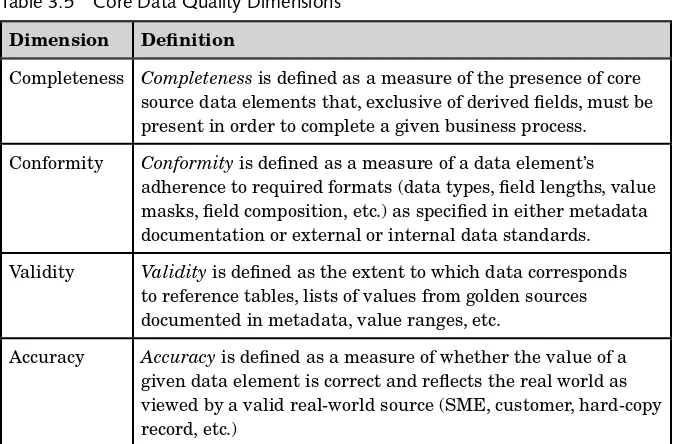
6.2.1 Data Quality Dimensions 76
6.2.2 Data Quality Business Rules 78
6.2.3 Data Profi ling 79
6.2.4 Measurement of Data Quality Scores 80
6.2.5 Results Recording and Reporting (Scorecard) 80
6.3 Conclusions 82
7
Prioritization of Critical Data Elements
(Funnel Approach) 83
7.0 Introduction 83
7.1 The Funnel Methodology (Statistical Analysis
for CDE Reduction) 83
7.1.1 Correlation and Regression Analysis
for Continuous CDEs 85 7.1.2 Association Analysis for Discrete CDEs 88 7.1.3 Signal-to-Noise Ratios Analysis 90
7.2 Case Study: Basel II 91
7.2.1 Basel II: CDE Rationalization Matrix 91 7.2.2 Basel II: Correlation and Regression Analysis 94 7.2.3 Basel II: Signal-to-Noise (S/N) Ratios 96 7.3 Conclusions 99
8 Data Quality Monitoring and Reporting Scorecards
101
8.0 Introduction 101 8.1 Development of the DQ Scorecards 102 8.2 Analytical Framework (ANOVA, SPCs, Thresholds,x CONTENTS
8.2.1 Thresholds and Heat Maps 103 8.2.2 Analysis of Variance (ANOVA) and
SPC Charts 107
8.3 Application of the Framework 109
8.4 Conclusions 112
9 Data Quality Issue Resolution
113
9.0 Introduction 113
9.1 Description of the Methodology 113
9.2 Data Quality Methodology 114
9.3 Process Quality/Six Sigma Approach 115
9.4 Case Study: Issue Resolution Process Reengineering 117 9.5 Conclusions 119
10 Information System Testing 121
10.0 Introduction 121 10.1 Typical System Arrangement 122 10.1.1 The Role of Orthogonal Arrays 123 10.2 Method of System Testing 12310.2.1 Study of Two-Factor Combinations 123
10.2.2 Construction of Combination Tables 124
10.3 MTS Software Testing 126
10.4 Case Study: A Japanese Software Company 130 10.5 Case Study: A Finance Company 133 10.6 Conclusions 138
11 Statistical Approach for Data Tracing
139
11.0 Introduction 139 11.1 Data Tracing Methodology 139
11.1.1 Statistical Sampling 142
11.2 Case Study: Tracing 144 11.2.1 Analysis of Test Cases and CDE
Prioritization 144
11.3 Data Lineage through Data Tracing 149
11.4 Conclusions 151
12 Design and Development of Multivariate
Diagnostic Systems 153
12.0 Introduction 15312.1 The Mahalanobis-Taguchi Strategy 153
Contents xi
12.3 The Role of Orthogonal Arrays and Signal-to-Noise
Ratio in Multivariate Diagnosis 159 12.3.1 The Role of Orthogonal Arrays 159
12.3.2 The Role of S/N Ratios in MTS 161
12.3.3 Types of S/N Ratios 162
12.3.4 Direction of Abnormals 164
12.4 A Medical Diagnosis Example 172
12.5 Case Study: Improving Client Experience 175 12.5.1 Improvements Made Based on
Recommendations from MTS Analysis 177
12.6 Case Study: Understanding the Behavior
Patterns of Defaulting Customers 178 12.7 Case Study: Marketing 180 12.7.1 Construction of the Reference Group 181
12.7.2 Validation of the Scale 181
12.7.3 Identifi cation of Useful Variables 181 12.8 Case Study: Gear Motor Assembly 182 12.8.1 Apparatus 183 12.8.2 Sensors 184
12.8.3 High-Resolution Encoder 184
12.8.4 Life Test 185
12.8.5 Characterization 185 12.8.6 Construction of the Reference Group
or Mahalanobis Space 186 12.8.7 Validation of the MTS Scale 187
12.8.8 Selection of Useful Variables 188
12.9 Conclusions 189
13 Data Analytics 191
13.0 Introduction 19113.1 Data and Analytics as Key Resources 191
13.1.1 Different Types of Analytics 193 13.1.2 Requirements for Executing Analytics 195 13.1.3 Process of Executing Analytics 196 13.2 Data Innovation 197
13.2.1 Big Data 198
xii CONTENTS
14. Building a Data Quality Practices Center
209
14.0 Introduction 209
14.1 Building a DQPC 209
14.2 Conclusions 211
Appendix A
213
Equations for Signal-to-Noise (S/N) Ratios 213
Nondynamic S/N Ratios 213
Dynamic S/N Ratios 214
Appendix B
217
Matrix Theory: Related Topics 217 What Is a Matrix? 217
Appendix C
221
Some Useful Orthogonal Arrays 221 Two-Level Orthogonal Arrays 221 Three-Level Orthogonal Arrays 255
Index of Terms and Symbols
259
Foreword
Over the past few years, there has been a dramatic shift in focus in infor-mation technology from the technology to the inforinfor-mation. Inexpensive, large-scale storage and high-performance computing systems, easy access to cloud computing; and the widespread use of software-as-a-service, are all contributing to the commoditization of technology. Organizations are now beginning to realize that their competitiveness will be based on their data, not on their technology, and that their data and information are among their most important assets.
In this new data-driven environment, companies are increasingly uti-lizing analytical techniques to draw meaningful conclusions from data. However, the garbage-in-garbage-out rule still applies. Analytics can only be effective when the data being analyzed is of high quality. Decisions made based on conclusions drawn from poor quality data can result in equally poor outcomes resulting in signifi cant losses and strategic mis-steps for the company. At the same time, the seemingly countless numbers of data elements that manifest themselves in the daily processes of a mod-ern enterprise make the task of ensuring high data quality both diffi cult and complex. A well-ground data quality program must understand the complete environment of systems, architectures, people, and processes. It must also be aligned with business goals and strategy and understand the intended purposes associated with specifi c data elements in order to pri-oritize them, build business rules, calculate data quality scores, and then take appropriate actions. To accomplish all of these things, companies need to have a mature data quality capability that provides the services, tools and governance to deliver tangible insights and business value from the data. Firms with this capability will be able to make sounder deci-sions based on high quality data. Consistently applied, this discipline can produce a competitive advantage for serious practitioners.
xiv FOREWORD
are presented in a simple and straightforward manner. The relevant materials are organized into two sections- Section I focuses on building an effective data quality program, while Section II concentrates on the tools and techniques essential to the program’s implementation and execution. In addition, this book explores the relationship between data analytics and high-quality data in the context of big data as well as providing other important data quality insights.
The application of the approaches and frameworks described in this book will help improve the level of data quality effectiveness and effi -ciency in any organization. One of the book’s more salient features is the inclusion of case examples. These case studies clearly illustrate how the application of these methods has proven successful in actual instances.
This book is unique in the fi eld of data quality as it comprehensively explains the creation of a data quality program from its initial planning to its complete implementation. I recommend this book as a valuable addition to the library of every data quality professional and business leader searching for a data quality framework that will, at journey’s end, produce and ensure high quality data!
John R. Talburt Professor of Information Science and Acxiom Chair of Information
Prelude
When I begin to invest my time reading a professional text, I wonder to what degree I can trust the material. I question whether it will be rele-vant for my challenge. And I hope that the author or authors have applied expertise that makes the pages in front of me worthy of my personal commitment. In a short number of short paragraphs I will address these questions, and describe how this book can best be leveraged.
I am a practicing data management executive, and I had the honor and privilege of leading the author and the contributors to this book through a very large-scale, extremely successful global data quality program design, implementation, and operation for one of the world’s great fi nancial ser-vices companies. The progressive topics of this book have been born from a powerful combination of academic/intellectual expertise and learning from applied business experience.
I have since moved from fi nancial services to healthcare and am cur-rently responsible for building an enterprise-wide data management pro-gram and capability for a global industry leader. I am benefi ting greatly from the application of the techniques outlined in this book to positively affect the reliability, usability, accessibility, and relevance for my com-pany’s most important enterprise data assets. The foundation for this journey must be formed around a robust and appropriately pervasive data quality program.
Competing with High Quality Data chapter topics, such as how to construct a Data Quality Operating Model, can be raised to fully global levels, but can also provide meaningful lift at a departmental or data domain scale. The same holds true for utilizing Statistical Process Con-trols, Critical Data Element Identifi cation and Prioritization, and the other valuable capability areas discussed in the book.
xvi PRELUDE
Testing, Statistical Data Tracing, and Developing Multivariate Diagnostic Systems. Experiencing this range of capability is not only important to accommodate readers with different levels of experience, but also because the data quality improvement journey will often need to start with rudi-mentary base level improvements that later need to be pressed forward into fi ner levels of tuning and precision.
You can have confi dence in the author and the contributors. You can trust the techniques, the approaches, and the systematic design brought forth throughout this book. They work. And they can carry you from data quality program inception to pervasive and highly precise levels of execution.
Don Gray
Preface
According to Dr. Genichi Taguchi’s quality loss function (QLF), there is an associated loss when a quality characteristic deviates from its target value. The loss function concept can easily be extended to the data quality (DQ) world. If the quality levels associated with the data elements used in vari-ous decision-making activities are not at the desired levels (also known as specifi cations orthresholds), then calculations or decisions made based on this data will not be accurate, resulting in huge losses to the organization. The overall loss (referred to as “loss to society” by Dr. Taguchi) includes direct costs, indirect costs, warranty costs, reputation costs, loss due to lost customers, and costs associated with rework and rejection. The results of this loss include system breakdowns, company failures, and company bank-ruptcies. In this context, everything is considered part of society ( customers, organizations, government, etc.). The effect of poor data quality during the global crisis that began in 2007 cannot be ignored because inadequate information technology and data architectures to support the management of risk were considered as one of the key factors.
Because of the adverse impacts that poor-quality data can have, organi-zations have begun to increase the focus on data quality in business in general, and they are viewing data as a critical resource like others such as people, capital, raw materials, and facilities. Many companies have started to establish a dedicated data management function in the form of the chief data offi ce (CDO). An important component of the CDO is the data quality team, which is responsible for ensuring high quality levels for the underlying data and ensuring that the data is fi t for its intended purpose. The responsibilities of the DQ constituent should include build-ing an end-to-end DQ program and executbuild-ing it with appropriate con-cepts, methods, tools, and techniques.
xviii PREFACE
and techniques can be modifi ed and tailored to solve DQ problems. In addition, discussions on data analytics (including the big data context) and establishing a data quality practices center (DQPC) are also provided. This book is divided into two sections—Section I: Building a Data Quality program and Section II: Executing a Data Quality program— with 14 chapters covering various aspects of the DQ function. In the fi rst section, the DQ operating model (DQOM) and the four-phase DAIC approach are described. The second section focuses on a wide range of concepts, methodologies, approaches, frameworks, tools, and techniques, all of which are required for successful execution of a DQ program. Wherever possible, case studies or illustrative examples are provided to make the discussion more interesting and provide a practical context. In Chapter 13, which focuses on data analytics, emphasis is given to having good quality data for analytics (even in the big data context) so that ben-efi ts can be maximized. The concluding chapter highlights the importance of building an enterprise-wide data quality practices center. This center helps organizations identify common enterprise problems and solve them through a systematic and standardized approach.
I believe that the application of approaches or frameworks provided in this book will help achieve the desired levels of data quality and that such data can be successfully used in the various decision-making activities of an enterprise. I also think that the topics covered in this book strike a balance between rigor and creativity. In many cases, there may be other methods for solving DQ problems. The methods in this book present some perspectives for designing a DQ problem-solving approach. In the coming years, the methods provided in this book may become elementary, with the introduction of newer methods. Before that happens, if the contents of this book help industries solve some important DQ problems, while mini-mizing the losses to society, then it will have served a fruitful purpose.
I would like to conclude this section with the following quote from Arthur Conan Doyle’s The Adventure of the Copper Beeches:
“Data! Data!” I cried impatiently, “I cannot make bricks without clay.”
I venture to modify this quote as follows:
“Good data! Good data!” I cried impatiently, “I cannot make usable bricks without good clay.”
Acknowledgments
Writing this book was a great learning experience. The project would not have been completed without help and support from many talented and outstanding individuals.
I would like to thank Joe Smialowski for his support and guidance provided by reviewing this manuscript and offering valuable sugges-tions. Joe was very patient in reviewing three versions of the manuscript, and he helped me to make sure that the contents are appropriate and made sense. I wish to thank Don Gray for the support he provided from the beginning of this project and writing the Prelude to the book. I also thank Professor John R Talburt for writing the Foreword and his helpful remarks to improve the contents of the book. Thanks are also due to Brian Bramson, Bob Granese, Chuan Shi, Chris Heien, Raji Ramachandran, Ian Joyce, Greg Somerville, and Jagmeet Singh for their help during this project. Bob and Brian contributed to two chapters in this book. Chuan deserves special credit for his efforts in the CDE-related chapters ( Chapters 6 and 7), and sampling discussion in data tracing chapter (Chapter 11), and thanks to Ian for editing these chapters.
I would like to express my gratitude to Professor Nam P. Suh, and Dr. Desh Deshpande for the support provided by giving the quotes for the book.
I am also thankful to Ken Brzozowski and Jennifer Courant for the help provided in data tracing–related activities. Thanks are due to Shannon Bell for help in getting the required approvals for this book project.
xx ACKNOWLEDGMENTS
I am very grateful to John Wiley & Sons for giving me an opportunity to publish this book. I am particularly thankful to Amanda Shettleton and Nancy Cintron for their continued cooperation and support for this proj-ect. They were quite patient and fl exible in accommodating my requests. I would also like to thank Bob Argentieri, Margaret Cummins, and Daniel Magers for their cooperation and support in this effort.
Chapter 1
The Importance of Data Quality
1.0 INTRODUCTION
In this introductory chapter, we discuss the importance of data quality (DQ), understanding DQ implications, and the requirements for manag-ing the DQ function. This chapter also sets the stage for the discussions in the other chapters of this book that focus on the building and execution of the DQ program. At the end, this chapter provides a guide to this book, with descriptions of the chapters and how they interrelate.
1.1 UNDERSTANDING THE IMPLICATIONS
OF DATA QUALITY
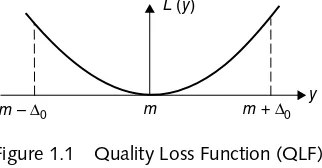
Dr. Genichi Taguchi, who was a world-renowned quality engineering expert from Japan, emphasized and established the relationship between poor quality and overall loss. Dr. Taguchi (1987) used a quality loss func-tion (QLF) to measure the loss associated with quality characteristics or parameters. The QLF describes the losses that a system suffers from an adjustable characteristic. According to the QLF, the loss increases as the characteristicy (such as thickness or strength) gets further from the target value (m). In other words, there is a loss associated if the quality characteristic diverges from the target. Taguchi regards this loss as a loss to society, and somebody must pay for this loss. The results of such losses include system breakdowns, company failures, company bankruptcies, and so forth. In this context, everything is considered part of society (cus-tomers, organizations, government, etc.).
2 THE IMPORTANCE OF DATA QUALITY
the loss is zero, or at the minimum. The equation for the loss function can be expressed as follows:
L(y(( ) = k(y(( −m)2 (1.1)
where k is a factor that is expressed in dollars, based on direct costs, indi-rect costs, warranty costs, reputational costs, loss due to lost customers, and costs associated with rework and rejection. There are prescribed ways to determine the value of k.
The loss function is usually not symmetrical—sometimes it is steep on one side or on both sides. Deming (1960) says that the loss function need not be exact and that it is diffi cult to obtain the exact function. As most cost calculations are based on estimations or predictions, an approximate function is suffi cient—that is, close approximation is good enough.
The concept of the loss function aptly applies in the DQ context, espe-cially when we are measuring data quality associated with various data elements such as customer IDs, social security numbers, and account bal-ances. Usually, the data elements are prioritized based on certain criteria, and the quality levels for data elements are measured in terms of percent-ages (of accuracy, completeness, etc.). The prioritized data elements are referred to as critical data elements (CDEs).
If the quality levels associated with these CDEs are not at the desired levels, then there is a greater chance of making wrong decisions, which might have adverse impacts on organizations. The adverse impacts may be in the form of losses, as previously described. Since the data quality levels are a “higher-the-better” type of characteristic (because we want to increase the percent levels), only half of Figure 1.1 is applicable when measuring loss due to poor data quality. Figure 1.2 is a better representa-tion of this situarepresenta-tion, showing how the loss due to variance from the tar-get by Δ0 increases when the quality levels are lower thanm and is given
Figure 1.1 Quality Loss Function (QLF) L (y)
m
y m + Δ0
Understanding the Implications of Data Quality 3
by L(y(( ). In this book, the target value is also referred to as the business specifi cation or threshold.
As shown in Figure 1.2, the loss will be at minimum when y attains a level equal tom. This loss will remain at the same level even if the qual-ity levels are greater than m. Therefore, it may be not be necessary to improve the CDE quality levels beyond m, as this improvement will not have any impact on the loss.
Losses due to poor quality can take a variety of forms (English, 2009), such as denying students entry to colleges, customer loan denial, incorrect prescription of medicines, crashing submarines, and inaccurate nutrition labeling on food products. In the fi nancial industry context, consider a situation where a customer is denied a loan on the basis of a bad credit history because the loan application was processed using the wrong social security number. This is a good example of a data quality issue, and we can imagine how such issues can compound, resulting in huge losses to the organizations involved. The Institute of International Finance and McKinsey & Company (2011) cite one of the key factors in the global fi nancial crisis that began in 2007 as inadequate information technology (IT) and data architecture to support the management of fi nancial risk. This highlights the importance of data quality and leads us to con-clude that the effect of poor data quality on the fi nancial crisis cannot be ignored. During this crisis, many banks, investment companies, and insurance companies lost billions of dollars, causing some to go bankrupt. The impacts of these events were signifi cant and included economic reces-sion, millions of foreclosures, lost jobs, depletion of retirement funds, and loss of confi dence in the industry and in the government.
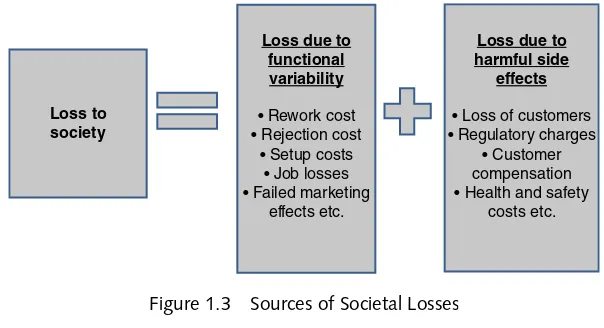
All the aforementioned impacts can be classifi ed into two categories, as described in Taguchi (1987): losses due to the functional variability of the
Figure 1.2 Loss Function for Data Quality Levels (Higher-the-Better Type of Characteristic)
m – Δ0 m
y L (y)
4 THE IMPORTANCE OF DATA QUALITY
process and losses due to harmful side effects. Figure 1.3 shows how all the costs in these categories add up.
In this section, we discussed the importance of data quality and the implications of bad data. It is clear that the impact of bad data is quite signifi cant and that it is important to manage key data resources effec-tively to minimize overall loss. For this reason, there is a need to establish a dedicated data management function that is responsible for ensuring high data quality levels. Section 1.2 briefl y describes the establishment of such a function and its various associated roles.
1.2 THE
DATA MANAGEMENT FUNCTION
In some organizations, the data management function is referred to as the chief data offi ce (CDO), and it is responsible for the oversight of vari-ous data-related activities. One way of overseeing data-related activities is to separate them into different components such as data governance, data strategies, data standards, and data quality. The data governance component is important because it navigates subsequent data-related activities. This includes drivers such as steering committees, program management aspects, project and change management aspects, compli-ance with organization requirements, and similar functions. The data strategy component is useful for understanding the data and planning how to use it effectively. Thedata standards component is responsible for ensuring that the various parties using the data share the same under-standing across the organization. This is accomplished by developing
Figure 1.3 Sources of Societal Losses Loss to
society
Loss due to functional variability
• Rework cost • Rejection cost
• Setup costs • Job losses • Failed marketing
effects etc.
Loss due to harmful side
effects
• Loss of customers • Regulatory charges
• Customer compensation • Health and safety
The Data Management Function 5
standards around various data elements and data models. The data quality component is responsible for cleaning the data and making sure that it is fi t for the intended purpose, so it can be used in various decision-making activities. This group should work closely with the data strategy component.
Please note that we are presenting one of the several possible ways of overseeing the data management function, or CDO. The CDO function should work closely with various functions, business units, and technol-ogy groups across the organization to ensure that data is interpreted consistently in all functions of the organization and is fi t for the intended purposes. An effective CDO function should demonstrate several key attributes, including the following:
• Clear leadership and senior management support • Key data-driven objectives
• A visual depiction of target areas for prioritization
• A tight integration of CDO objectives with company priorities and objectives
• A clear benefi t to the company upon execution
As this book focuses on data quality, various chapters provide descriptions of the approaches, frameworks, methods, concepts, tools, and techniques that can be used to satisfy the various DQ requirements, including the following:
• Developing a DQ standard operating model (DQOM) so that it can be adopted by all DQ projects
• Identifying and prioritizing critical data elements • Establishing a DQ monitoring and controlling scheme
• Solving DQ issues and performing root-cause analyses (RCAs) • Defi ning and deploying data tracing and achieving better data lineage • Quantifying the impact of poor data quality
All of these requirements are necessary to ensure that data is fi t for its purpose with a high degree of confi dence.
6 THE IMPORTANCE OF DATA QUALITY
1.3 THE
SOLUTION STRATEGY
Given the preference for satisfying DQ-related requirements while ensuring fi tness of the data with high quality levels, the top-level solution strategy focuses on building the DQ program and designing the methods for executing it. Having chosen a top-level solution strategy, the subre-quirements can be defi ned as shown in Figure 1.4.
Much of this book is concerned with expanding the solution strategy shown in Figure 1.4 with the help of a set of equations, concepts, and methods. In addition, discussions on data analytics (including the big data context) and establishing a data quality practices center (DQPC) are also provided.
1.4 GUIDE TO THIS BOOK
The chapters of this book are divided into two sections
.
Section I describes how to build a data quality program and Section II describes how to exe-cute the data quality program.Section I: Building a Data Quality Program. The fi rst section includes two chapters that describe the DQ operating model and DQ
Figure 1.4 DQ Solution Strategy
What does this book seek to achieve?
How will it be accomplished?
Satisfy DQ requirements and ensure data is fit for purpose with high
quality
Building DQ program and methods for DQ program
Execution
Satistical techniques such as quantification of impact of DQ framework, statistical process control, funnel approach, DQ scorecards, variation analysis, system testing, end-to-end data tracing approach, and multivariate diagnostic analytics. Issue
Guide to this Book 7
methodology. Chapter 2 emphasizes the importance of the data quality program structure, objectives, and management routines, and the port-folio of projects that need to be focused on to build and institutionalize processes that drive business value. Chapter 3 provides a description of the DQ methodology with the four-phase Defi ne, Assess, Improve, and Control (DAIC) approach. The emphasis here is on ensuring that every DQ project follows these phases to reduce costs, reduce man-ual processing or rework, improve reporting, or enhance the revenue opportunity.
Section II: Executing a Data Quality Program. The second section includes the remaining chapters of the book, which cover a wide range of concepts, methods, approaches, frameworks, tools, and techniques that are required for successful execution of a DQ program. Chapter 4 focuses on the quantifi cation of the impacts of poor data quality. Chapter 5 describes statistical process control (SPC) techniques and their relevance in DQ monitoring and reporting. Chapters 6 and 7 describe the CDE identifi cation, validation, and prioritization process, and Chapter 8 describes the importance of designing DQ scorecards and how they can be used for monitoring and reporting purposes. Chapter 9 provides an approach to resolve various issues affecting data quality. These issues can be related directly to the data or the processes providing the data.
8 THE IMPORTANCE OF DATA QUALITY
Table 1.1 Guide to This Book—Descriptions of Chapters
Section/Chapter Description
Chapter 1 This introductory chapter discusses the importance of data quality (DQ), understanding DQ implications, and the requirements for managing the data quality function.
Section I
Chapter 2 This chapter describes the building of a comprehensive approach and methodology (referred to as the data quality operating model) that allows us to understand the current state of data quality, organize around information critical to the enterprise and the business, and implement practices and processes for data quality measurement.
Chapter 3 This chapter discusses the four-phased Defi ne, Assess, Improve, and Control approach that can be used to execute DQ projects. This comprehensive approach helps readers understand several aspects of the DQ project life cycle.
Section II
Chapter 4 This chapter focuses on the methodology that can be used to quantify the impact of poor-quality data with an illustrative example.
Chapter 5 Chapter 5 describes the importance of statistical process control (SPC) along with descriptions of various control charts and the relevance of SPC in DQ monitoring and control.
Chapter 6 This chapter discusses how to identify CDEs, validate CDEs, and conduct CDE assessment with the help of data quality rules and data quality scores.
Chapter 7 This chapter discusses how to prioritize these CDEs and reduce the number of CDEs to be measured using the funnel approach. It also demonstrates the applicability of this approach using a case study.
Guide to this Book 9
Section/Chapter Description
Section II
Chapter 8 The purpose of this chapter is to describe a means to construct and implement effective DQ scorecards. Using the proposed approach, users can store, sort, and retrieve DQ defect information and perform remediation through statistical analysis.
Chapter 9 This chapter explains the linkage between data quality and process quality by providing an approach to resolve various issues affecting data quality. These issues can be related directly to the data or the processes providing the data
Chapter 10 This chapter describes a methodology that can be used to test the performance of a given system and identify failing factors that are responsible for poor information/data quality.
Chapter 11 This chapter describes the end-to-end data tracing methodology, its important aspects, and how it can be linked to data lineage to improve data quality accuracy.
Chapter 12 This chapter describes the Mahalanobis-Taguchi Strategy (MTS) and its applicability to developing a multivariate diagnostic system with a measurement scale. This type of diagnostic system is helpful in utilizing high-quality data in an effective way to come to meaningful conclusions.
Chapter 13 This chapter briefl y discusses the importance of data quality to performing high-quality analytics (including the big data context) and making appropriate decisions based on the analytics. It also discusses the role of data innovation and its relevance in modern industry.
Chapter 14 This chapter focuses on building a data quality practices center (DQPC) and its fundamental building blocks. Such a center will have the operational capability to provide services, tools, governance, and outputs to deliver tangible insights and business value from the data.
Section I
Chapter 2
The Data Quality Operating Model
1
2.0 INTRODUCTION
As mentioned in Chapter 1, the core purpose of the DQ program is to satisfy various requirements that ensure the data is fi t for its intended purpose and that it is of high quality. In order to satisfy these require-ments, we must have a systematic DQ program that can be applied to various DQ-related projects. The data quality program structure, objec-tives, management routines, and portfolio of projects need to be focused on building and institutionalizing processes and project results that drive business value. This chapter describes the building of such a comprehen-sive approach and methodology (referred to as the data quality operating model, or DQOM), which allows us to understand the current state of data quality, organize around information critical to the enterprise and the business, and implement practices and processes for data quality measurement.
2.1 DATA
QUALITY FOUNDATIONAL CAPABILITIES
The process of building and strengthening the data quality program requires a concerted effort across business, technology, operations, and executive teams. The focus throughout is to continuously build, enhance, and extend the DQ capabilities across the organization. Once implemented, these capabilities constitute a steady-state operating environment that actively defi nes, manages, measures, and improves the quality of the data that is critical to key business processes through-out the enterprise. In the process of doing this, the business can achieve
14 THE DATA QUALITY OPERATING MODEL
more comprehensive, complete, valid, accurate, and timely informa-tion, enabling better decision making and faster and more accurate responses to customers and regulators. Additional benefi ts, including cost and resource effi ciencies, enhanced decision making, and reve-nue-generating opportunities, can be derived by implementing the data quality operating model. The model described in this chapter is designed to establish data quality capabilities while building robust program structures and executing data quality improvement projects. As project teams work on the various aspects of the program planning and execution, they should fi nd that each and every task contributes to such benefi ts. Stronger data quality capabilities increase confi dence in the data that supports products, services, analytics, and reporting. These capabilities also increase the effectiveness and effi ciency of the company’s operations. The following is a list of various DQ capabilities, along with brief descriptions.
2.1.1 Program Strategy and Governance
Strategy and governance include a plan for understanding the current state of data quality for critical data and how to improve DQ to meet the strategic goals of the enterprise. The data quality governance should be aligned with the existing data governance structure, policies, and processes. The DQ program must have a governance structure with associated management disciplines, including established roles as well as organizational commitment, sponsorship, and leadership at senior management levels.
2.1.2 Skilled Data Quality Resources
Data Quality Foundational Capabilities 15
activities; managing ongoing data quality monitoring; and performing issues processing.
2.1.3 Technology
Infrastructure and Metadata
This capability includes the methods and tools required to measure, analyze, report, defi ne, collect, and manage information associated with critical data (i.e., data required for critical processes and reporting). This means evaluating and recommending data quality tools (e.g., rules engines, data profi ling tools) and developing scorecard and dashboard templates and a data quality metadata repository.
The foundation of any data quality program lies in full understanding of the key processes, systems, and data required to support ongoing busi-ness operations. This information provides the context for all subsequent data quality activities and supports repeatable DQ processes. Metadata is gathered in the context of the execution of data quality projects and includes institutionalizing DQ rule descriptions, results, data profi les, error descriptions, and data steward and process ownership information. Successful data quality programs must establish the means to gather, manage, and update this information.
2.1.4 Data
Profi ling and Analytics
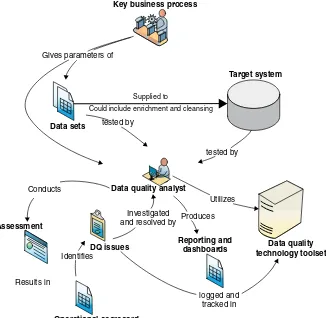
This includes the processes, tools, and skilled resources required to identify the characteristics and understand the meaning and structure of critical data, conduct root-cause and impact analyses, and develop conclusions and recommendations about the state of the critical data. Data quality analysts use data profi ling techniques to investigate the characteristics of subject data sets. Data profi ling results are essential for completing the activities associated with defi ning data quality rules for assessment and conducting ongoing analyses of target data sets.
2.1.5 Data Integration
16 THE DATA QUALITY OPERATING MODEL
2.1.6 Data Assessment
This capability is the combination of methodologies, analysis, and data quality rules used in measuring the quality of critical data. Assessments establish data quality levels for critical data at specifi ed points within the
data fl ow. This includes pre- and postdata acquisition, postprocessing, and pre–downstream subscription.
Assessment results, including the records whose critical data elements “fail” in one or more data quality rules, are presented for monitoring and analysis on a data quality scorecard. This scorecard, which provides a
basis for detailed analyses of data quality across defi ned measures of data
quality, or dimensions (discussed later in this chapter), is then used dur-ing ongodur-ing monitordur-ing and control activities. Additionally, assessment results form the basis of a formal data quality improvement plan that is developed in order to meet business-driven quality expectations.
2.1.7 Issues
Resolution
(IR)
The IR process encompasses the identifi cation, triage, tracking, and updat-ing of data quality issues. The IR triage and review processes include root-cause determination and remediation efforts and are executed through a governance process that includes business, operations, and technology. Data quality issues may result from initial (baseline) data quality assess-ments, from rule breaches detected during assessments performed as part of the periodic monitoring of critical data, or from observations received from business and/or operations personnel during normal business activi-ties and operations. Through this process, the data quality team deter-mines the root cause, proposes solutions, establishes return on investment for those solutions, and gets the data quality improvement projects in the queue with the correct priority based on the business value.
2.1.8 Data Quality Monitoring and Control
The Data Quality Methodology 17
data. These include operational-level review and management of indi-cators of poor quality, as well as resolution and logging within the IR processes. Also, this steady state includes established change manage-ment routines; design, developmanage-ment, and execution of data quality rules; fi ne-tuning based on subject-matter expert (SME) feedback; identifi cation of the cost of any detected data quality issues; and prioritization of data quality improvement based on return on investment.
2 .2 THE DATA QUALITY METHODOLOGY
It is important for an organization to implement the aforementioned strong data quality capabilities to improve the quality of data used in its key processes, with a structured and standardized approach for program implementation and project execution. This includes taking into account of the current state of affairs, building robust program governance and strategy, defi ning a set of data quality issues and projects, and establish-ing ongoestablish-ing steady-state processes. To achieve these, the program should undertake the following four major work streams.
2.2.1 Establish a Data Quality Program
Once the current state of the data quality infrastructure is understood, the executive sponsor needs to build a robust governance structure that includes business, operations, and technology participants. This will be used to facilitate execution of data quality projects and support the even-tual steady-state operating environment to be built at later stages. This process includes defi ning a program charter that states the business value resulting from improved data quality (this is the key measure of success for the program and subsequent efforts), as well as the scope of the pro-gram in terms of business processes and systems. In addition, the propro-gram should determine the operational support and technology applications through which the data quality capabilities are to be delivered. A detailed discussion on establishing a DQ program is explained in section 2.2.5.
2.2.2 Conduct a Current-State Analysis
18 THE DATA QUALITY OPERATING MODEL
It is important, during this exercise, that the team captures an initial set of issues that may be driving data quality. Any gaps and issues identifi ed in this effort will be accounted for during the execution of data quality projects.
2.2.3 Strengthen Data Quality Capability through
Data Quality Projects
The program, led by the executive sponsor, will build an associated data quality capability within the context of executing data quality projects. Here, the focus is on improving the quality of critical data, getting to the root cause, fi xing data quality issues, and engaging in proactive mea-surement as the catalyst for implementing better data quality manage-ment practices. The fi rst of these projects is likely to take more time as processes and capabilities are put in place and the organization has its fi rst experience of executing against the methodology. However, as more projects are executed, these capabilities and processes will mature, the execution time will decrease, and the results will have greater impact.
2.2.4 Monitor the Ongoing Production Environment
and Measure Data Quality Improvement Effectiveness
In this fi nal stage, the program ensures that ongoing monitoring of pro-duction data is leveraged and assessment, profi ling results, and scorecards are established during project execution. This stage should also ensure, through a systematic issue resolution (IR) process, that DQ issues are detected and addressed properly. In a steady state, data quality improve-ment should be prioritized based on the key business value defi ned during the project initiation.
In the subsequent sections, we discuss the fi rst two work streams: establishing the DQ program and assessing the current state of DQ in greater depth. In Chapter 3, we discuss the remaining two work streams as they are related to the four-phase DAIC (Defi ne, Assess, Improve, and Control) approach.
2 .2.5 Detailed Discussion on Establishing
the Data Quality Program
The Data Quality Methodology 19
the technology environment (assessment tools, analytical tools, metadata environment, etc.), the project portfolio, defi ned operational resources and procedures including issues management tools and routines, and a resource plan (including a training plan as applicable). At the end of this stage of the program, the team should be able to deliver a robust formal business value–based program charter. This work stream is also respon-sible for delivering the following four important activities.
Program Communications
Because it is important in any successful program, effective communica-tion of the core objectives and purpose of the program establish the foun-dation for the work and resource requests to follow. A workshop approach is one effective way to achieve this. The executive sponsor leads the workshop with key stakeholders to introduce the data quality program and helps them start to work on the current-state capabilities analysis. During the kickoff, the stakeholders document business processes, prod-ucts, and deliverables that are critical for high-quality data. They also document critical data, systems that support business processes and outcomes, and the known data quality issues. The group reviews the data quality project approach and identifi es key phase deliverables and roles. The kickoff concludes with a discussion of roles and responsibilities and management routines.
Defi ne Governance Structure with a Charter
The charter is the data quality program’s most important document, and it focuses on the business case (i.e., the business value to be realized by improving low-quality data). In addition, the governance structure must be documented by formalizing roles and responsibilities. This enables the executive sponsor to obtain resource commitments. The charter also includes the scope, program strategy, governance and management rou-tines, and operational and technology support.
Confi gure Technology Environments
20 THE DATA QUALITY OPERATING MODEL
Table 2.1 Desired Functionalities in Technology Environment
Functionality Description
Profi ling Tool selection needs to include a robust profi ling tool that allows the analyst to dig into the nature of target data sets to understand the current state of data. There are many tools in the market, but we have seen simple off-the-shelf tools used effectively in the right hands.
Data Quality Rules
Data quality rules help validate various data relationships and identifi cation and correct classifi cation of the majority of data problems. The key here is to discover all data quality rules and make sure they are well understood.
Metadata A key to the success of the program and subsequent projects is effective metadata governance and management. It is critical to select a tool that allows for the institutionalization of the information you gather as the program matures and projects are executed, as well as one that allows for ease of access and use of that information.Metadata is a broad term, so the program team needs to clearly defi ne what metadata needs to be collected. This includes information such as governance and roles (e.g., data stewards); systems; data dictionaries; extract, transfer, load (ETL) and data lineage detail; and data quality profi ling and assessment results.
Issues Management
This functionality may also be part of the metadata or reporting environments, but should include a workfl ow and escalation capability. Here, you should be able to track data quality issues coming from your ongoing assessments as well as other sources, and manage those issues through triage, root-cause analysis, and remediation.
Analytics As the program matures and larger sets of data quality
results are available, it is important to begin to conduct deeper analytics. This includes simple trending to more sophisticated statistical analytics described elsewhere in this book.
Reporting and Project Management
The Data Quality Methodology 21
Defi ne Monitor and Control Operating Guidelines
Data quality monitoring and issue management are capabilities that require special attention when establishing any data quality program. The operations and technology teams will establish resources and processes to support ongoing data quality assessment and monitoring activities.
2.2.6 Assess the Current State of Data Quality
This work stream provides a baseline understanding of a business area’s ability to defi ne, manage, track, and improve data quality. The objective here is to gain a clear documented view of the organization’s current data quality capabilities. This will be instrumental in defi ning the portfolio of projects by prioritizing areas for improvement by leveraging existing processes, tools, and specifi ed gaps. This work stream is responsible for delivering the following three important activities.
Defi ne Scope and Document Current State
The executive sponsor and team will lead the effort to identify and con-tact individuals and/or groups affected by the data quality efforts. This includes not only data management and technology teams and adminis-trators, but also business line consumers, analysts, and operational users. Documentation and artifacts are solicited from the key stakeholders to support data quality capabilities for the given process or business area. These artifacts should illustrate data quality capabilities, governance and program documentation, existing data quality architecture, data diction-aries and models, assessment results, operational dashboards, and report-ing. The assessment of capabilities should be based on the documentation collected and interviews with stakeholders and subject-matter experts. This assessment should rate each business area against the capabilities, as described earlier.
Collect Data Quality Details and Key Issues
22 THE DATA QUALITY OPERATING MODEL
Prepare a Data Quality Capabilities
Gap Analysis Report
Through this activity, a DQ capabilities gap analysis report has to be prepared to address any weaknesses within current data quality capabili-ties. This gap analysis is a major input in program building and planning. Identifi ed weaknesses in capability are mitigated through the execution of data quality projects.
2.3 CONCLUSIONS
The following are the conclusions of this chapter:
• This chapter highlights the importance of having a data quality operating model with a program structure with clearly defi ned objec-tives and management routines. With the DQ plan in place, it is important to focus on projects that drive business value. Establish-ment of a data quality program is very important for maximizing business value from good-quality data.
• Sound data quality capabilities are required to increase the effective-ness and effi ciency of the operations across the enterprise, thereby increasing the level of confi dence in the data that supports products, services, analytics, and reporting.
Chapter 3
The DAIC Approach
1
3.0 INTRODUCTION
As discussed, DQ programs contribute to building capability with the help of four important work streams to successfully manage and implement data quality. In Chapter 2, we discussed the fi rst two work streams that are related to DQ governance structure. In this chapter, we discuss the remaining two work streams that are focused on the portfolio of DQ proj-ects and the monitoring and control aspproj-ects with the Defi ne, Improve, Ana-lyze, and Control (DAIC) approach. This comprehensive approach helps us understand the current state of data quality, organize around information critical to the enterprise and the business, and implementation practices and processes for data quality measurement and improvement.
There are many standard project methodologies, such as Six Sigma approaches (like DMAIC and DMADV), that can be leveraged to create a DQ project approach to ensure good project execution. Before going into the details of the proposed DQ approach, let us briefl y discuss Six Sigma methodologies.
3.1 SIX SIGMA METHODOLOGIES
The Six Sigma is a business process methodology that allows companies to drastically improve their operational performance by designing and monitoring their business activities in ways that minimize waste and resource use while maximizing customer satisfaction through a collection of managerial, engineering, design, and statistical concepts. As described
in Jugulum and Samuel (2008), Motorola fi rst employed Six Sigma for
24 THE DAIC APPROACH
quality improvement and to gain competitive advantage for its electronic products. AlliedSignal then focused Six Sigma projects on cost reduction to realize over $2 billion in savings in a four-year period. General Elec-tric’s success with Six Sigma in the 1990s convinced other organizations to embrace the methodology. Similarly, fi nance companies like the Bank of America have also realized the importance of Six Sigma methodology and introduced it in their fi rms. Many billions of dollars have been saved through the implementation of Six Sigma projects. Six Sigma methodolo-gies revolve around the concept of variation. Variation exists everywhere in nature. No two objects in nature are exactly identical. Variation affects product performance, data quality, service quality, and process outputs, leading to rework, scrap, and premium freight, all of which can cause customer dissatisfaction. Variation causes uncertainty, risk, and poten-tial defects. There are two types of variation: controllable (or assignable) variation and uncontrollable (or chance) variation.
Uncontrollable variation, often referred to as common cause, is a stable or consistent pattern of variation over time (predictable). Controllable variation, referred to asspecial cause variation, is a pattern that changes over time (unpredictable). To control and reduce variation, we should fi rst understand, quantify, and interpret variation in a process or system. The purpose of Six Sigma methodologies is to identify the areas of variation, isolate root causes, optimize processes, and thereby reduce or minimize the impact of variation in products, processes, and services.
The fundamental approach with Six Sigma is embodied in the equa-tion Y=fff x( ).YY represents the dependent or the output variable we are interested in for improvement. It can be a quality parameter such as reliability, yield, or market share. x is an independent or input vari-able that affects the output varivari-ableY. Our objective is to characterize the relationship between YY andx. Once we understand this relationship, we can leverage the key variable to optimize the process and achieve the desired level of performance for Y. Six Sigma has a set of techniques that enables us to characterize and optimize the relationship between Y and
Y x.
Six Sigma Methodologies 25
3.1.1 Development of Six Sigma Methodologies
Six Sigma was fi rst developed as a statistics-based methodology to “Defi ne, Measure, Analyze, Improve, and Control” (DMAIC) manufacturing pro-cesses. To this end, its ultimate performance target is virtually defect-free processes and products (Six Sigma being the measure of 3.4 defects per million). Over a period of time, Six Sigma has evolved to become a vision, philosophy, goal, metric, improvement methodology, management system, and customer-centric strategy.
In the fi elds of probability and statistics,sigma (σ) represents the stan-dard deviation, a measure of variability. Generally, the term Six Sigma process or sigma level of a process or sigma value of a process means that if we have six standard deviations between the mean of a process and the specifi cation limits, virtually no item will exceed the specifi cation limits or business-defi ned thresholds.
As shown in Figure 3.1, the commonly accepted defi nition of a Six Sigma process is one that produces 3.4 defects per million opportunities. The defect calculations are based on normal distribution, as all the qual-ity characteristics are assumed to follow this distribution. In an ideal world, the normally distributed characteristics will be perfectly situated at a mean or nominal value, but in reality that is not the case, as the
LSL USL
3.4 ppm 0 ppm
+ _ 6 σ
+ _ 3 σ
1.5 σ μ
3.4 ppm
66803 ppm Specification
range
Figure 3.1 Concept of Variation and Sigma Level
26 THE DAIC APPROACH
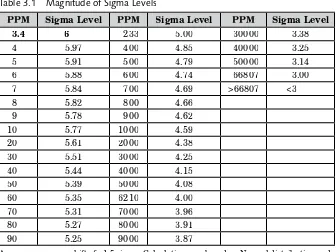
characteristics tend to deviate from the mean or nominal value. There is empirical evidence (McFadden, 1993) that in an average process the mean shifts by 1.5 times sigma over a long period of time. For this reason, all defect calculations are based on a 1.5 sigma (σ) process shift from the mean or nominal value. Table 3.1 shows the magnitude of various sigma levels for any given process, highlighting the importance of Six Sigma.
As mentioned, the Six Sigma approach is a business process–related project-driven methodology. These projects are executed through the DMAIC (Defi ne, Measure, Analyze, Improve, and Control) process. This methodology can be carried out in the steps shown in Figure 3.2.
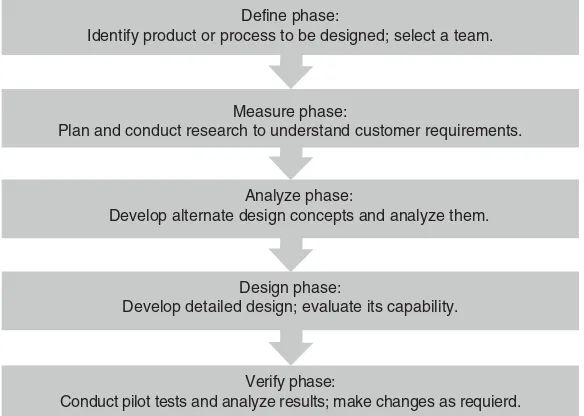
The DMAIC Six Sigma approach is useful when we are improving a particular process and aim to reduce the defect rate. If a particular pro-cess requires major redesign or if we need to design a product or propro-cess from the beginning, it is recommended that we use the Design for Six Sigma (DFSS) methodology. This DFSS methodology is also called the DMADV (Defi ne, Measure, Analyze, Design, and Verify) approach. The fi ve phases of DMADV are clearly described in Figure 3.3.
Table 3.1 Magnitude of Sigma Levels
PPM Sigma Level PPM Sigma Level PPM Sigma Level
3.4 6 233 5.00 30000 3.38
4 5.97 400 4.85 40000 3.25 5 5.91 500 4.79 50000 3.14 6 5.88 600 4.74 66807 3.00 7 5.84 700 4.69 >66807 <3
8 5.82 800 4.66
9 5.78 900 4.62
10 5.77 1000 4.59
20 5.61 2000 4.38
30 5.51 3000 4.25
40 5.44 4000 4.15
50 5.39 5000 4.08
60 5.35 6210 4.00
70 5.31 7000 3.96
80 5.27 8000 3.91
90 5.25 9000 3.87
Six Sigma Methodologies 27
Six sigma (DMAIC) methodology
Define phase:
Identify potential projects, select and define a project; select a team.
Control phase:
Measure new capability and institute control to maintain gains. Improve phase:
Determine process settings to most important variables. Analyze phase:
Collect and analyze data to determine critical variables/factors/CDEs. Measure phase:
Document the process and measure current capabliity.
Figure 3.2 DMAIC Methodology
Design for six sigma (DMADV) methodology
Define phase:
Identify product or process to be designed; select a team.
Verify phase:
Conduct pilot tests and analyze results; make changes as requierd. Design phase:
Develop detailed design; evaluate its capability. Analyze phase:
Develop alternate design concepts and analyze them. Measure phase:
Plan and conduct research to understand customer requirements.
28 THE DAIC APPROACH
3.2 DAIC APPROACH FOR DATA QUALITY
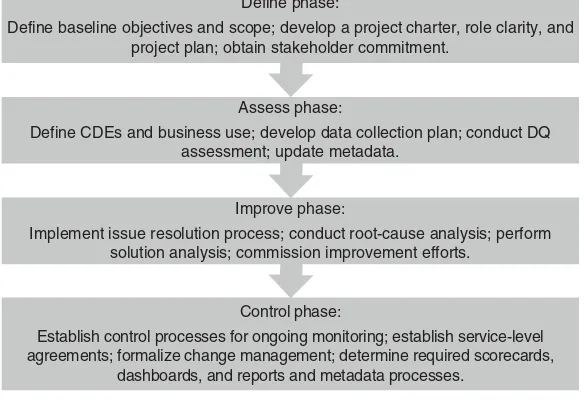
Here, the Six Sigma approaches have been modifi ed to build a Defi ne-Assess-Improve-Control (DAIC) approach for improving data quality. The following sections provide an explanation of the DQ methodology and its phases, as illustrated in Figure 3.4.
3.2.1 The
Defi ne Phase
This phase focuses on defi ning the project by establishing the scope, objectives, resource commitments, and project plans, and ensuring strong governance and stakeholder support. Broadly, there are two approaches for defi ning the overall scope of the project.
The data quality project scope can be established by selecting data critical to the targeted business process. The project focuses on under-standing the quality of that data supporting this critical process and establishing ongoing monitoring likewise in support of the given process. Any resulting data quality issues are then investigated via root-cause analysis, and remediation is managed through an established issue man-agement capability.
DQ (DAIC) methodology
Define phase:
Define baseline objectives and scope; develop a project charter, role clarity, and project plan; obtain stakeholder commitment.
Control phase:
Establish control processes for ongoing monitoring; establish service-level agreements; formalize change management; determine required scorecards,
dashboards, and reports and metadata processes. Improve phase:
Implement issue resolution process; conduct root-cause analysis; perform solution analysis; commission improvement efforts.
Assess phase:
Define CDEs and business use; develop data collection plan; conduct DQ assessment; update metadata.
DAIC Approach for Data Quality 29
The data quality project scope can also be established by selecting from the set of known DQ issues collected during the current-state analysis. Here, the project focuses on resolving key pain points with the quality of the data used in a given business process. For example, the objective in this case might read:
“In order to ensure the data quality of customer statements, we will defi ne, assess, and measure critical data supporting statements related to products x1 through x4, and establish strong ongoing DQ processes and monitoring in compliance with enterprise DQ standards. The process for gathering and cleansing the required data for these reports is currently estimated at x$ FTE and takes y days. It is expected that improvement in the data quality will alleviate the resource requirement for cleansing so that these resources may be used for greater value-added customer and product analysis.”
Regardless of how the data quality project is scoped, the project will enhance the data quality capability as follows:
• The metadata capability grows stronger through the knowledge obtained.
• The skills of the data quality personnel performing the projects grow stronger as profi ling and assessment tools and associated data qual-ity practices are utilized.
• The control capability grows stronger through the addition of new data quality scorecards.
• The issue resolution capability grows stronger through data quality issue logging, root-cause determination, and solution selection.
The following are the activities in the Defi ne phase:
Project charter: The most important activity in the Defi ne phase is the creation of the project charter. The project team establishes the scope and expected business value and creates the project charter. The charter needs to frame the data quality project and determine the objectives, scope, key participants, and resources. It should also outline broad time frames and core deliverables. A typical project charter should have the components shown in Table 3.2.
30 THE DAIC APPROACH
Table 3.2 Project Charter Contents
Charter
Content Description Example
Project Objective
Clear objective that can be evidenced by a success measure
“Reduce the number of customer
transaction statements that require manual interventions in order to improve straight-through processing by the end of fi rst quarter of 2014. Current manual interventions account for 3 FTEs per month and result in restatements and cost $xxx.”
Scope Detailed scope statements that defi ne process, systems, and data that will be included in the effort, as well as outlining goals and intended outcomes
The project will review data from customer transaction systems to support statement processing within the reporting operations. The effort will result in implementation of the data quality monitoring and issues management activities.
Roles Estimate resource requirements, roles
• DQ Analyst—1FTE • Project Manager—.5FTE • Operations—1FTE
• Technology Analyst—1FTE Timeline Project phase
timetables, tollgate/ milestone dates, and key deliverables
Defi ne Charter Project Plan dd/mm
Assess • Data dictionary • DQ rules, dimensions,
and thresholds • Data collection plan • Assessment results/
error records
• Data quality scorecard
dd/mm
Improve • Issues list • Root-cause results • Solutions/remediation • Recommendations
(with ROI)
dd/mm
Control • Service-level agreement with transaction systems • Monitoring plan • Management
dashboards
• Change management routines